| Model | Accuracy side | Speed side | Plain-language interpretation | Role in this review |
|---|---|---|---|---|
| S1 | Common theta plus testlet effects | One latent speed factor using all RT-bearing probes | All speededness is absorbed into one general zeta dimension. | Joint-model comparator |
| S2 | Common theta plus testlet effects | Baseline speed plus timed-math deviation components | Separates a student’s general speed tendency from extra timed-math speed effects. | Preferred joint-model candidate |
| S3 | Common theta plus testlet effects | One latent speed factor using timed-math probes only | Uses one simpler overall speed dimension without decomposing speed into subcomponents. | Main sensitivity challenger |
| S4 | Common theta plus testlet effects | Timed-math speed structure with added covariance complexity | Adds extra dependence structure on top of timed-math speed, making it the most complex option. | Over-specified alternative |
Joint Speed-Accuracy Model Review
Term 3 v5 R0 comparison of S1-S4, with S0 as benchmark only
1 Why this review matters
This page compares the candidate joint speed-accuracy models for the Term 3 v5 R0 run set. The aim is to choose the most psychometrically useful joint model of accuracy (theta) and speed (zeta).
S0 is included only as an accuracy-only benchmark. It is not part of the joint-model decision set.
2 What the candidate models mean
Formally, all four candidate models estimate the same underlying accuracy trait (theta) and differ mainly in how they parameterise the latent speed process (zeta).
In this report, “timed-math” means the timed arithmetic and magnitude-comparison style probes, not the separate speed-anchor probes such as STPM (and in Year 1, not STDD either). So the key distinction is:
S1: one general speed factor built from all RT-bearing probes, including the speed anchorsS3: one speed factor built only from the timed-math RT probes, excluding the speed anchorsS2: all-RT model that additionally decomposes speed into baseline plus timed-math deviationS4: timed-math-focused variant with extra covariance structure
At a high level, the shared accuracy side can be written as:
\[ \Pr(Y_{ij}=1) = \operatorname{logit}^{-1}(\theta_i + u_{it(j)} - b_j) \]
for binary items, where \(\theta_i\) is student \(i\)’s latent accuracy, \(u_{it(j)}\) is the testlet effect for the relevant item cluster, and \(b_j\) is item difficulty. For number-line items, the same latent accuracy enters a partial-credit measurement equation rather than a binary logit.
The models differ on the response-time side. Writing \(\log T_{ij}\) for log response time:
\[ \log T_{ij} \sim \mathcal{N}(\mu_{ij}^{(RT)}, \sigma_{g(j)}^2) \]
with different definitions of \(\mu_{ij}^{(RT)}\) by model:
S1: one-factor speed model
\[ \mu_{ij}^{(RT)} = \lambda_j - \zeta_i \]
S2: baseline speed plus timed-math deviation
\[ \mu_{ij}^{(RT)} = \lambda_j - \zeta_i^{(base)} - I_{\text{timed}}(j)\,\zeta_i^{(timed)} \]
S3: simpler one-factor speed model used as the main challenger
\[ \mu_{ij}^{(RT)} = \lambda_j - \zeta_i \]
S4: timed-math formulation with extra covariance structure layered on top of theS2-style decomposition
\[ \mu_{ij}^{(RT)} = \lambda_j - \zeta_i^{(base)} - I_{\text{timed}}(j)\,\zeta_i^{(timed)} \]
but with a richer covariance structure among the latent speed components.
S1andS3are both one-factor speed models, butS3is the simpler operational challenger carried forward in this comparison.S2is the richer decomposition: it allows speed to be split into a general baseline component and an additional timed-math-specific deviation.S4extends the timed-math formulation with extra covariance structure, which makes it the most complex specification.
In practice, the main decision is whether the richer decomposition in S2 earns its keep relative to the simpler S3. The latest construct-validity pass suggests that S2 does recover a baseline/general-speed factor, but that the resulting timed-math speed score stays extremely close to S3 for almost all students.
3 Executive decision
| Cohort | Winner | Mean theta SD | Teacher rho | Latest PAT rho | Verdict |
|---|---|---|---|---|---|
| Foundation | S2 | 0.437 | 0.392 | 0.213 | Preferred joint model |
| Year 1 | S2 | 0.398 | 0.489 | 0.515 | Preferred joint model |
S3is the preferred model when the intended construct is timed-math speed.S2remains a useful broader alternative when explicit baseline-speed adjustment is a reporting goal.S0remains useful as a benchmark for how much joint modelling adds, but not as a candidate answer to the speed question.
4 Main comparison table
| Cohort | Model | Role | Theta SD | Teacher rho | PAT rho (latest) | PAT rho (strict EOY) | Raw total rho | Speed-teacher rho | Speed-PAT rho | Max theta group R2 | Max speed group R2 | Verdict |
|---|---|---|---|---|---|---|---|---|---|---|---|---|
| Foundation | S1 | Other joint model | 0.439 | 0.386 | 0.217 | 0.290 | 0.676 | 0.217 | 0.142 | 0.026 | 0.025 | Competitive but not preferred |
| Foundation | S2 | Recommended | 0.437 | 0.392 | 0.213 | 0.307 | 0.672 | 0.207 | 0.148 | 0.027 | 0.021 | Preferred joint model |
| Foundation | S3 | Sensitivity challenger | 0.440 | 0.384 | 0.218 | 0.283 | 0.670 | 0.200 | 0.150 | 0.026 | 0.019 | Closest challenger |
| Foundation | S4 | Other joint model | 0.445 | 0.373 | 0.201 | 0.269 | 0.634 | 0.153 | 0.065 | 0.027 | 0.015 | Added complexity without payoff |
| Year 1 | S1 | Other joint model | 0.398 | 0.490 | 0.518 | 0.650 | 0.815 | 0.284 | 0.261 | 0.047 | 0.017 | Competitive but not preferred |
| Year 1 | S2 | Recommended | 0.398 | 0.489 | 0.515 | 0.647 | 0.816 | 0.288 | 0.281 | 0.047 | 0.020 | Preferred joint model |
| Year 1 | S3 | Sensitivity challenger | 0.398 | 0.490 | 0.509 | 0.649 | 0.810 | 0.290 | 0.277 | 0.048 | 0.022 | Closest challenger |
| Year 1 | S4 | Other joint model | 0.402 | 0.485 | 0.505 | 0.653 | 0.793 | 0.263 | 0.278 | 0.048 | 0.032 | Added complexity without payoff |
5 Benchmark only: S0 reference
| Cohort | Model | Theta SD | Teacher rho | PAT rho | Raw total rho | Bridge anchors |
|---|---|---|---|---|---|---|
| Foundation | S0 | 0.446 | 0.371 | 0.189 | 0.618 | 0 |
| Year 1 | S0 | 0.408 | 0.481 | 0.500 | 0.769 | 0 |
6 Plots
6.1 Core psychometric comparisons
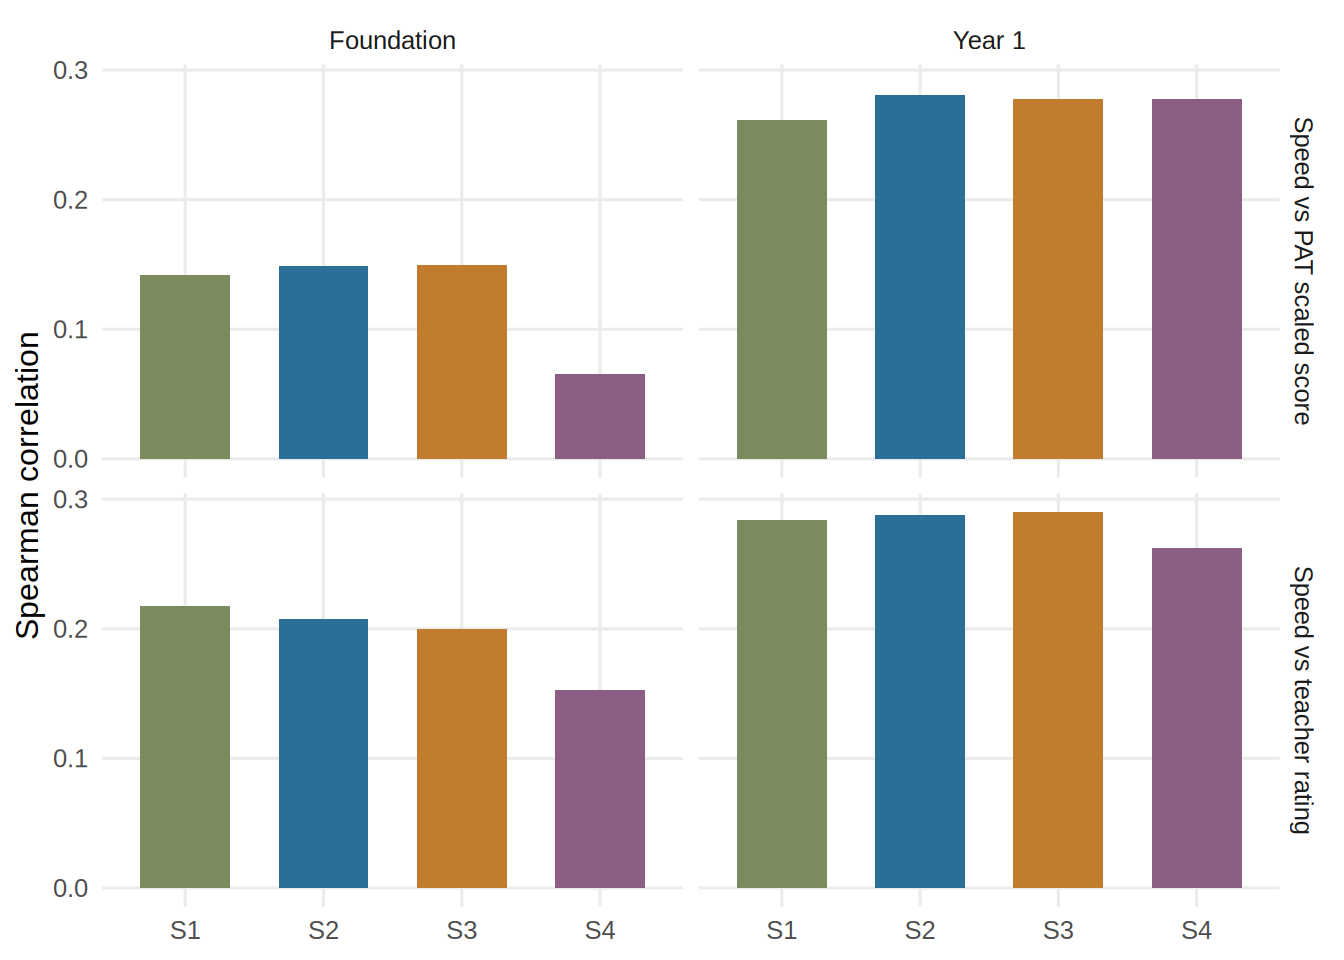
6.2 Speed validity signal

7 Cohort-by-cohort summary
7.1 Foundation
S2has the smallest meanthetauncertainty among the joint models.S3remains very close on the timed-math speed construct itself.- The practical difference between
S3andS2is small: only0.2%of Foundation students shift by two or more speed deciles. - For a cleaner timed-math interpretation,
S3is the simpler and more defensible choice.
7.2 Year 1
S2again has the smallest meanthetauncertainty.S3is almost tied on person-score precision and remains highly similar toS2on the timed-math speed score.- Only
0.3%of Year 1 students shift by two or more speed deciles when moving fromS2toS3. - That makes
S3the cleaner default unless explicit baseline-speed adjustment is required.
8 Construct-validity decision: S3 versus S2
8.1 Practical impact of choosing S3
| Cohort | Timed-speed correlation | Mean abs speed diff | P95 abs speed diff | Mean abs percentile shift | 2+ decile shifts | 2+ quintile shifts |
|---|---|---|---|---|---|---|
| Foundation | 0.994 | 0.016 | 0.044 | 1.910 | 0.2% | 0.2% |
| Year 1 | 0.998 | 0.010 | 0.028 | 1.051 | 0.3% | 0.1% |
The timed-math speed scores from S3 and S2 are almost identical in practice. S2 identifies a real baseline/general-speed factor, but that factor changes student timed-math speed bands only rarely.
8.2 Final validity pass for S3
| Cohort | Theta SD | Teacher rho | PAT rho (latest) | PAT rho (strict EOY) | Binary PPC misses | RT PPC misses | RT-accuracy misses | Max theta group R2 | Max speed group R2 |
|---|---|---|---|---|---|---|---|---|---|
| Foundation | 0.440 | 0.384 | 0.218 | 0.283 | 4/7 | 0/5 | 3/5 | 0.026 | 0.019 |
| Year 1 | 0.398 | 0.490 | 0.509 | 0.649 | 6/6 | 1/6 | 1/6 | 0.048 | 0.022 |
This final pass does not show a reason to reject S3 operationally. The remaining PPC and fit issues are shared broadly across models rather than uniquely concentrated in S3.
9 Structural fit
9.1 Posterior predictive checks
| cohort | model | domain | subgroups | misses |
|---|---|---|---|---|
| Foundation | S2 | Binary subgroup means | 7 | 4 |
| Foundation | S3 | Binary subgroup means | 7 | 4 |
| Year 1 | S2 | Binary subgroup means | 6 | 3 |
| Year 1 | S3 | Binary subgroup means | 6 | 6 |
| Foundation | S2 | RT subgroup means | 6 | 1 |
| Foundation | S3 | RT subgroup means | 5 | 0 |
| Year 1 | S2 | RT subgroup means | 8 | 0 |
| Year 1 | S3 | RT subgroup means | 6 | 1 |
| Foundation | S2 | RT-accuracy correlation | 6 | 3 |
| Foundation | S3 | RT-accuracy correlation | 5 | 3 |
| Year 1 | S2 | RT-accuracy correlation | 8 | 2 |
| Year 1 | S3 | RT-accuracy correlation | 6 | 1 |
Lower misses are better. S3 is slightly cleaner on some RT-focused checks, which supports the case for preferring the simpler timed-math construct when the practical difference from S2 is so small.
9.2 Item-fit summary
| cohort | model | domain | items | underfit | severe |
|---|---|---|---|---|---|
| Foundation | S2 | Binary items | 179 | 13 | 6 |
| Foundation | S3 | Binary items | 179 | 13 | 6 |
| Year 1 | S2 | Binary items | 293 | 25 | 8 |
| Year 1 | S3 | Binary items | 293 | 25 | 10 |
| Foundation | S2 | Number-line items | 20 | 0 | 0 |
| Foundation | S3 | Number-line items | 20 | 0 | 0 |
| Year 1 | S2 | Number-line items | 37 | 0 | 0 |
| Year 1 | S3 | Number-line items | 37 | 0 | 0 |
| Cohort | Model | Mean |z| | Mean RMSE z |
|---|---|---|---|
| Foundation | S2 | 0.724 | 0.983 |
| Foundation | S3 | 0.731 | 0.987 |
| Year 1 | S2 | 0.742 | 0.986 |
| Year 1 | S3 | 0.752 | 0.990 |
Binary item-fit issues are common across models, suggesting broad instrument-level misfit rather than a problem unique to one joint specification.
10 External validity
10.1 Teacher rating and PAT relationships
| Cohort | Model | Teacher rho | PAT rho (latest) | PAT rho (strict EOY) | Raw total rho |
|---|---|---|---|---|---|
| Foundation | S1 | 0.386 | 0.217 | 0.290 | 0.676 |
| Foundation | S2 | 0.392 | 0.213 | 0.307 | 0.672 |
| Foundation | S3 | 0.384 | 0.218 | 0.283 | 0.670 |
| Foundation | S4 | 0.373 | 0.201 | 0.269 | 0.634 |
| Year 1 | S1 | 0.490 | 0.518 | 0.650 | 0.815 |
| Year 1 | S2 | 0.489 | 0.515 | 0.647 | 0.816 |
| Year 1 | S3 | 0.490 | 0.509 | 0.649 | 0.810 |
| Year 1 | S4 | 0.485 | 0.505 | 0.653 | 0.793 |
The joint models all improve on the S0 benchmark for most external-validity slices. Among the joint candidates, S2 and S3 are the closest pair, and the current evidence does not show a large enough outcome-side gain to force the more complex S2 specification.
11 Fairness and proxy screens
| Cohort | Model | Max theta group R2 | Max speed group R2 |
|---|---|---|---|
| Foundation | S1 | 0.026 | 0.025 |
| Foundation | S2 | 0.027 | 0.021 |
| Foundation | S3 | 0.026 | 0.019 |
| Foundation | S4 | 0.027 | 0.015 |
| Year 1 | S1 | 0.047 | 0.017 |
| Year 1 | S2 | 0.047 | 0.020 |
| Year 1 | S3 | 0.048 | 0.022 |
| Year 1 | S4 | 0.048 | 0.032 |
The subgroup proxy screens are small overall. At this stage there is no strong evidence that the speed factors are mainly acting as proxies for demographic grouping variables.
12 Linking caveat
All reviewed R0 runs have n_bridge_anchors = 0. That means this report supports the within-Term-3 choice of a preferred joint model, but it does not establish anchor-based linking across forms or occasions.
13 Final recommendation
- Prefer
S3when the target construct is timed-math speed and the goal is a transparent, operationally simple model. - Use
S2only if a separate baseline/general-speed adjustment is explicitly required for interpretation or reporting. - On current evidence, that adjustment has only a modest practical effect on student timed-math speed scores.
- Keep
S0only as the benchmark reference, not as a candidate answer.