| Metric | Value |
|---|---|
| Total item-level responses | 2,247,811 |
| Unique students | 6,362 |
| Unique tests (test_id) | 69 |
| Test groups | arithmetic, decomp, mag_comp, match_quant, missing, numb_line, speed_test |
| Terms | 1, 3, 4 |
| Exam groups | 9 |
| Date range | 2025-03-24 to 2025-12-09 |
| Columns | 28 |
Numeracy Screening EDA - Internal Research Report (WIP)
Comprehensive Exploratory Data Analysis
1. Data Overview and Schema
This section provides a high-level summary of the dataset dimensions, column types, and response counts by key groupings.
1.1 Dataset Summary
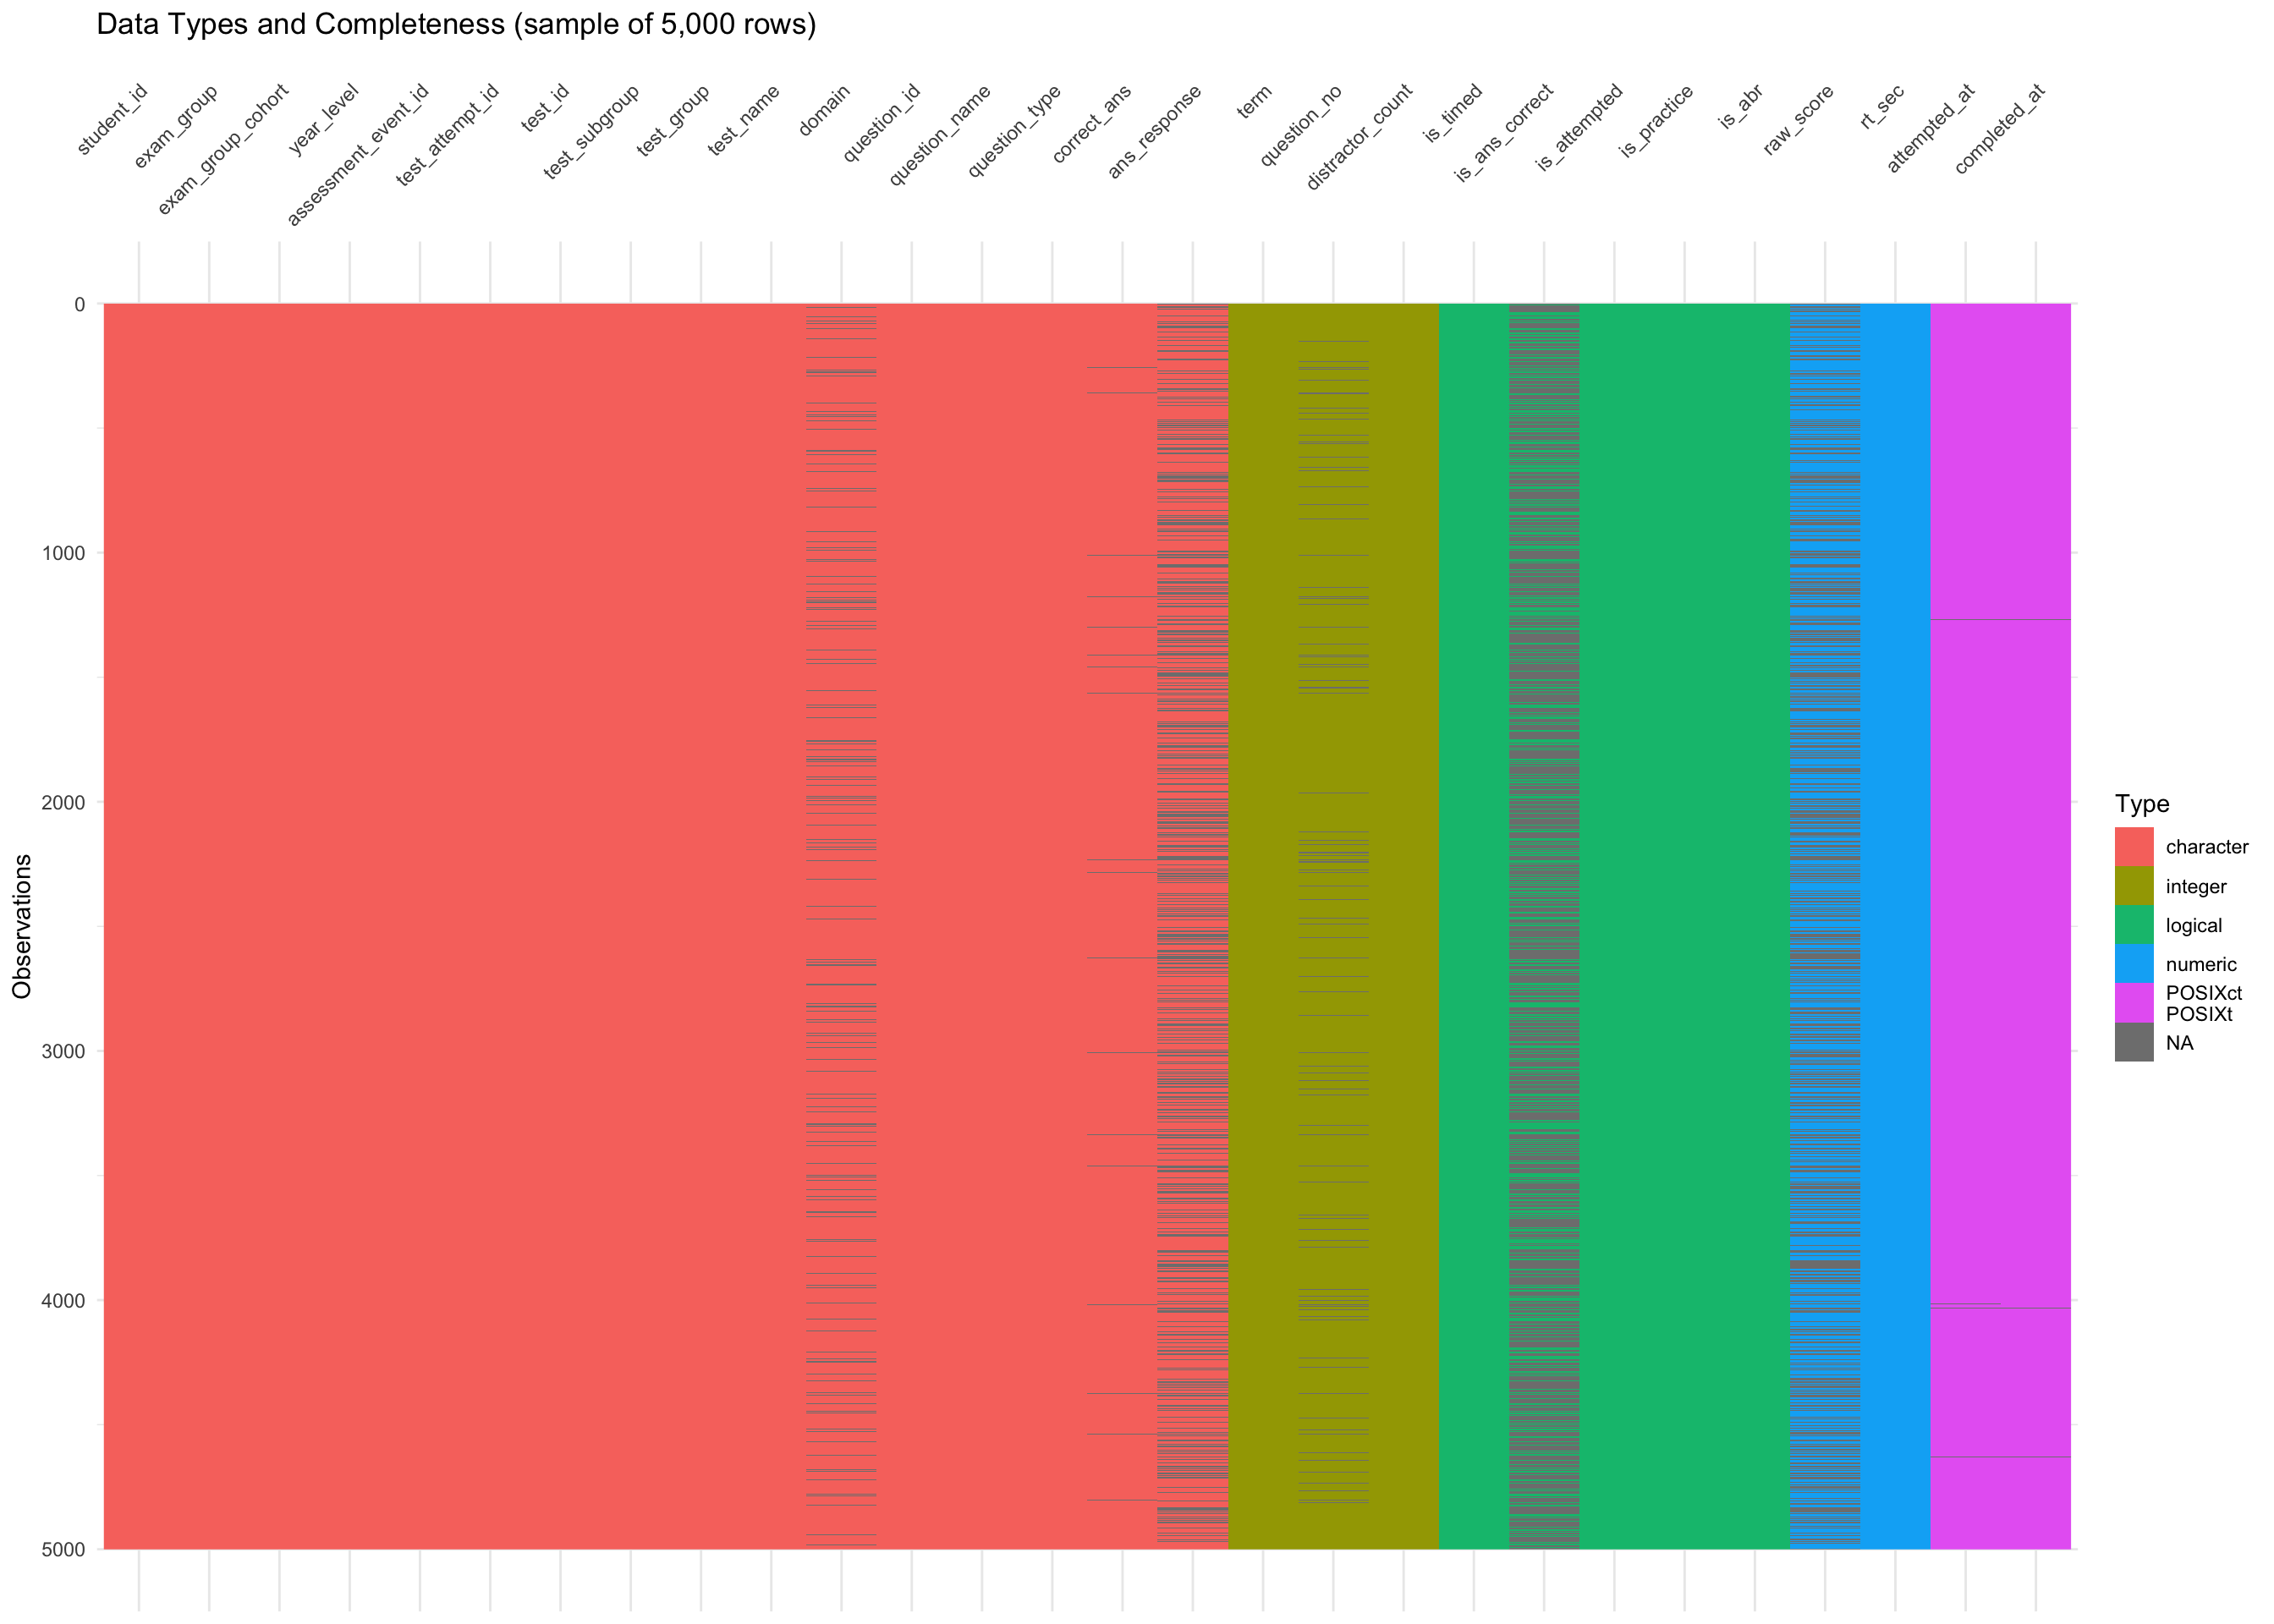
1.2 Data Types Overview
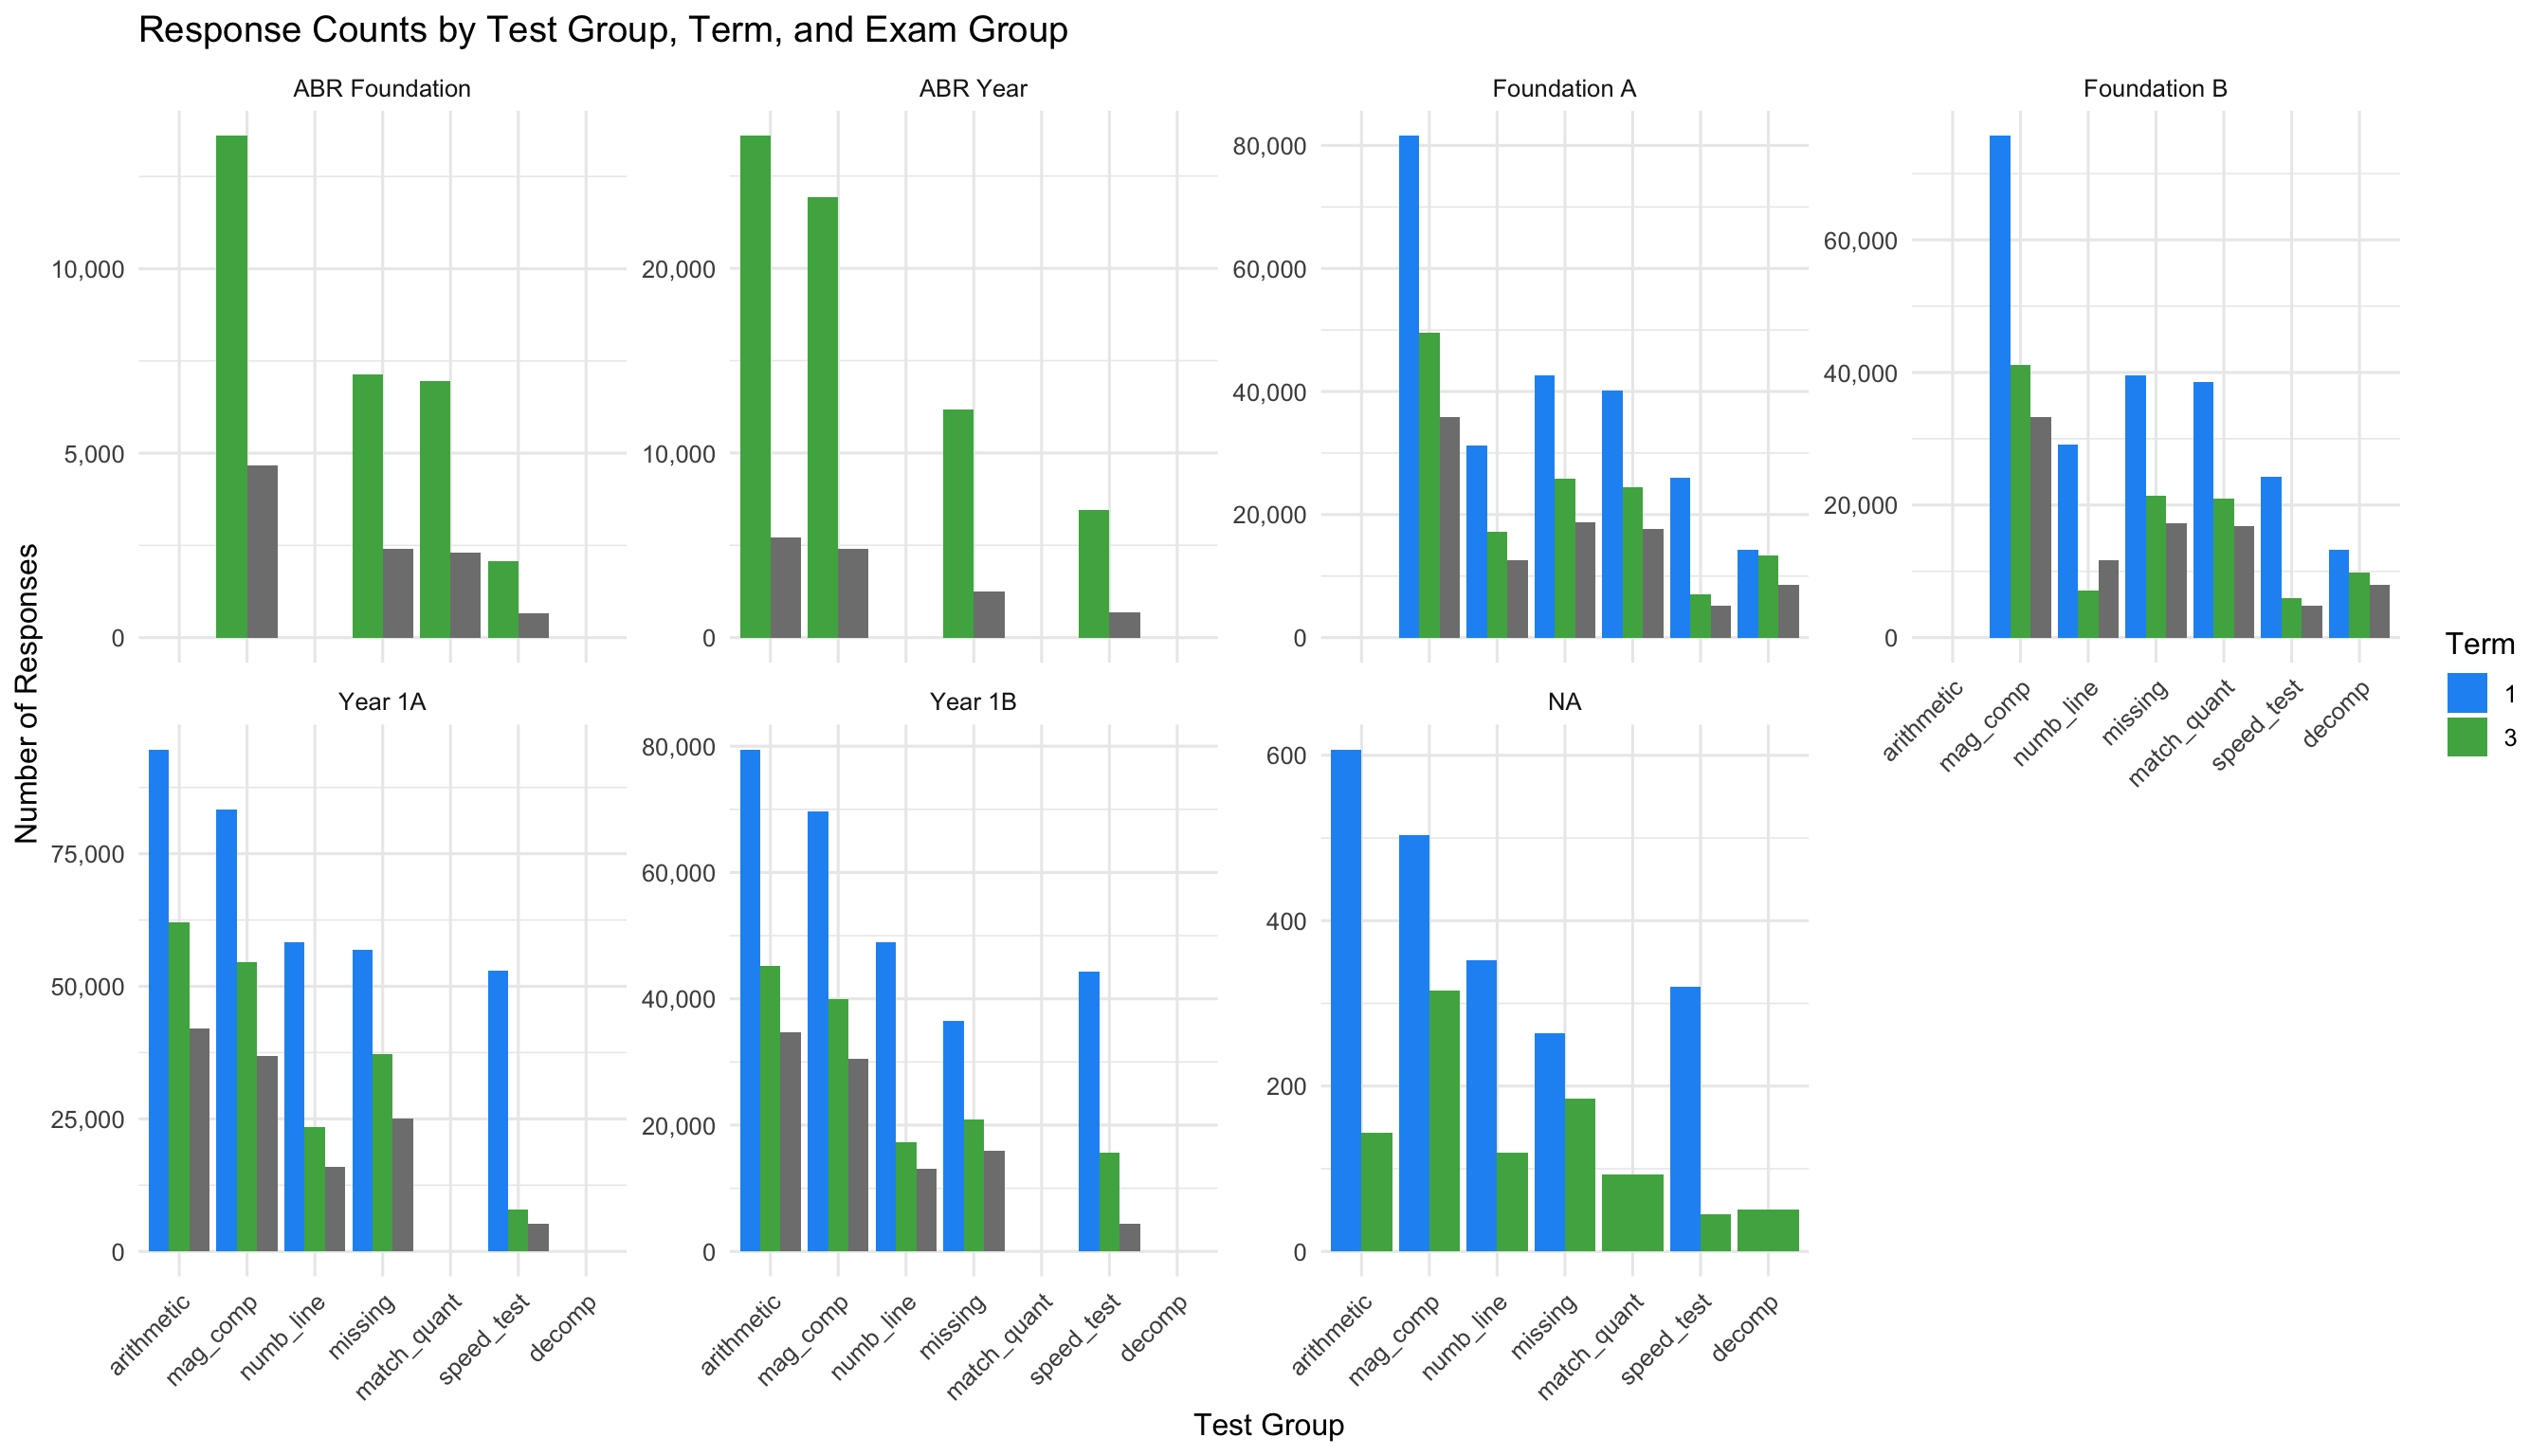
1.3 Response Counts by Grouping
2. Missing Data Analysis
This section investigates patterns of missingness, particularly the ~800k NA values in raw_score related to number-line calibration issues.
2.1 Missing Values by Variable
| Variable | NA Count | % Missing | |
|---|---|---|---|
| is_ans_correct | 1,491,435 | 66.4 | 66.4% |
| raw_score | 901,884 | 40.1 | 40.1% |
| ans_response | 698,523 | 31.1 | 31.1% |
| domain | 219,013 | 9.7 | 9.7% |
| question_no | 140,248 | 6.2 | 6.2% |
| correct_ans | 20,854 | 0.9 | 0.9% |
| attempted_at | 7,615 | 0.3 | 0.3% |
| completed_at | 6,049 | 0.3 | 0.3% |
| rt_sec | 1,769 | 0.1 | 0.1% |
| test_attempt_id | 1,416 | 0.1 | 0.1% |
| exam_group | 31 | 0.0 | 0.0% |
| exam_group_cohort | 31 | 0.0 | 0.0% |
| year_level | 31 | 0.0 | 0.0% |
| assessment_event_id | 31 | 0.0 | 0.0% |
2.2 Missingness Patterns
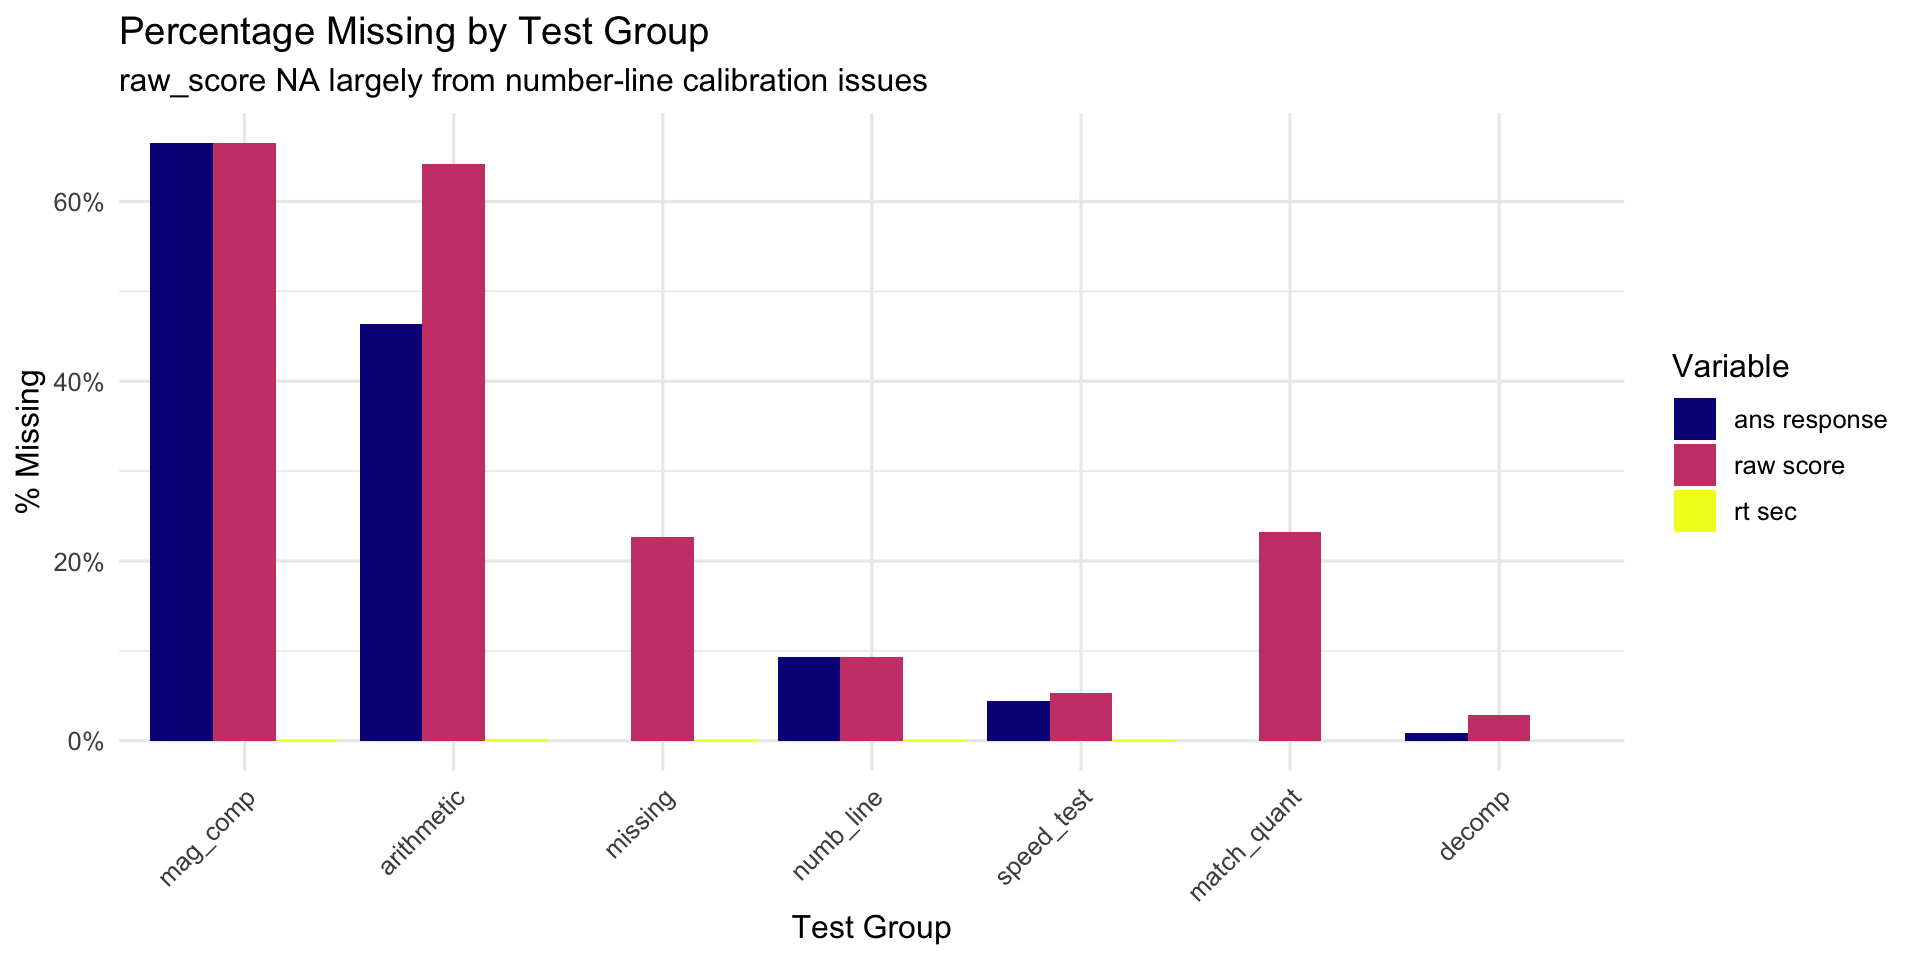
NULL2.3 Missingness by Test Group
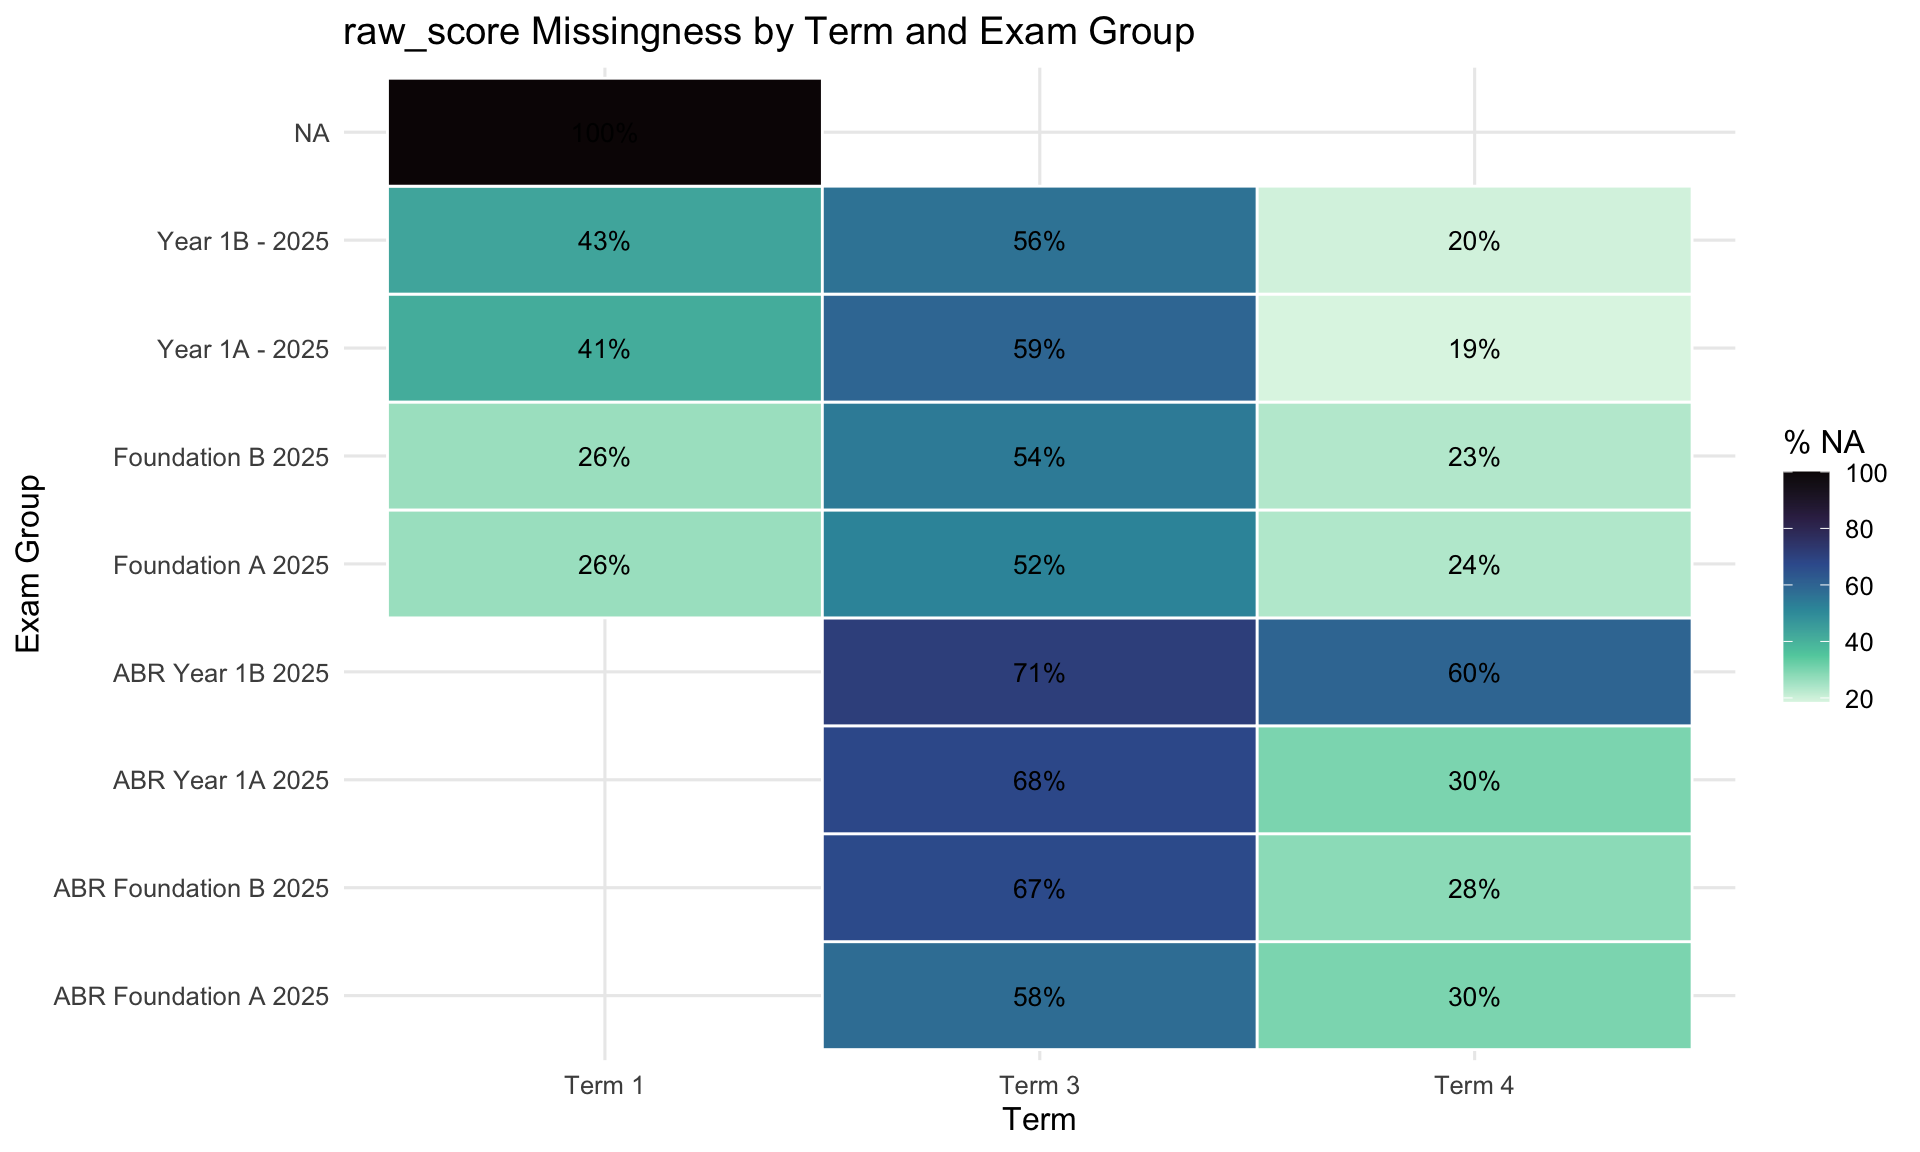
2.4 Missingness by Term and Exam Group
3. Univariate Distributions
Exploring the marginal distributions of key outcome variables across test groups and terms.
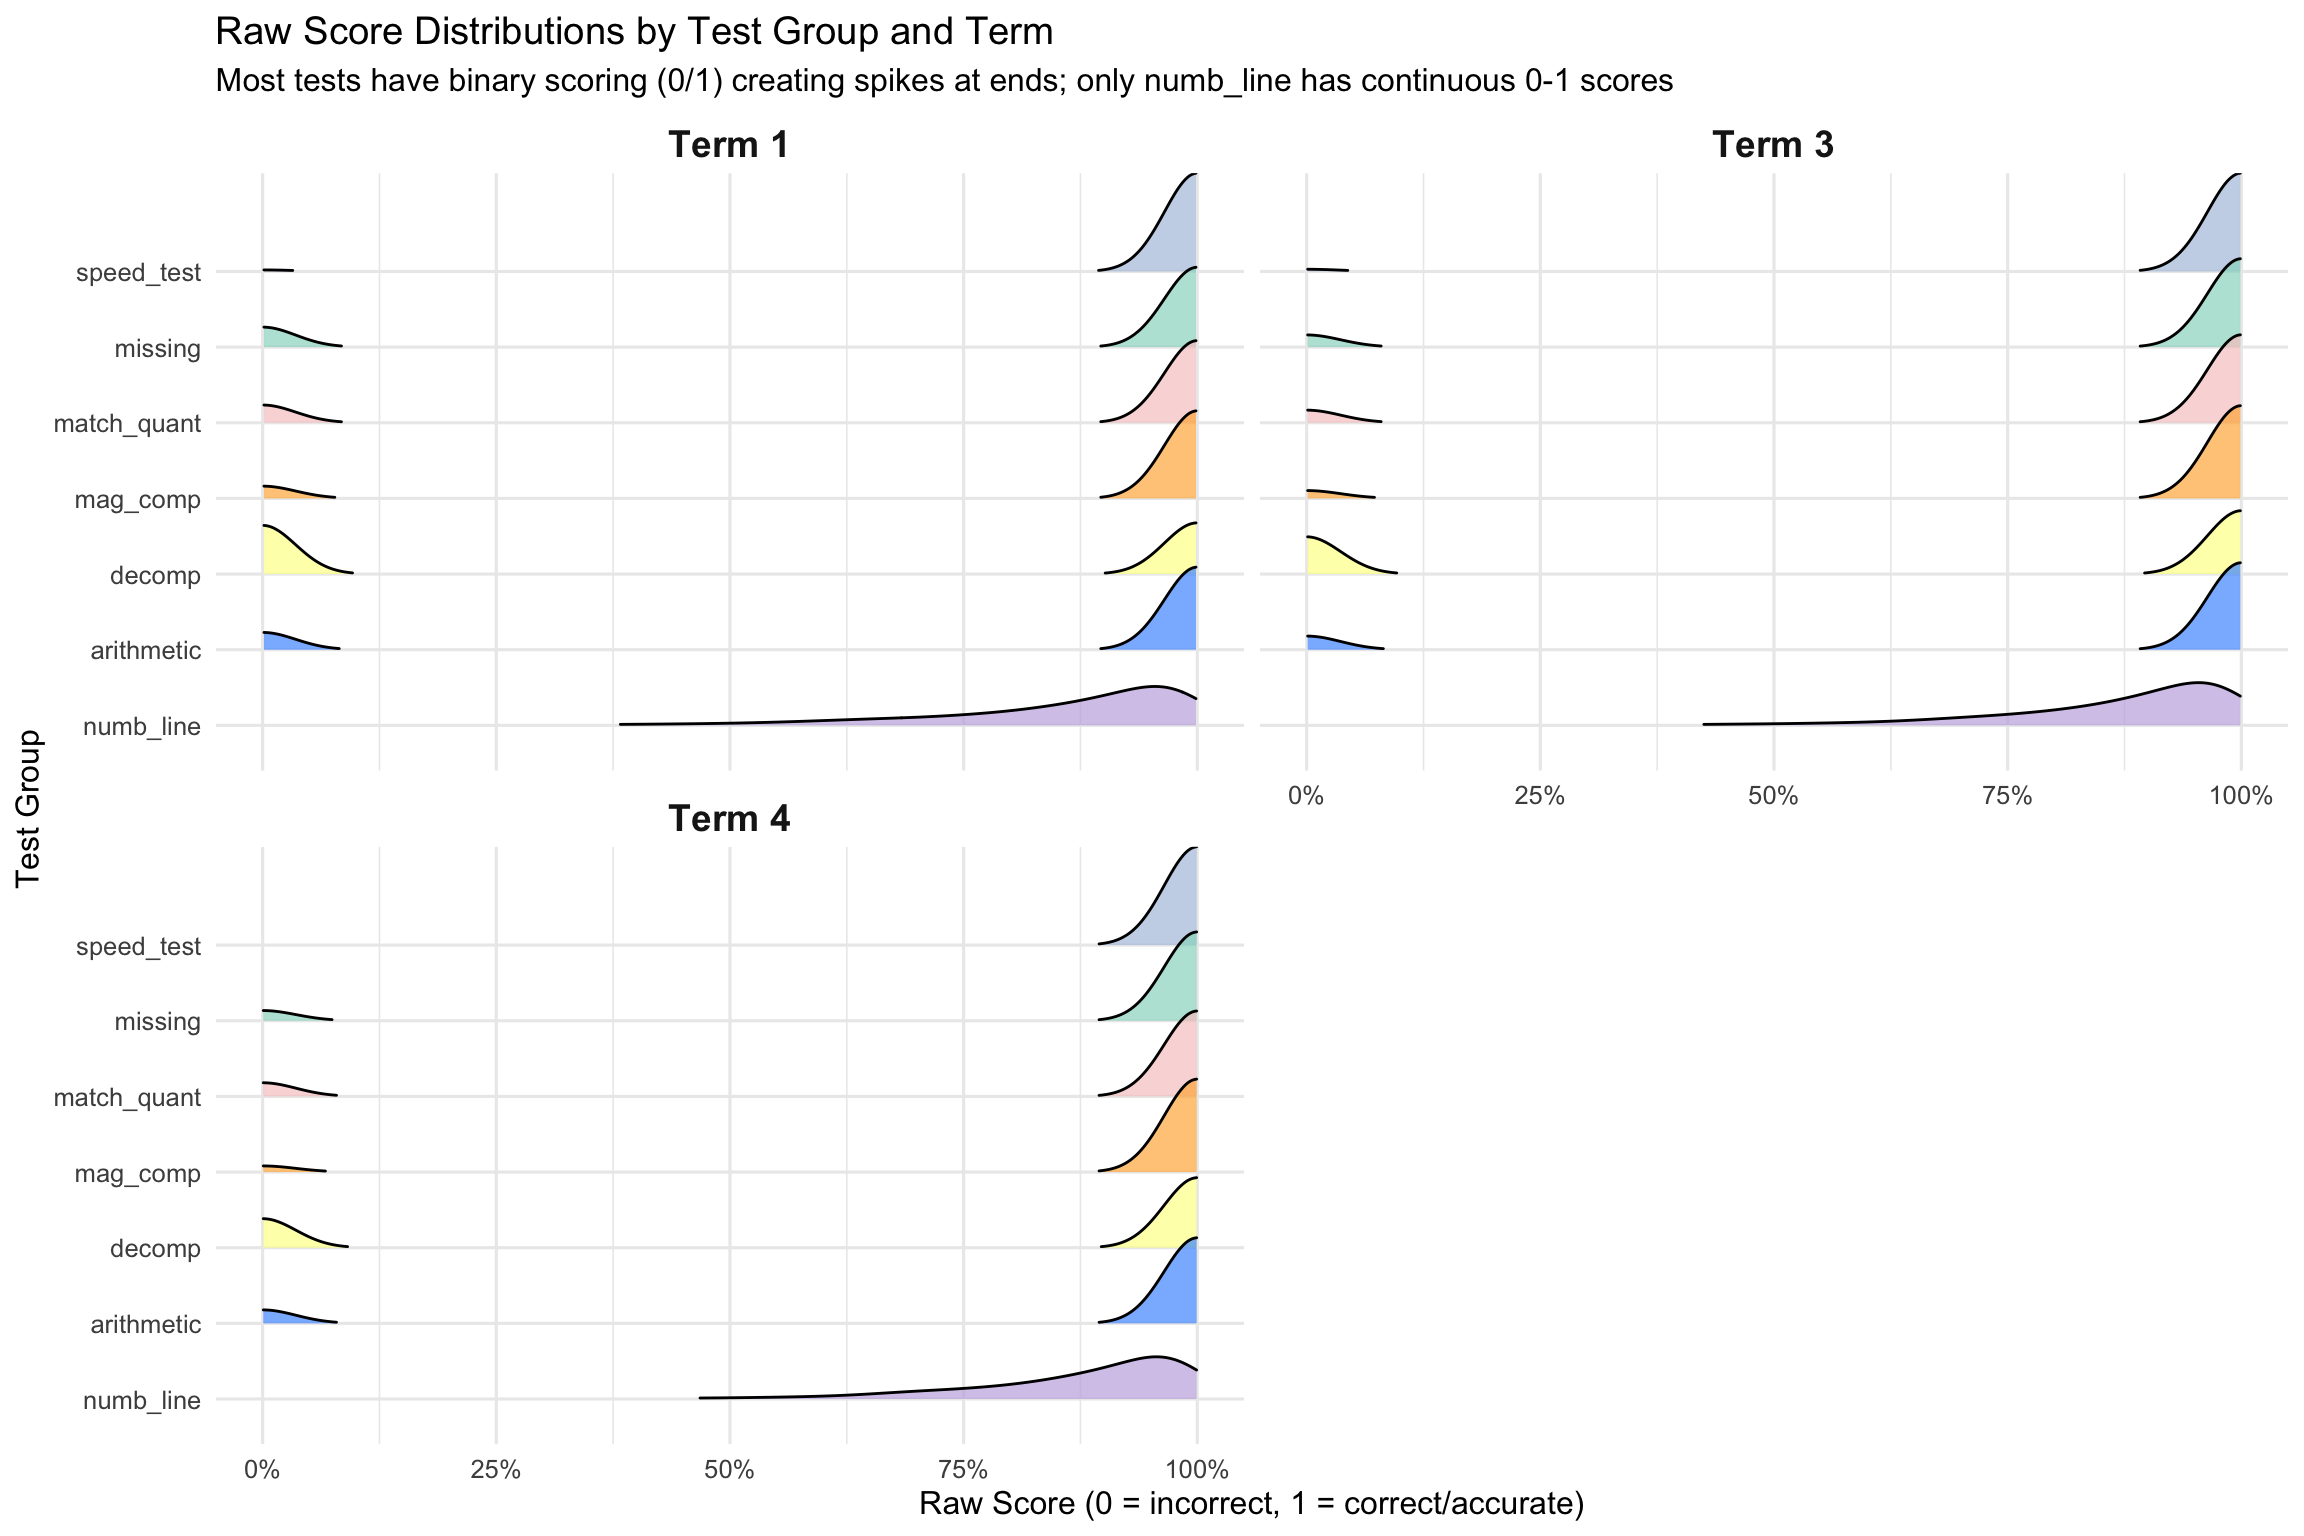
3.1 Raw Score Distribution
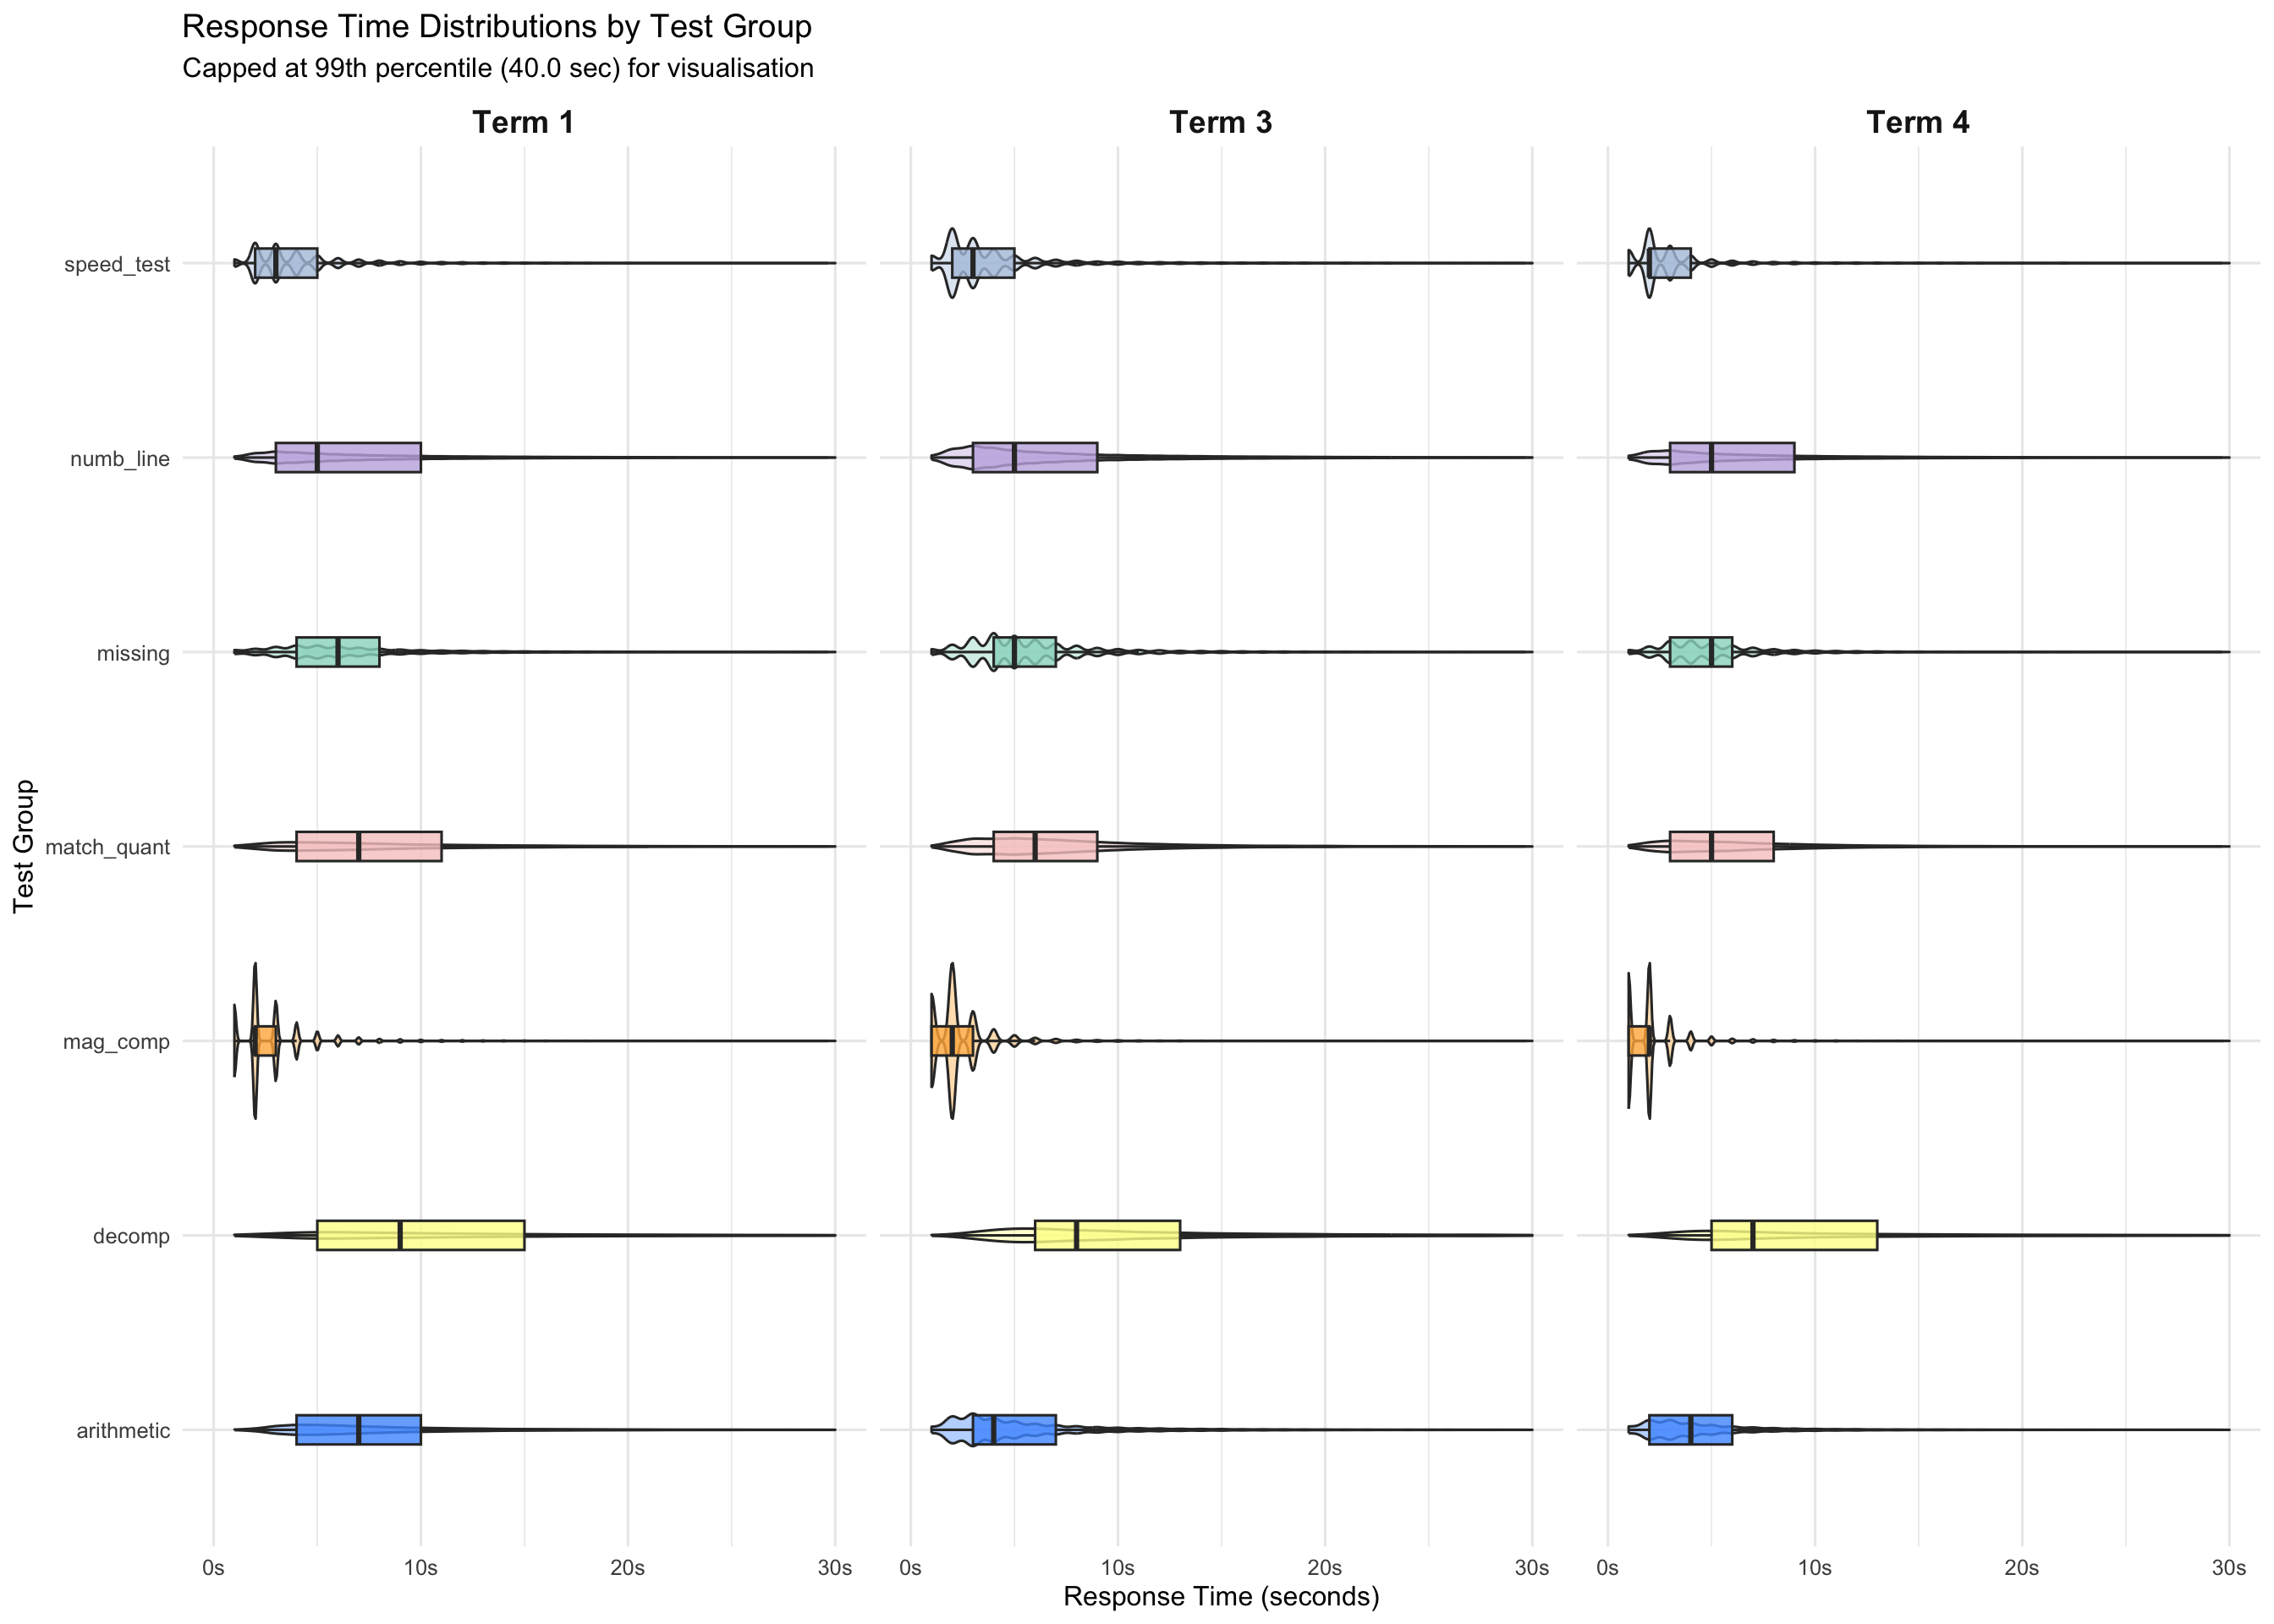
3.2 Response Time Distribution
3.3 Fluency Score Distribution (Timed Tests Only)
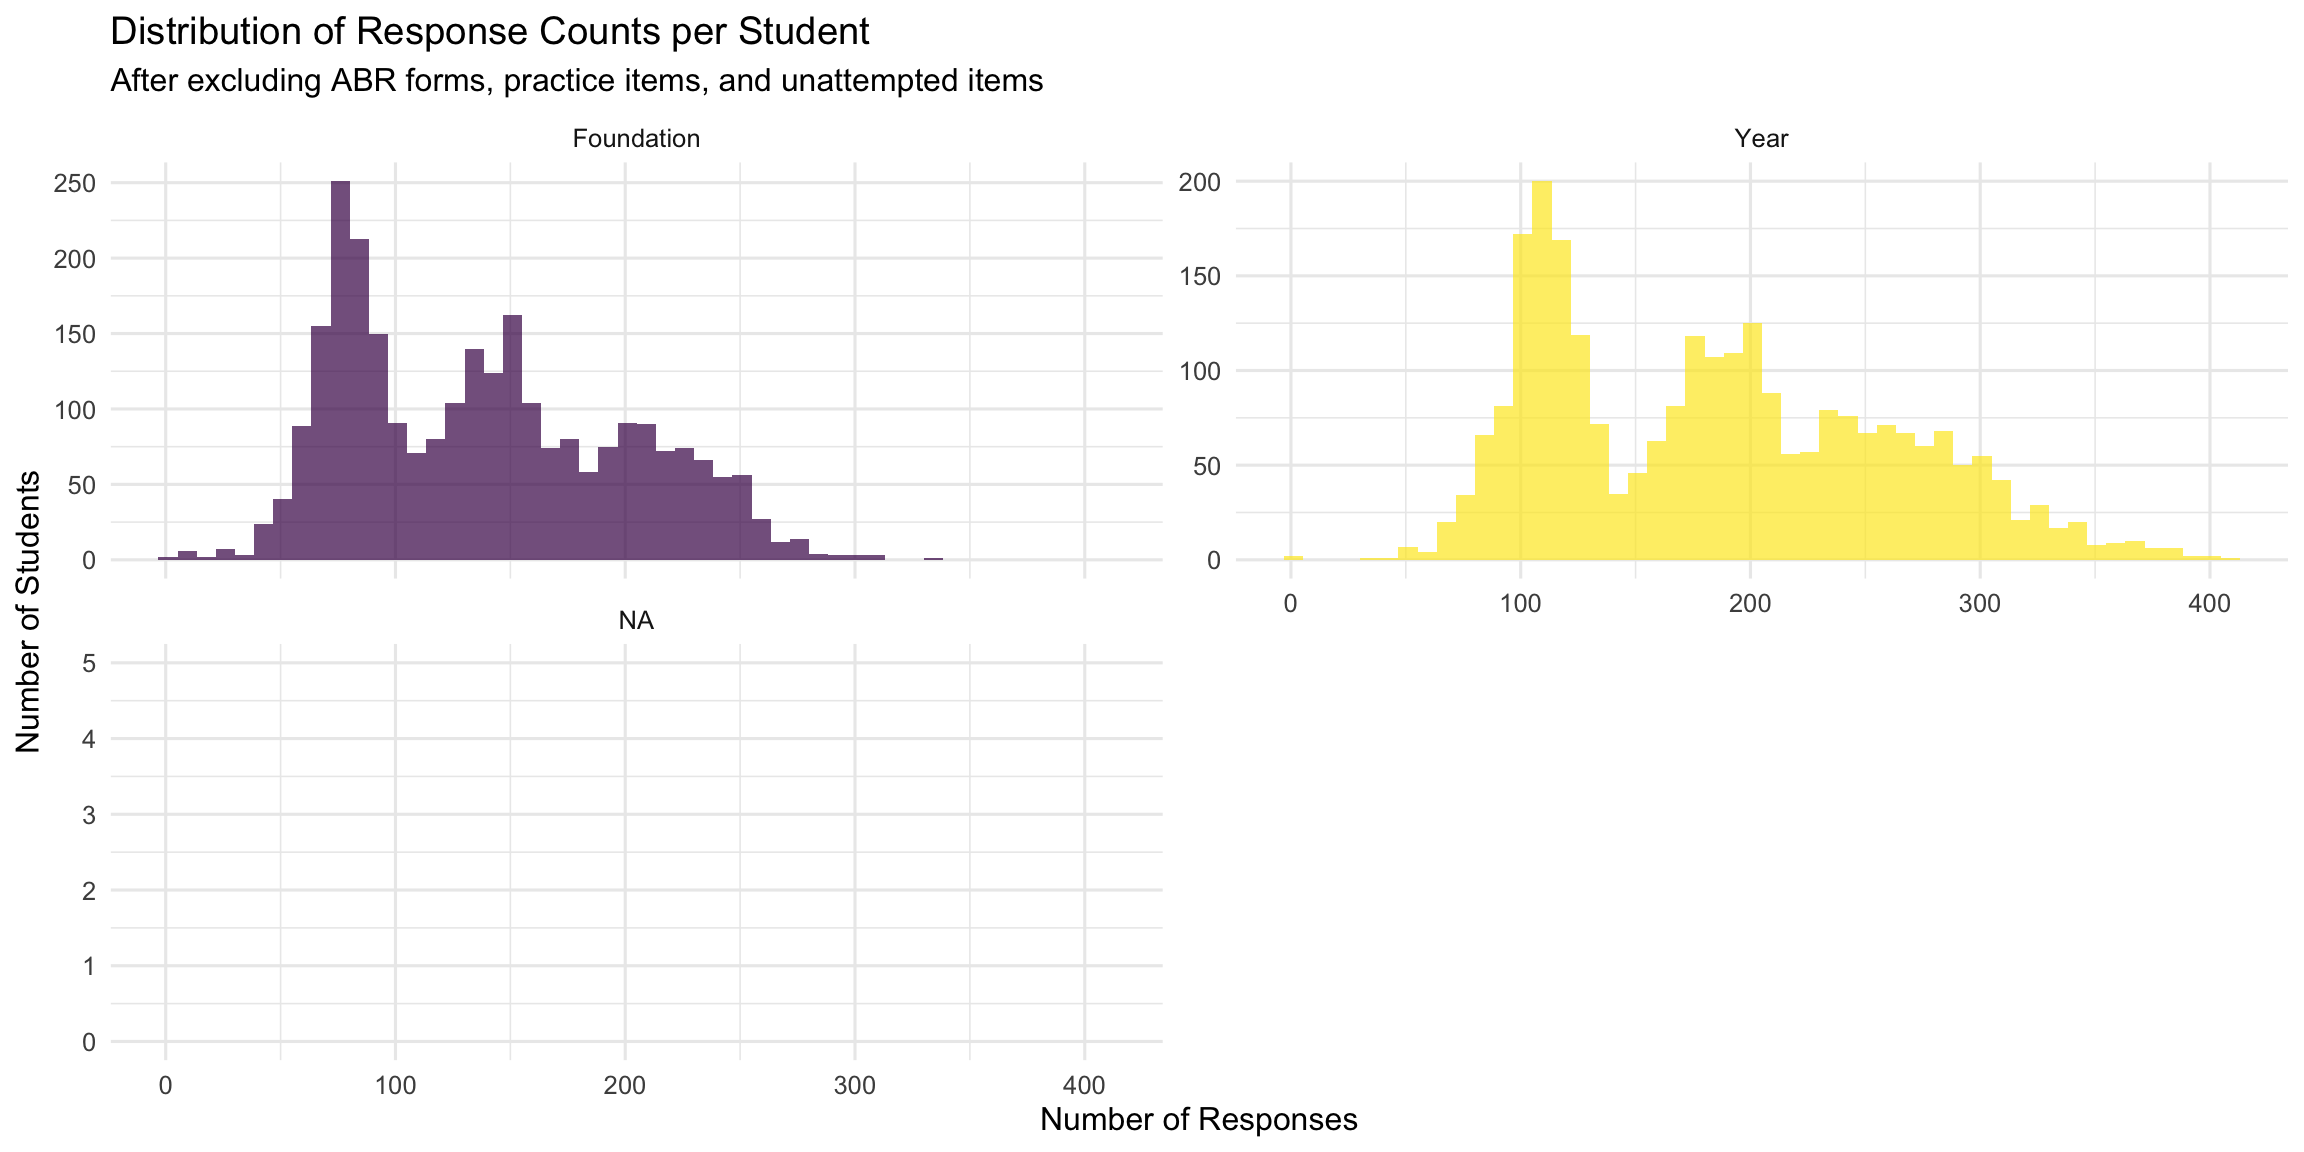
fluency_mm column not found in dataset3.4 Responses per Student Distribution
4. Bivariate Relationships
Exploring pairwise relationships among key metrics to identify patterns and potential confounds.
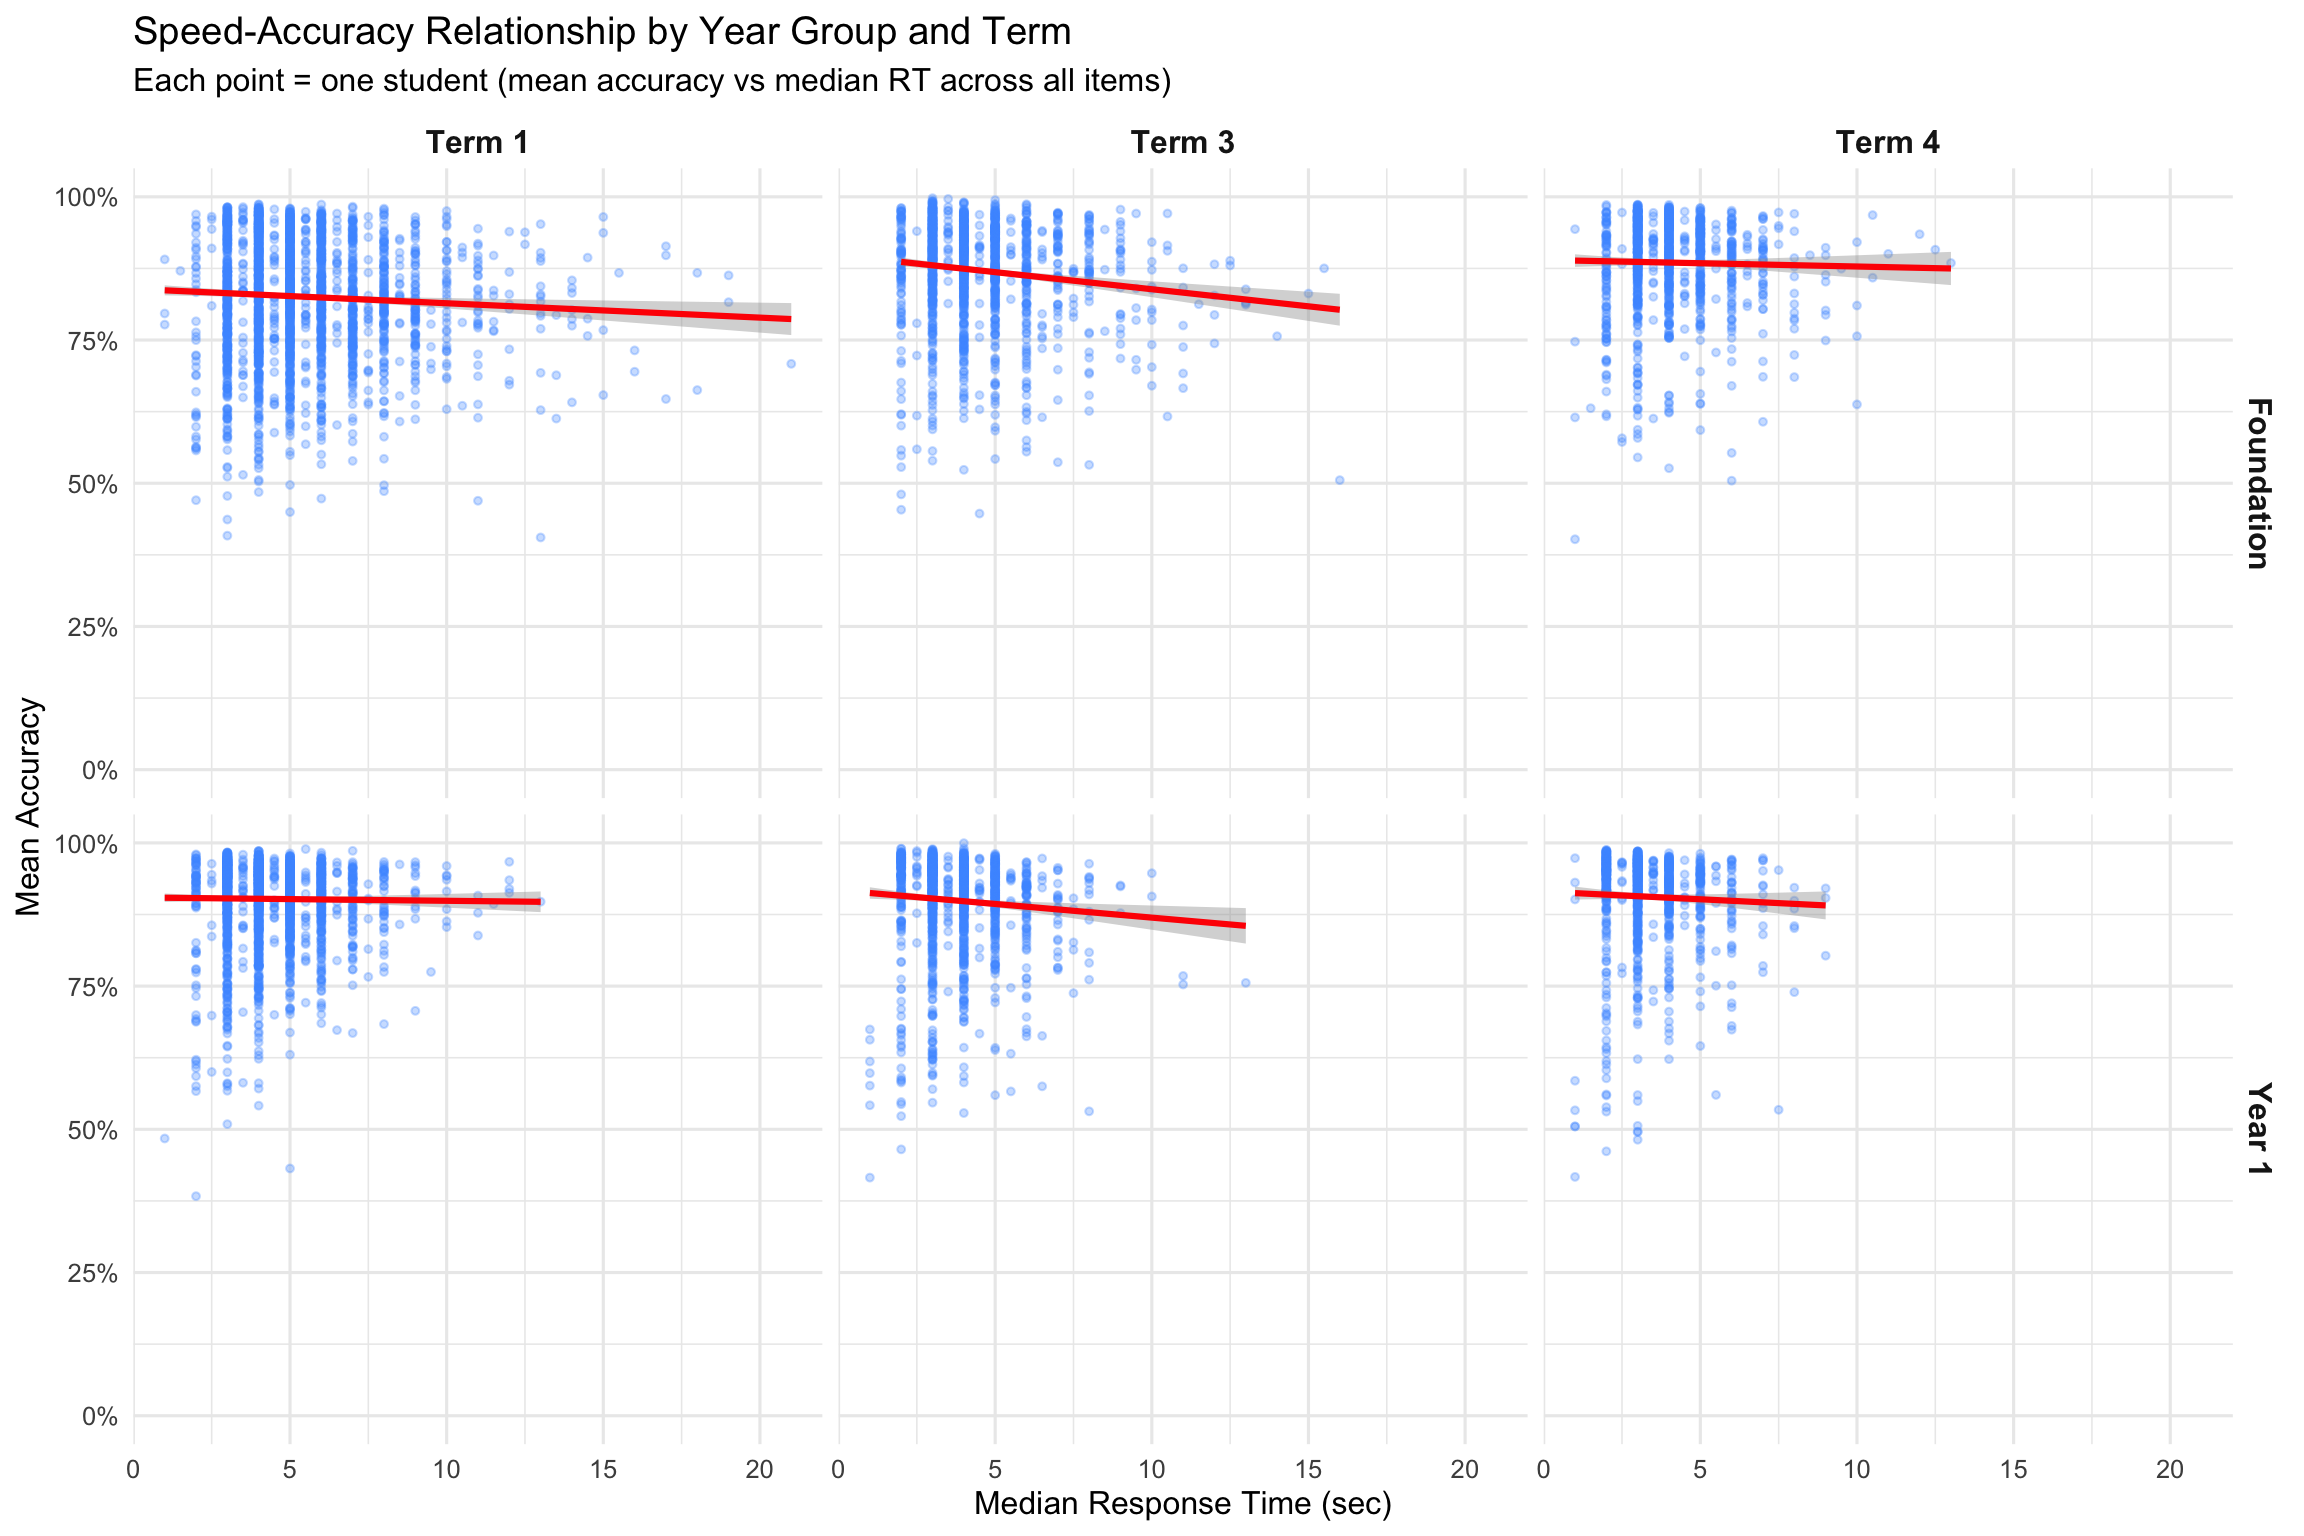
4.1 Speed-Accuracy Trade-off
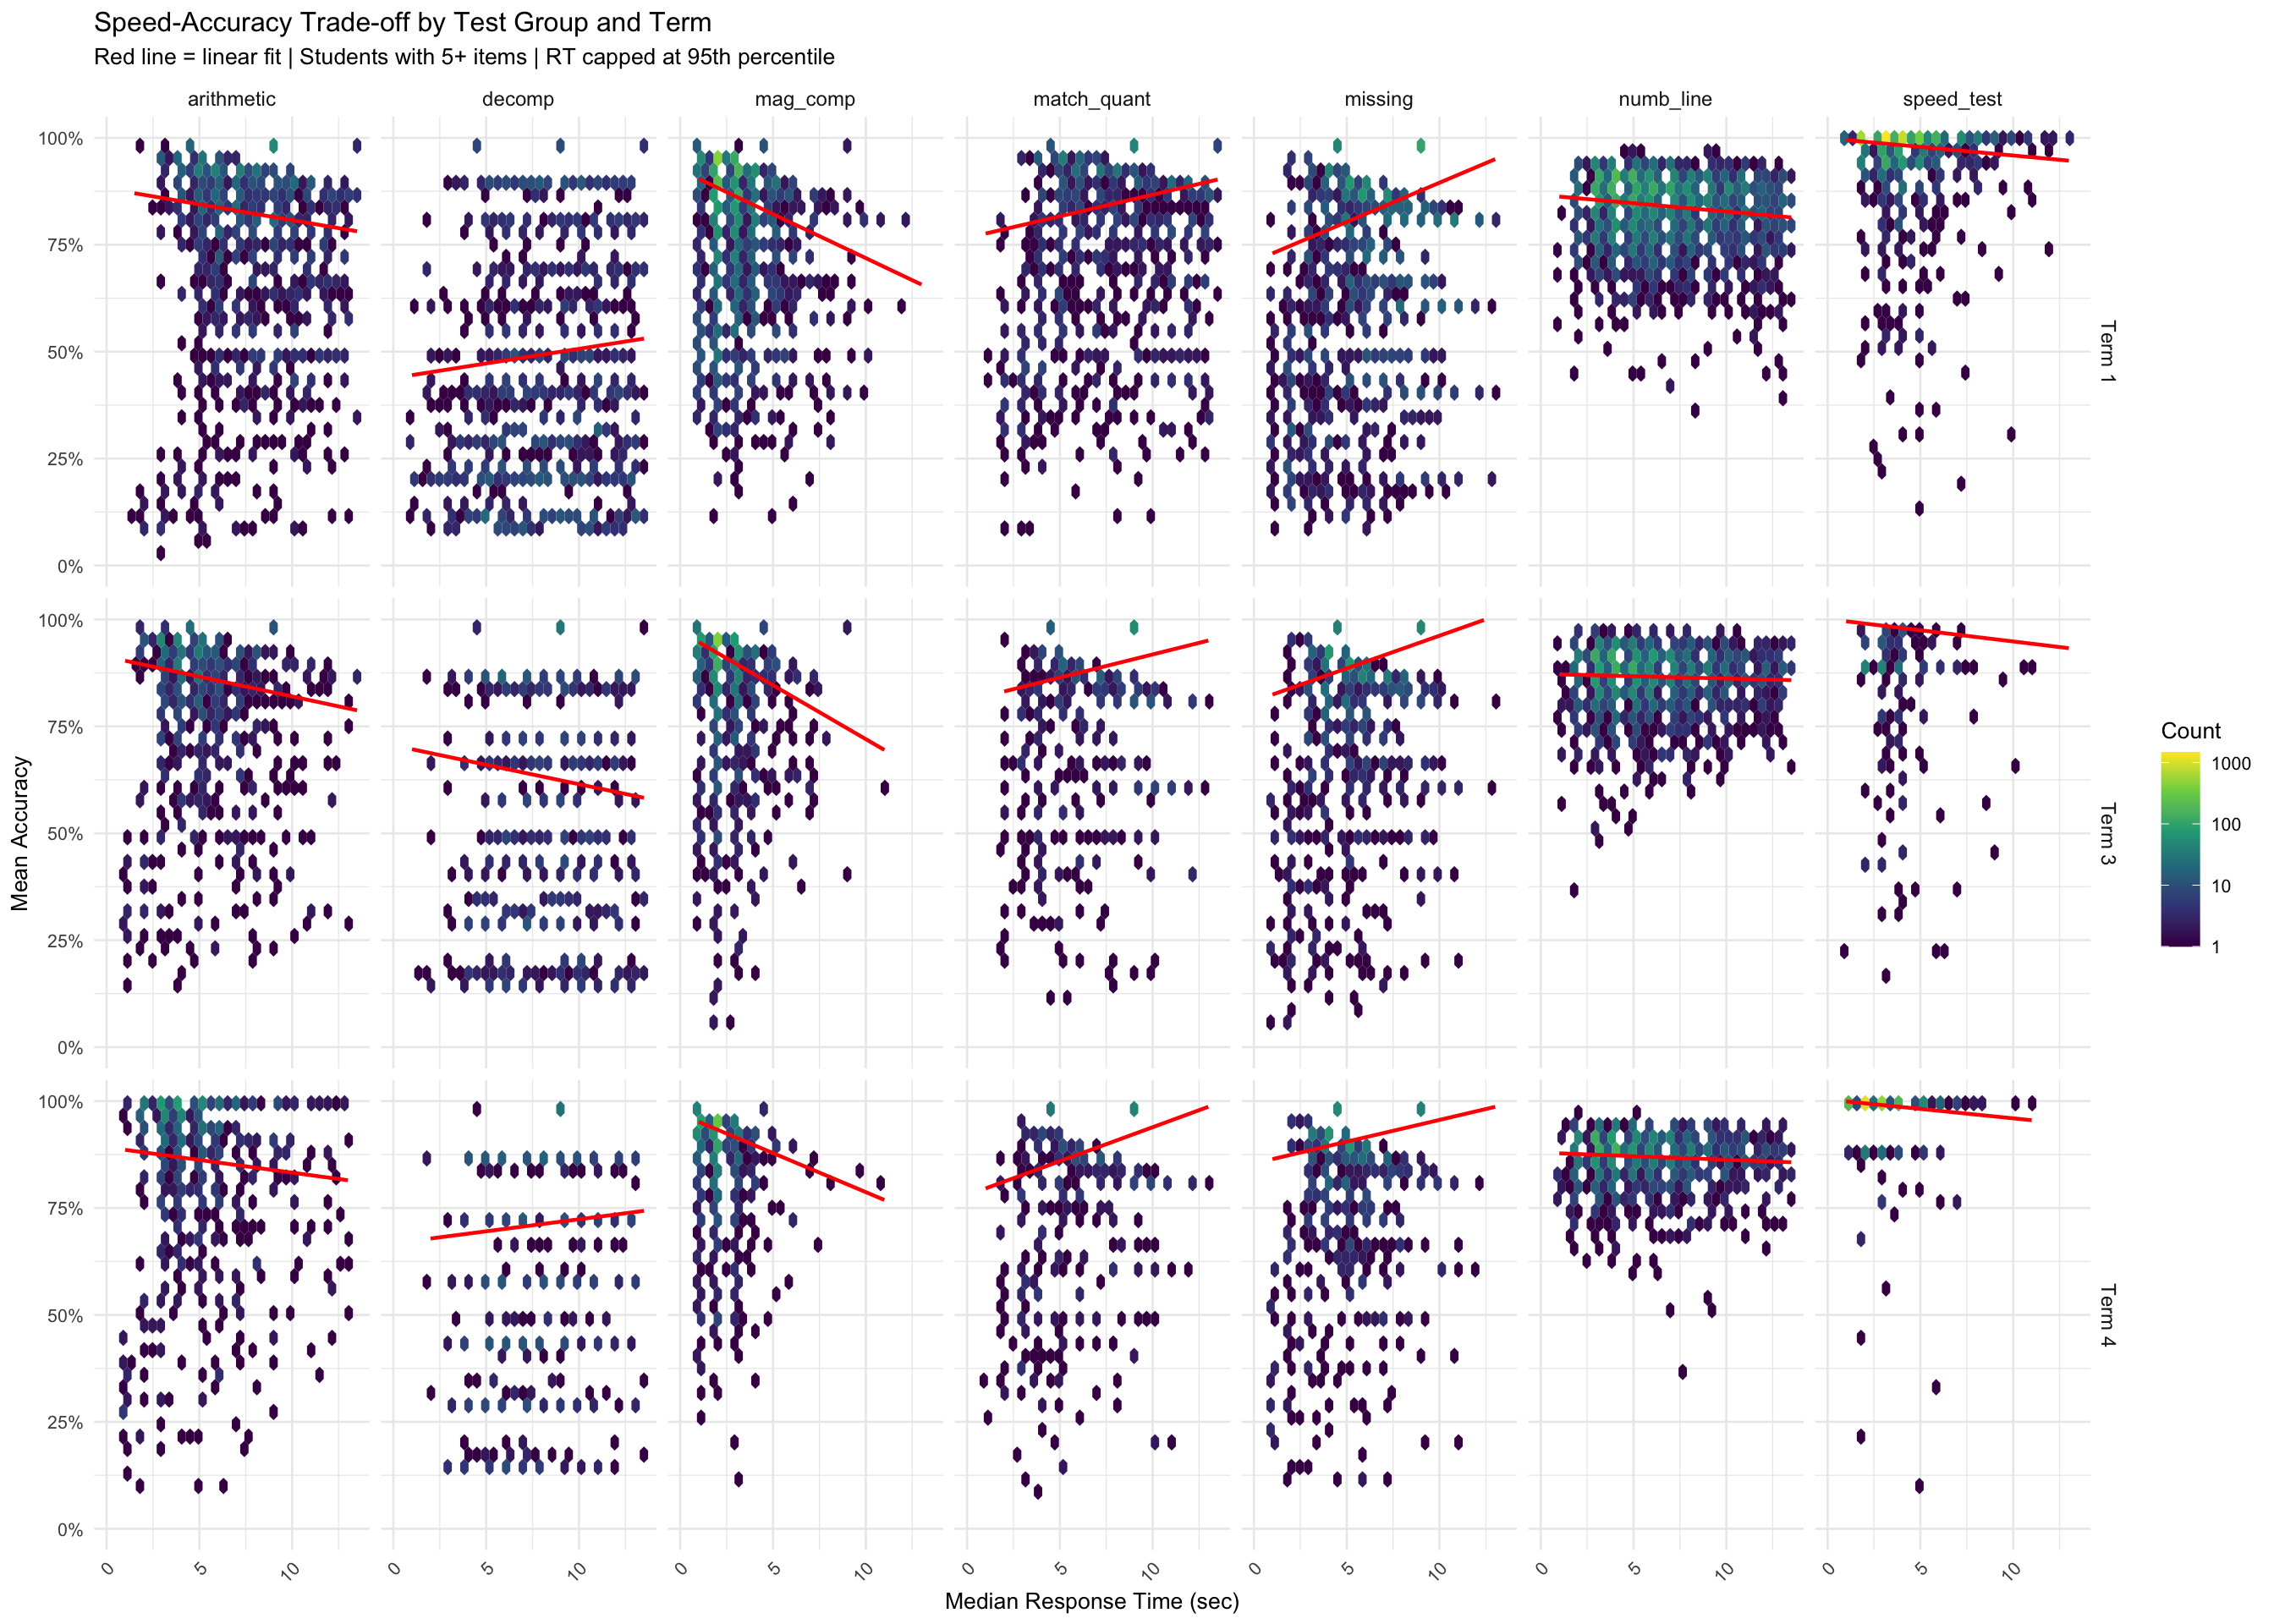
4.2 Speed-Accuracy Relationship
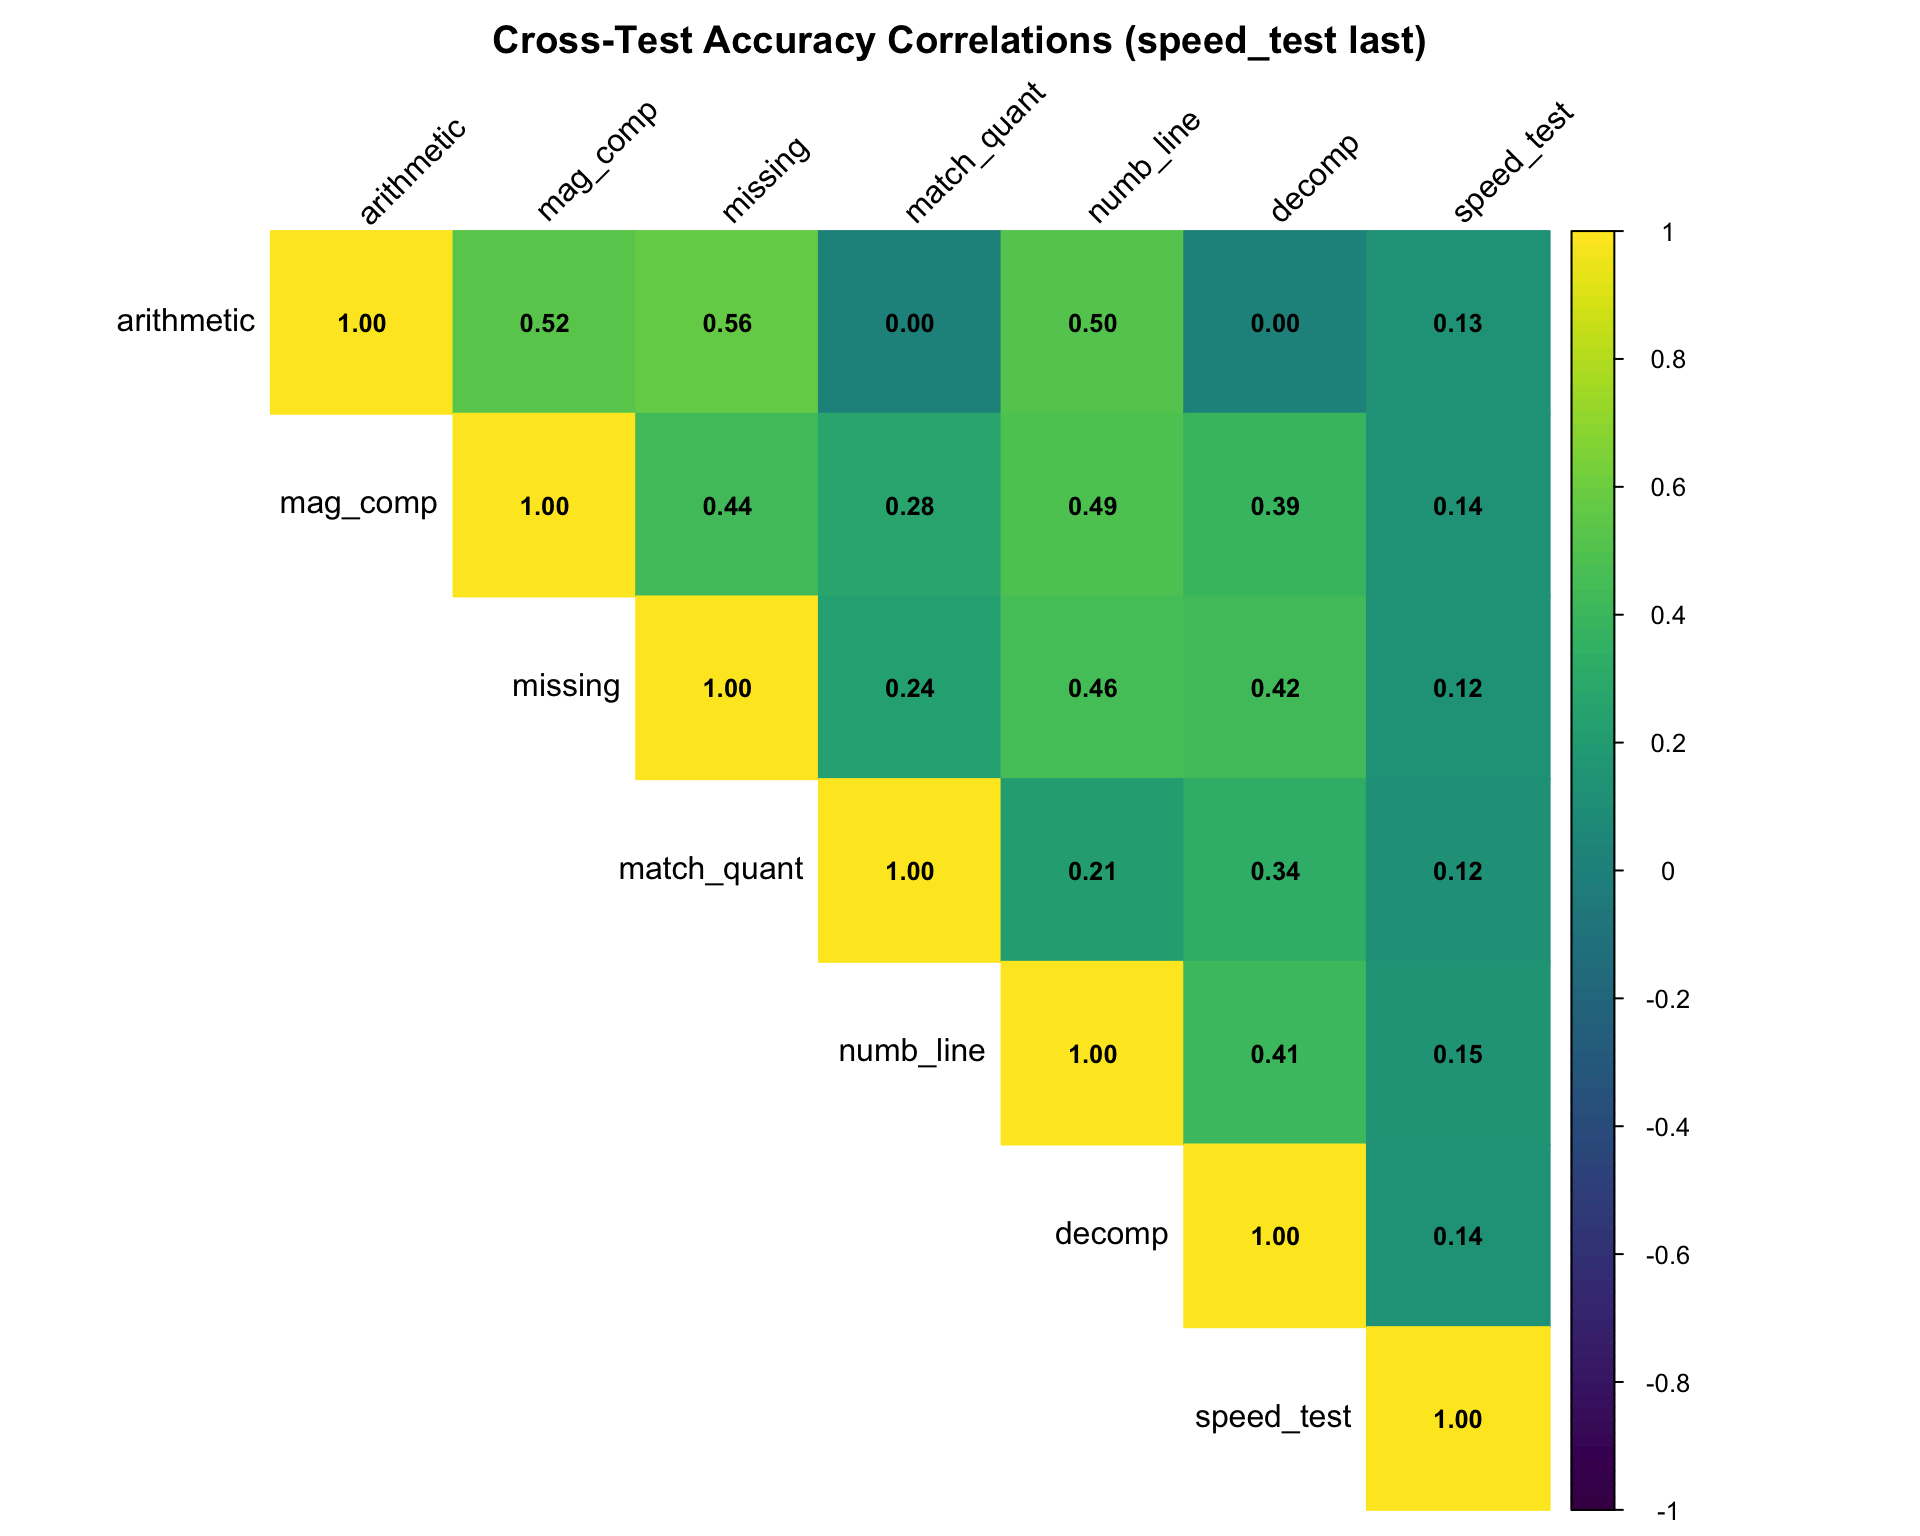
4.3 Cross-Metric Correlation Heatmap
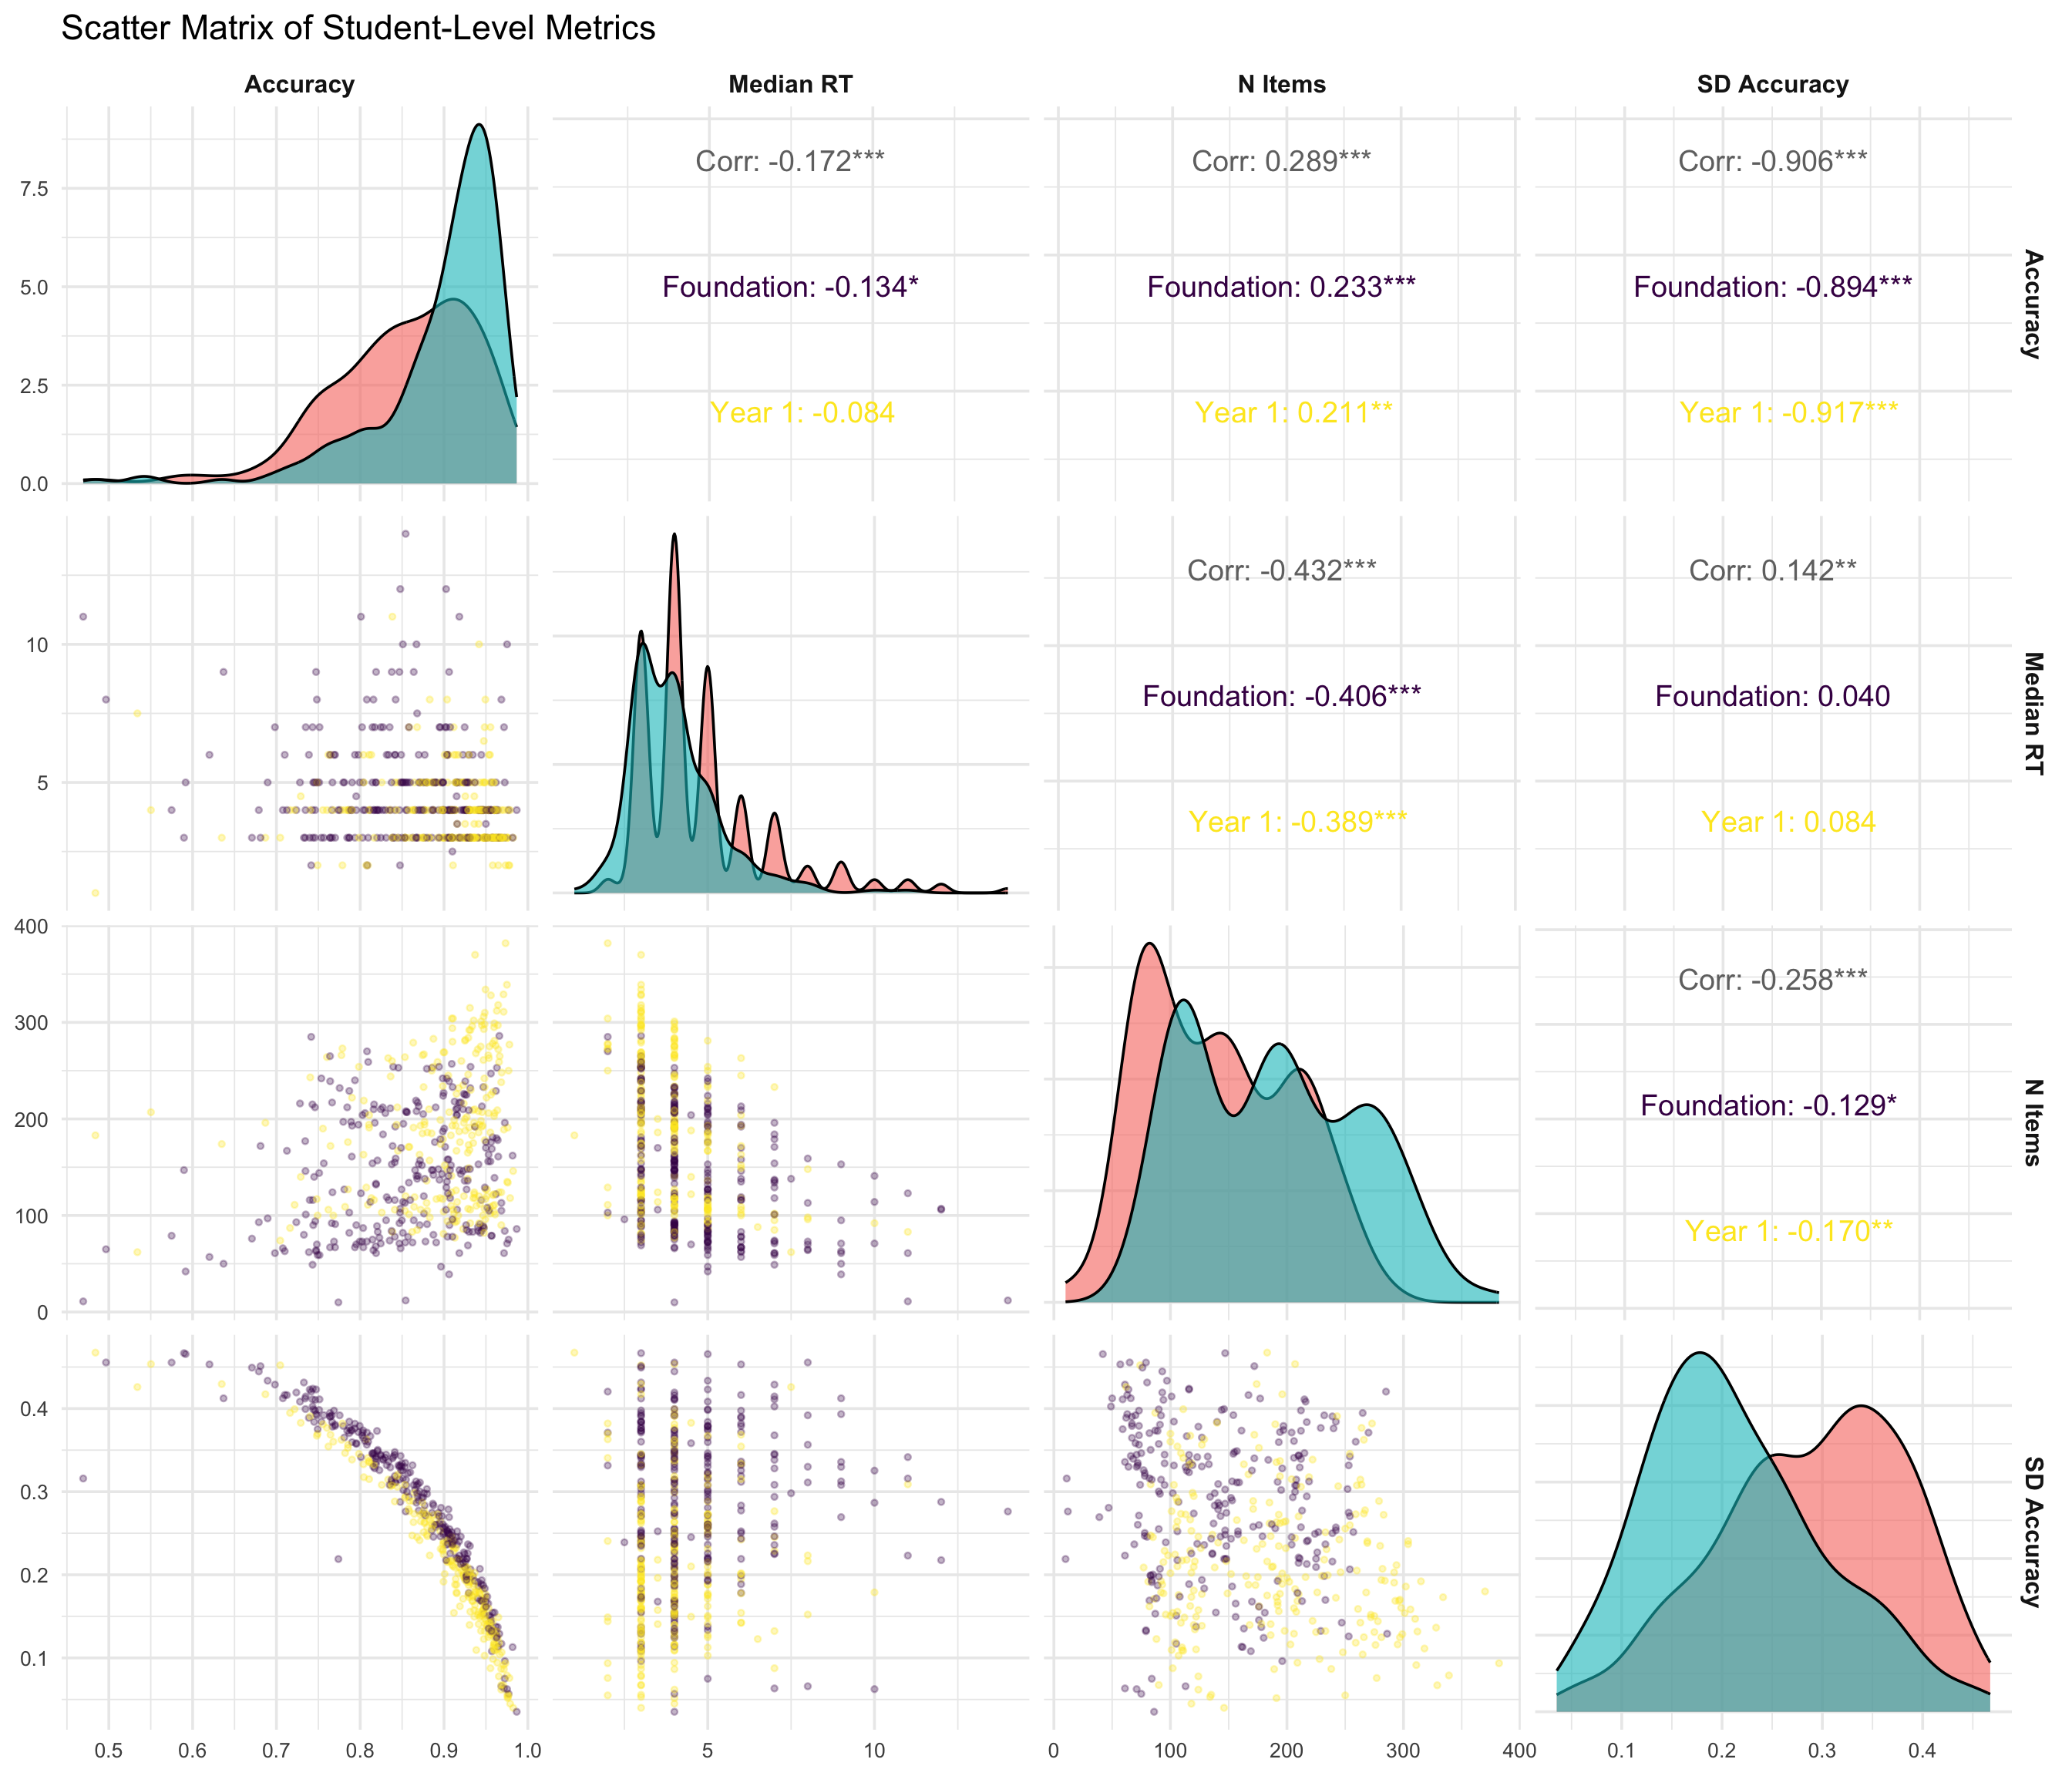
4.4 Scatter Matrix
5. Term 1 to Term 3 Growth Analysis
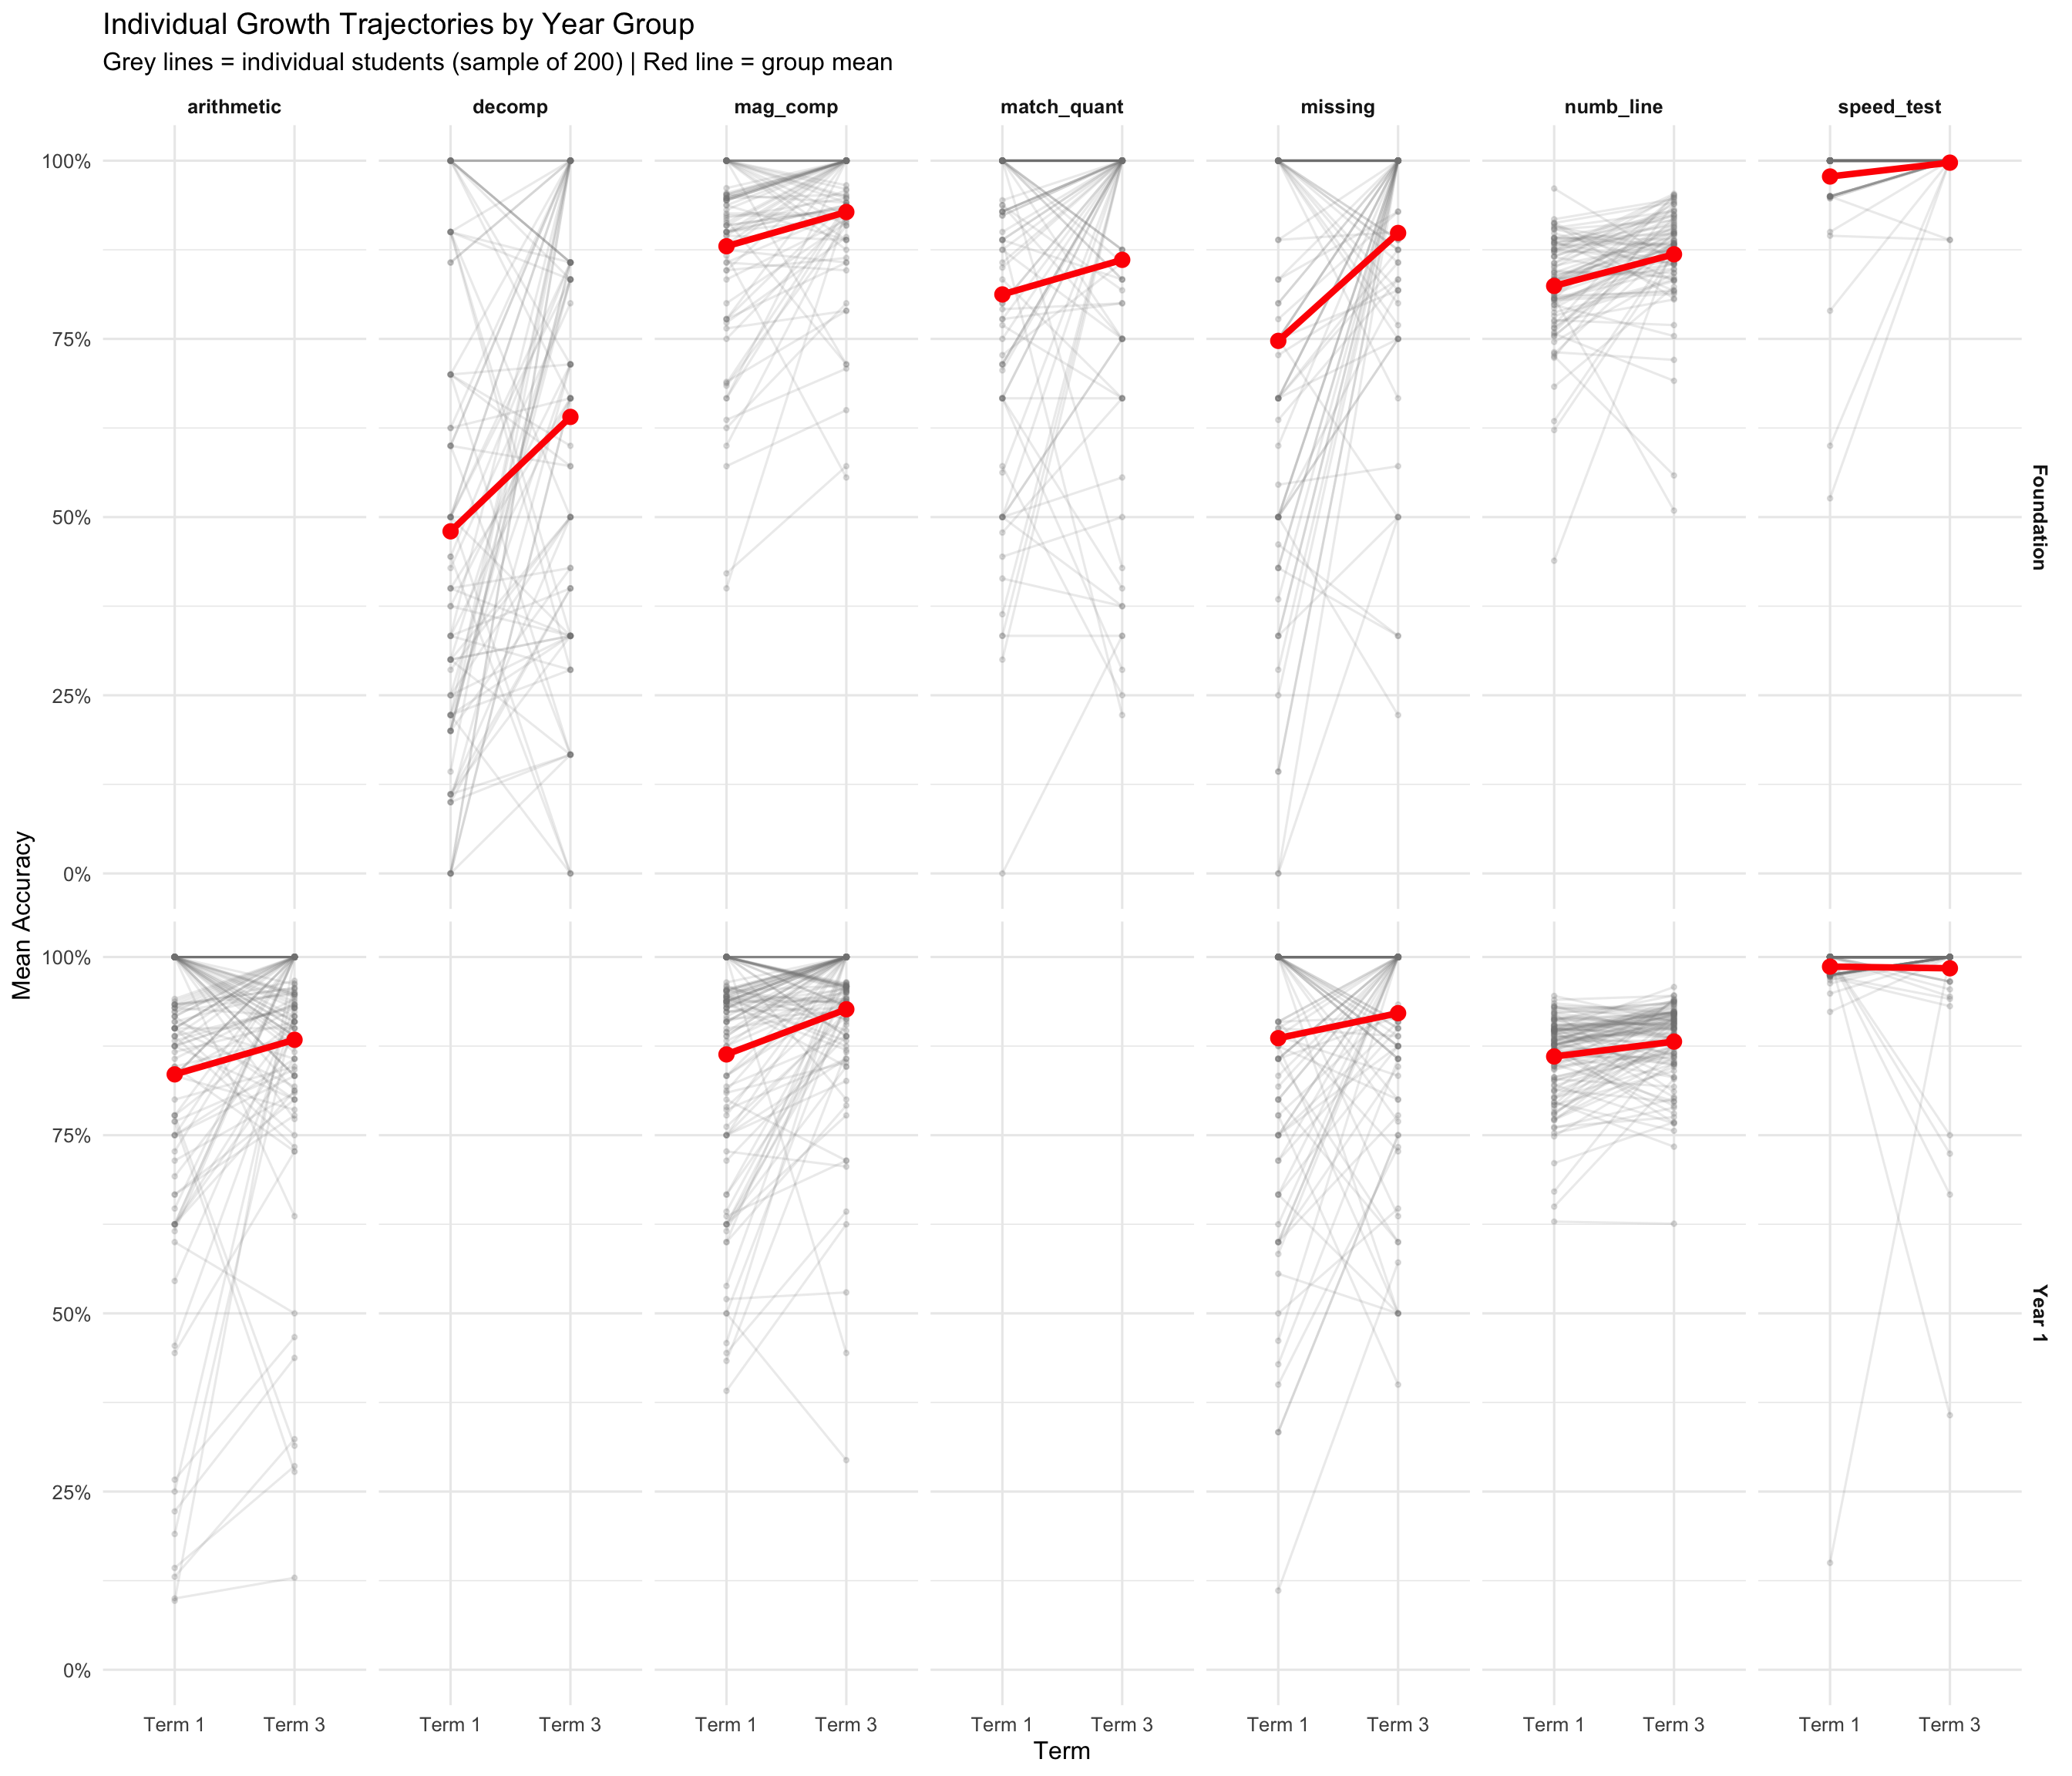
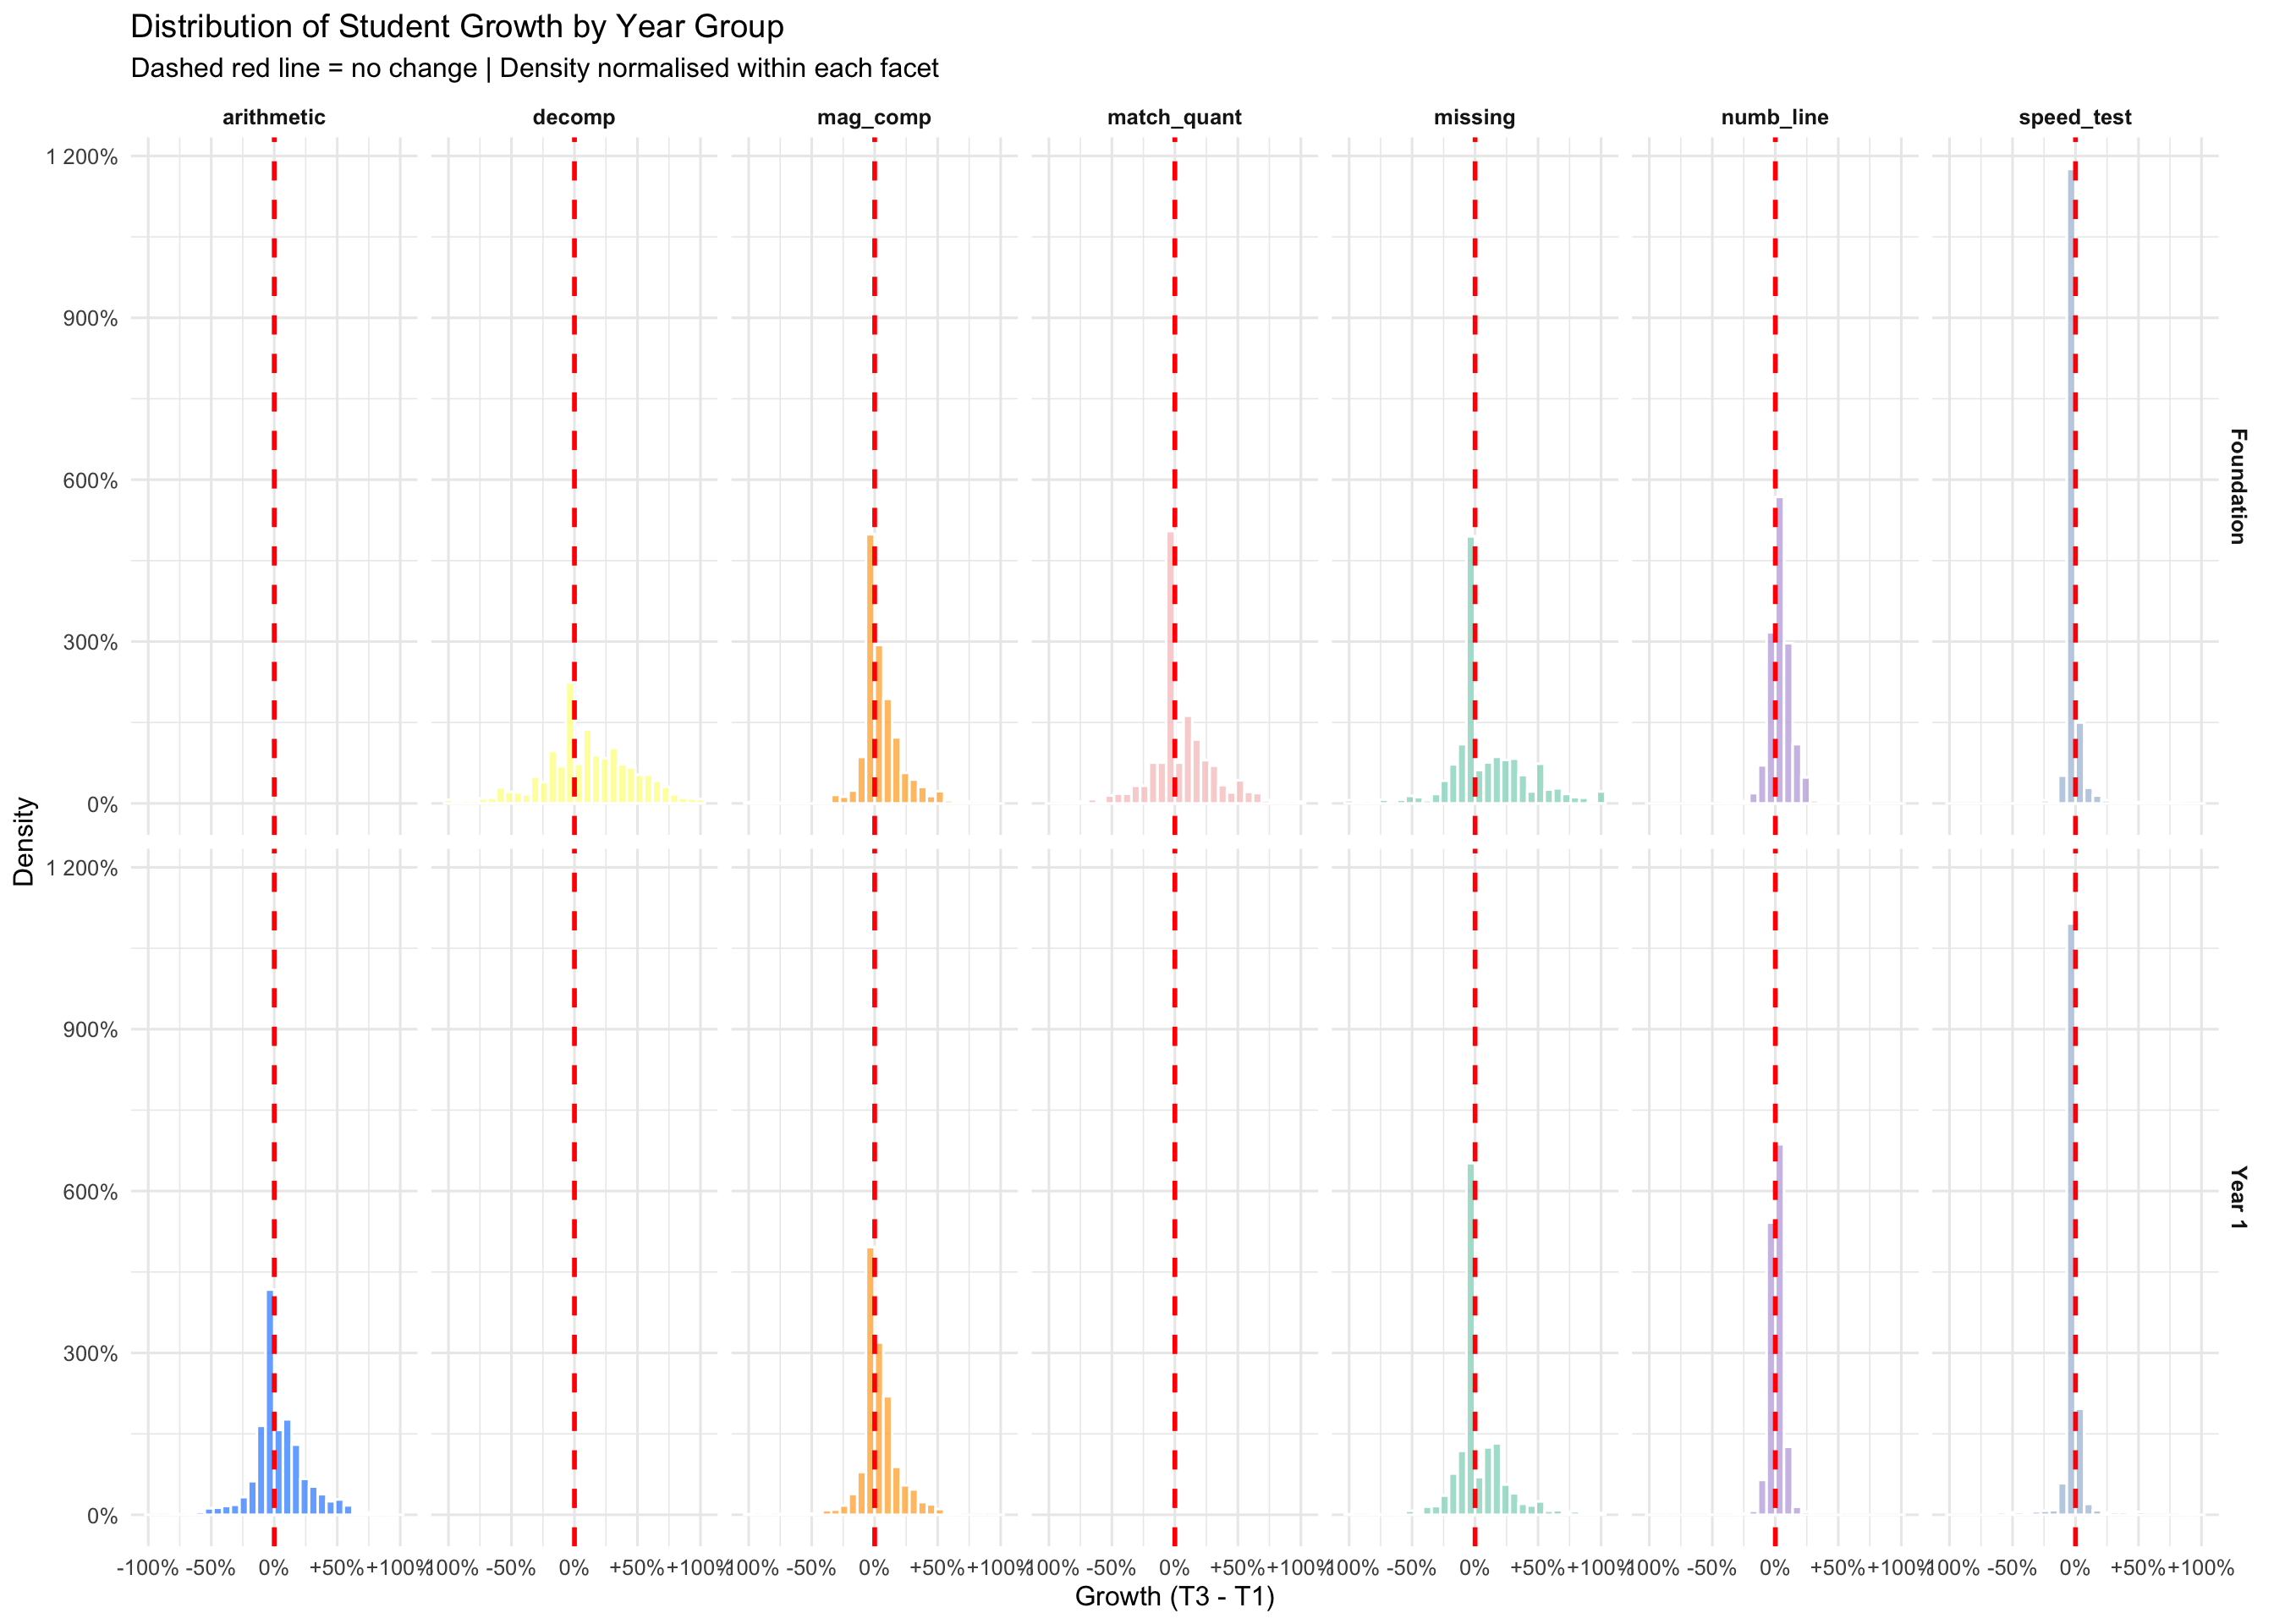
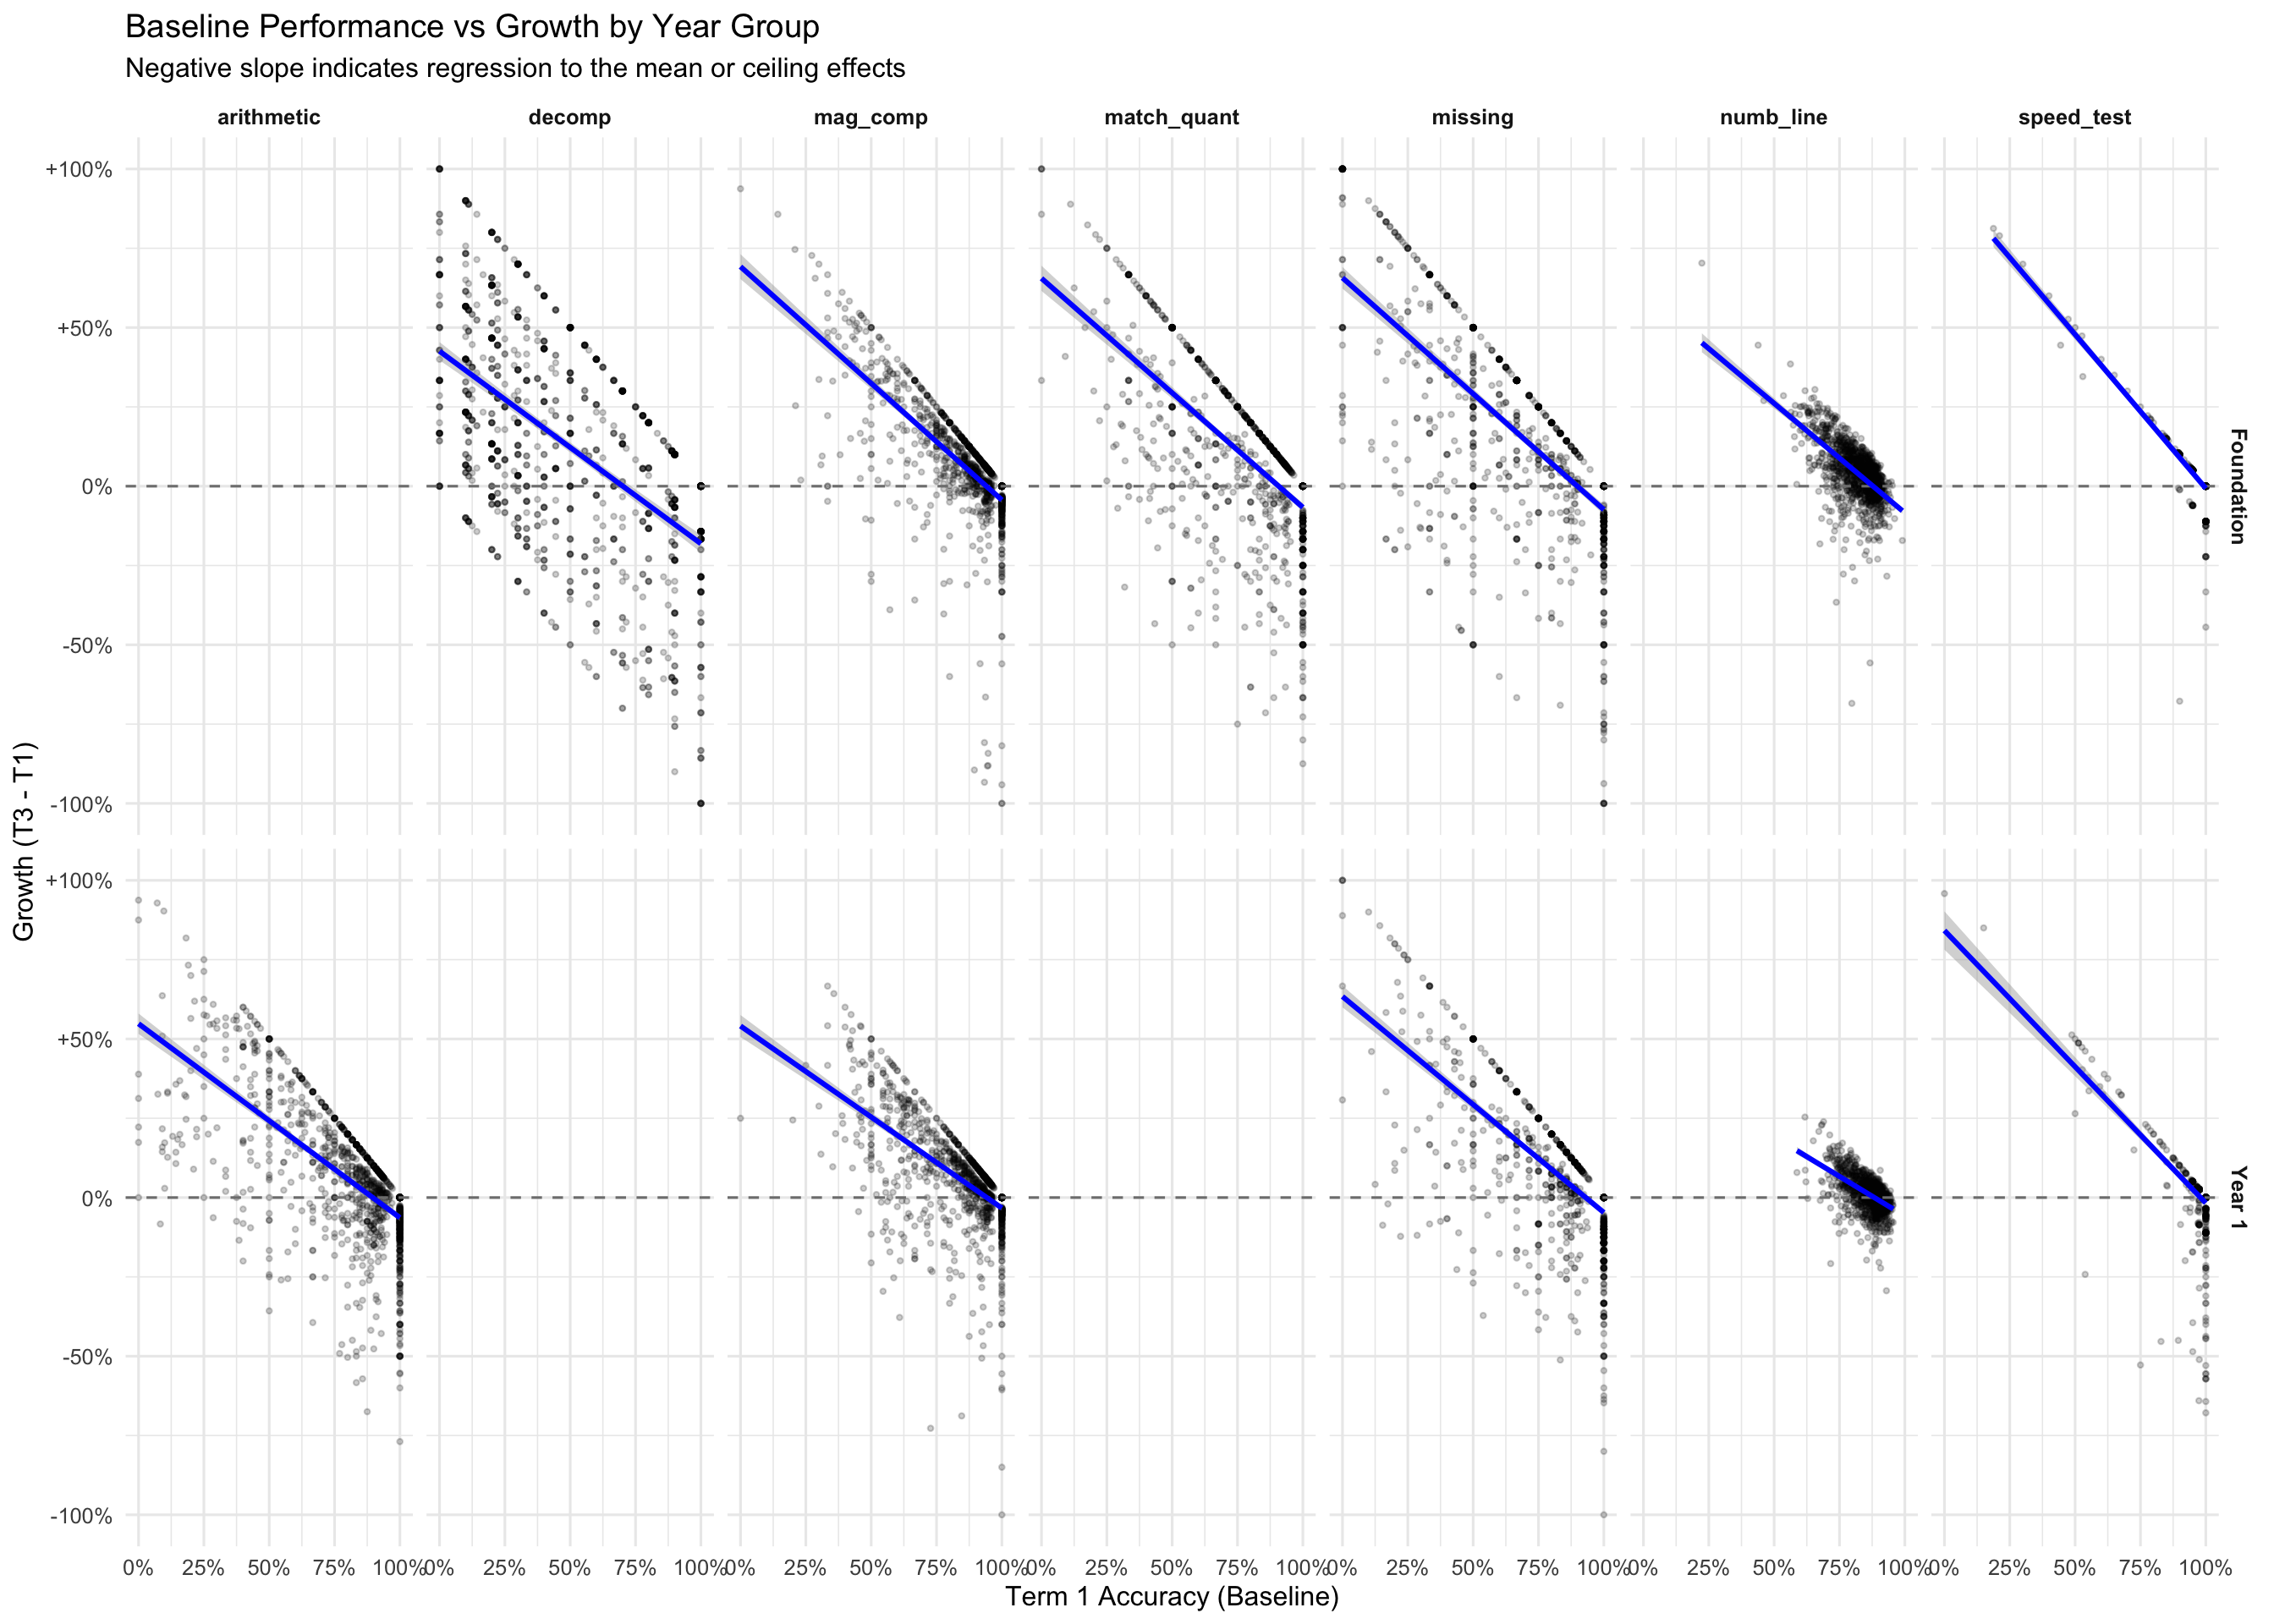
Visualising learning trajectories and growth patterns between beginning-of-year (Term 1) and middle-of-year (Term 3) assessments.
5.1 Individual Growth Trajectories
5.2 Growth Distribution
5.3 Baseline vs Growth
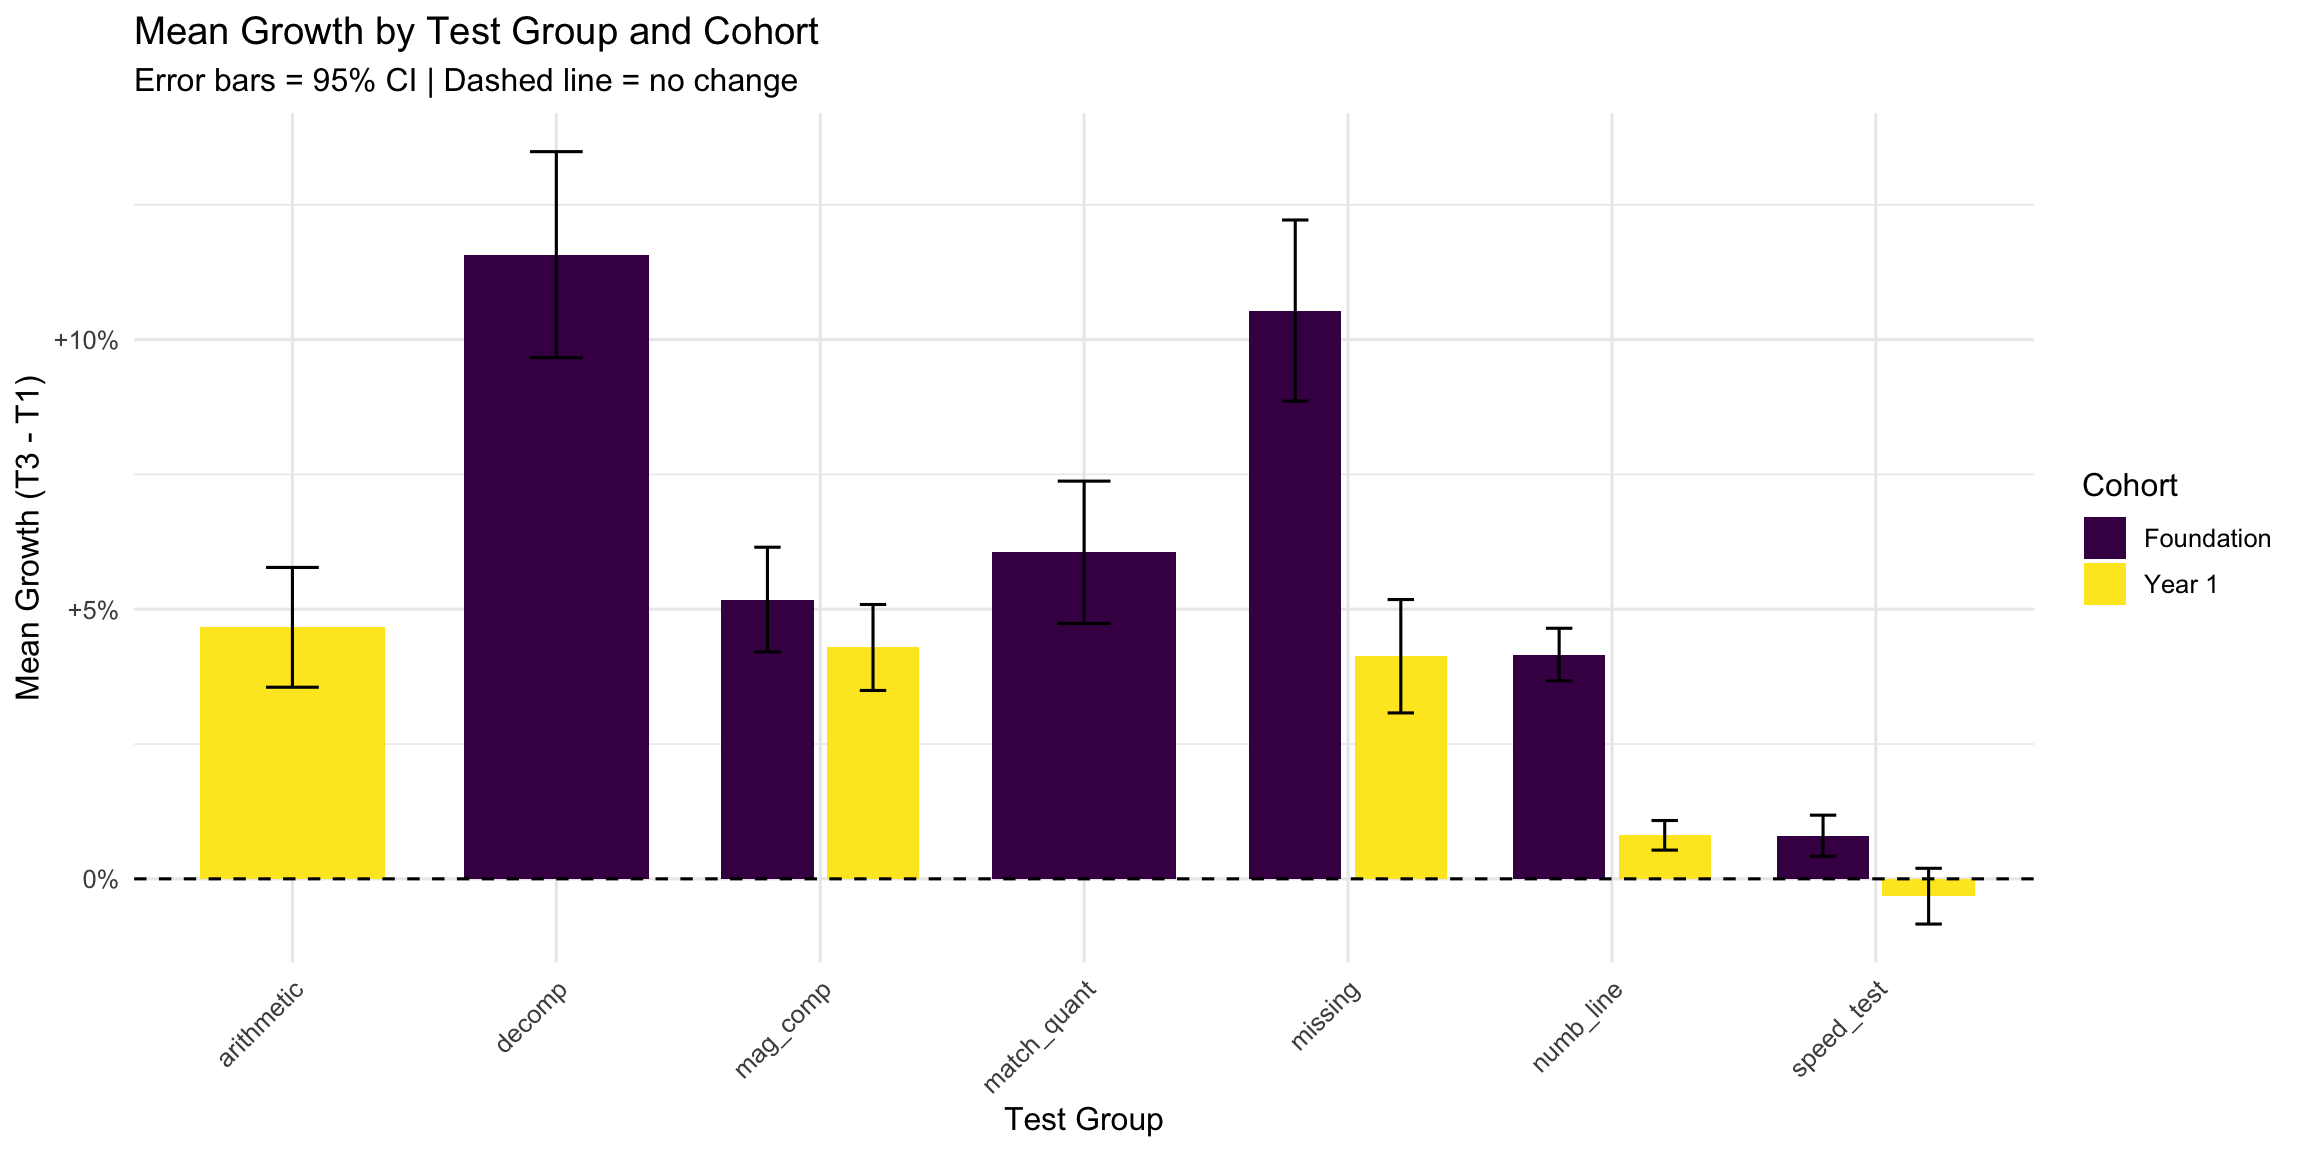
5.4 Growth Summary by Cohort
6. Cross-Test Correlations and Student Profiles
Understanding how performance on different tests relates and identifying student “profiles” across assessments.
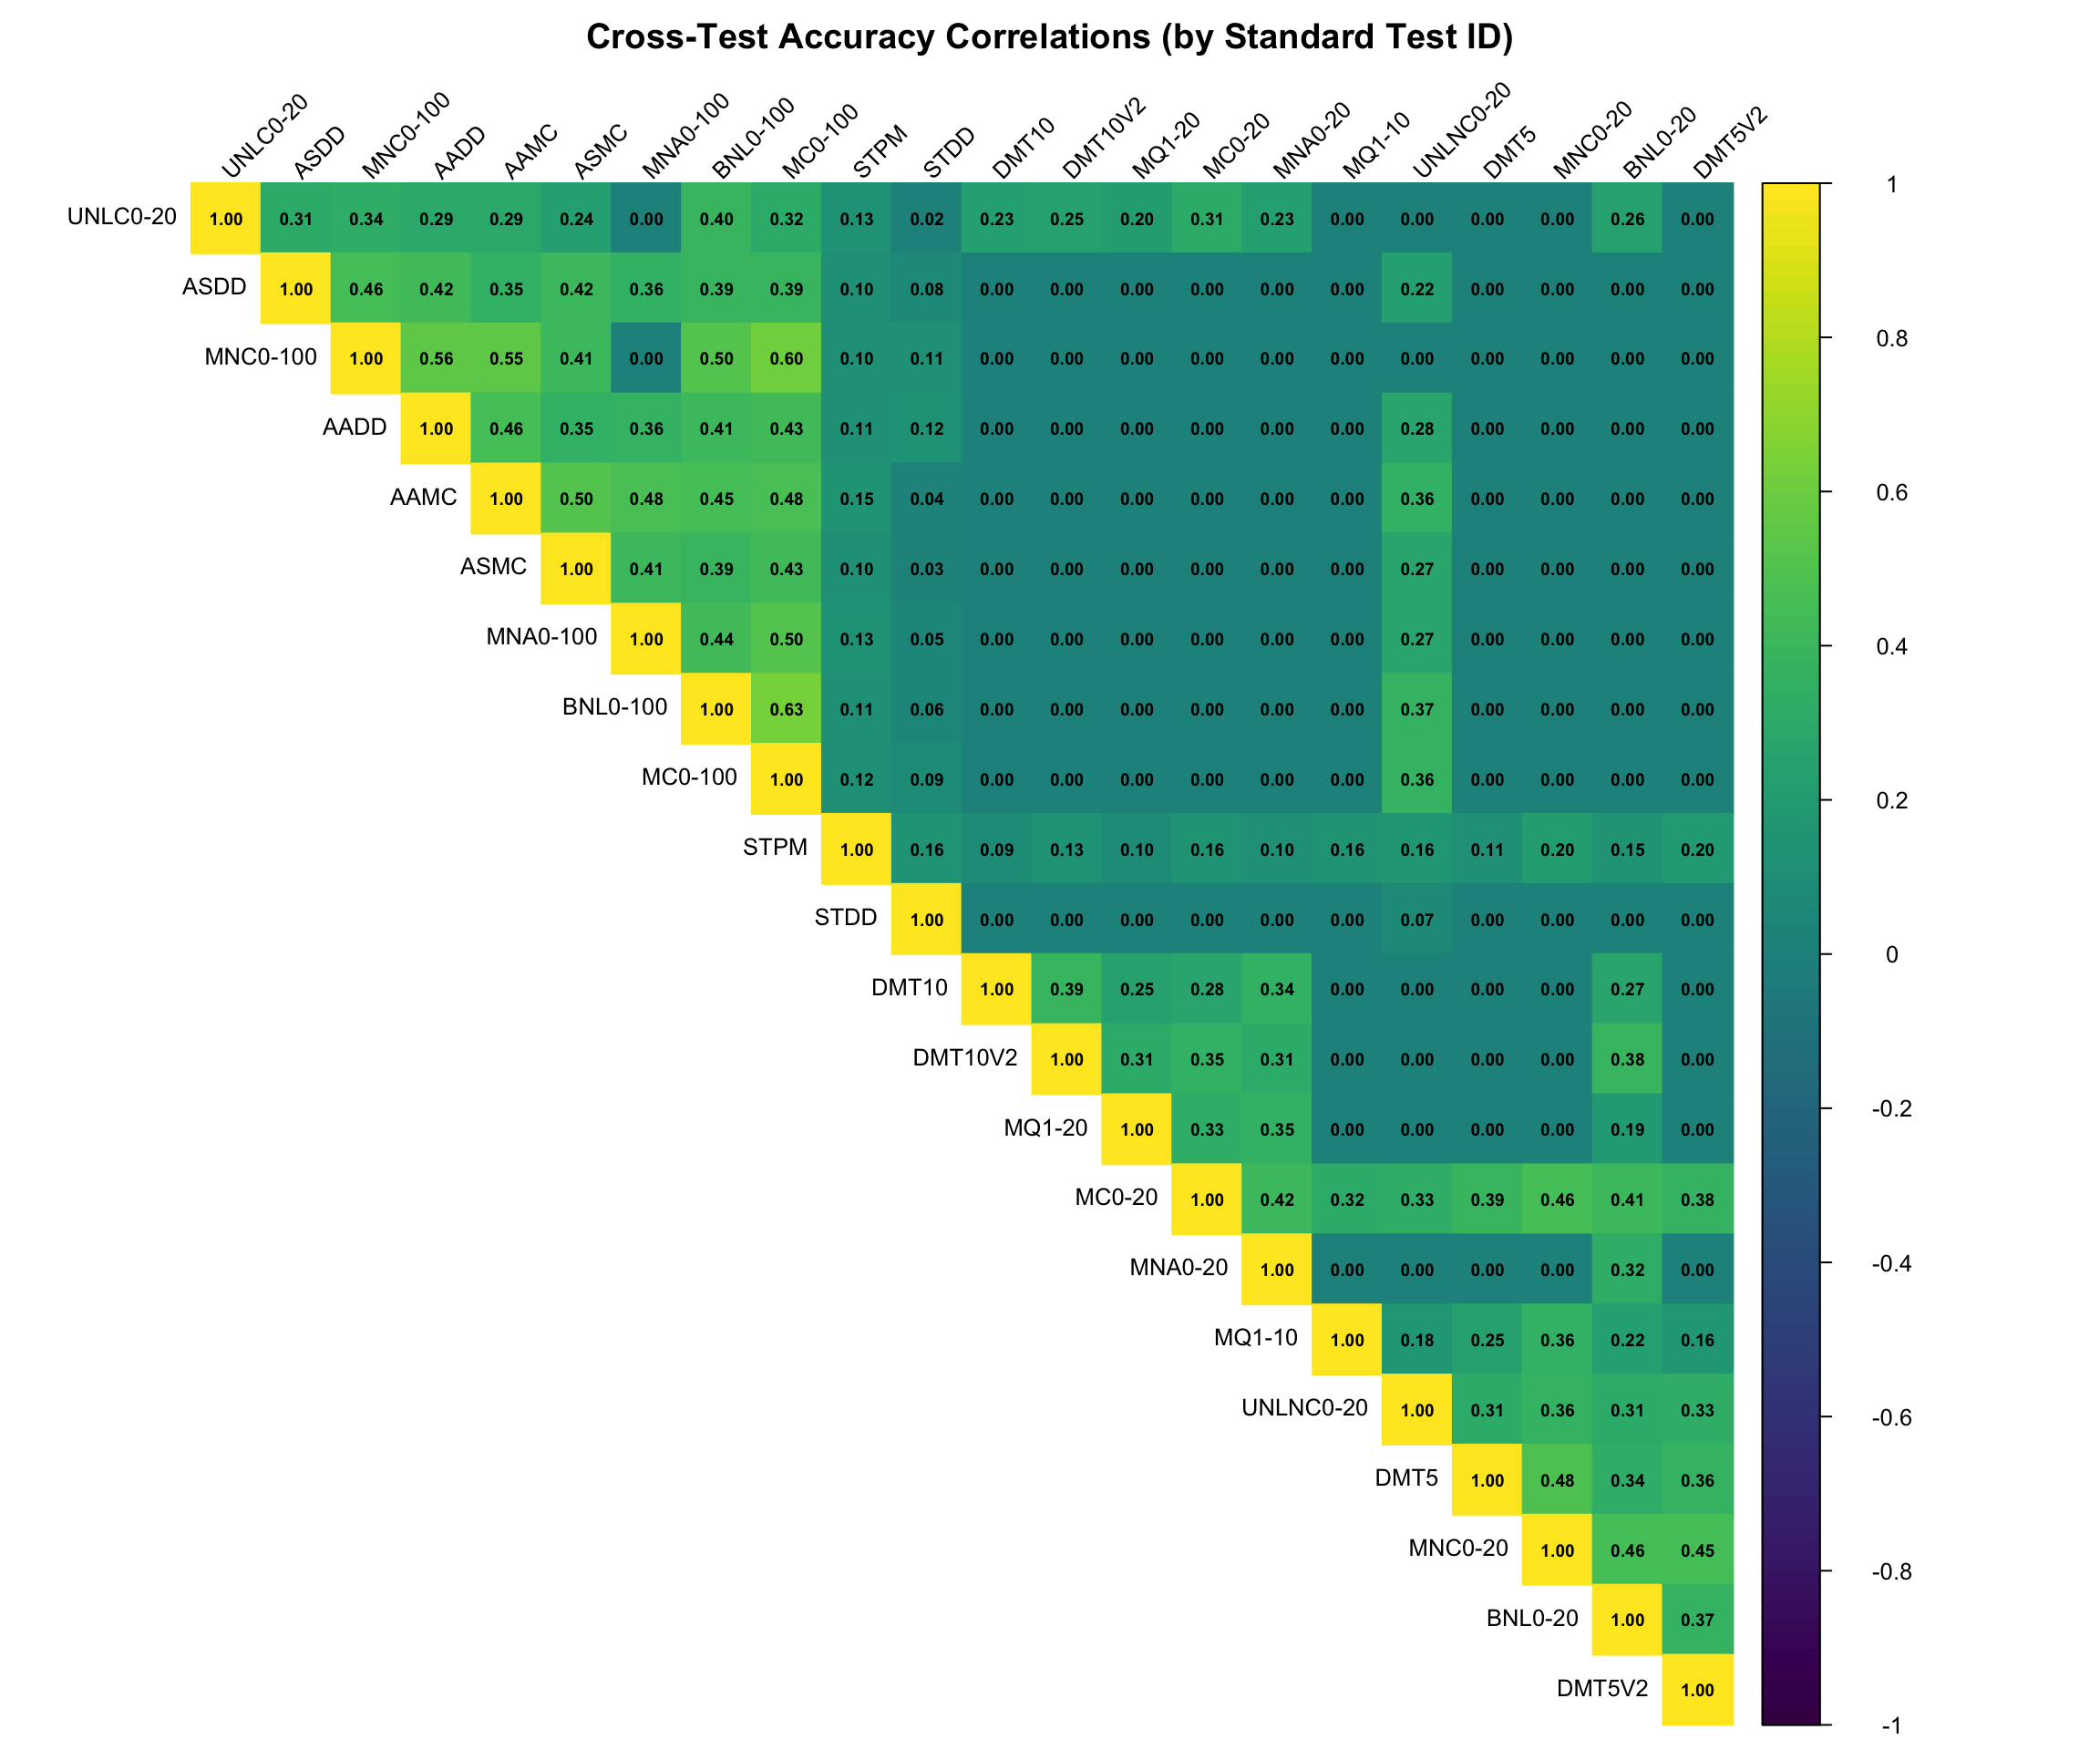
6.1 Cross-Test Correlation Matrix
6.2 Student Profile Parallel Coordinates
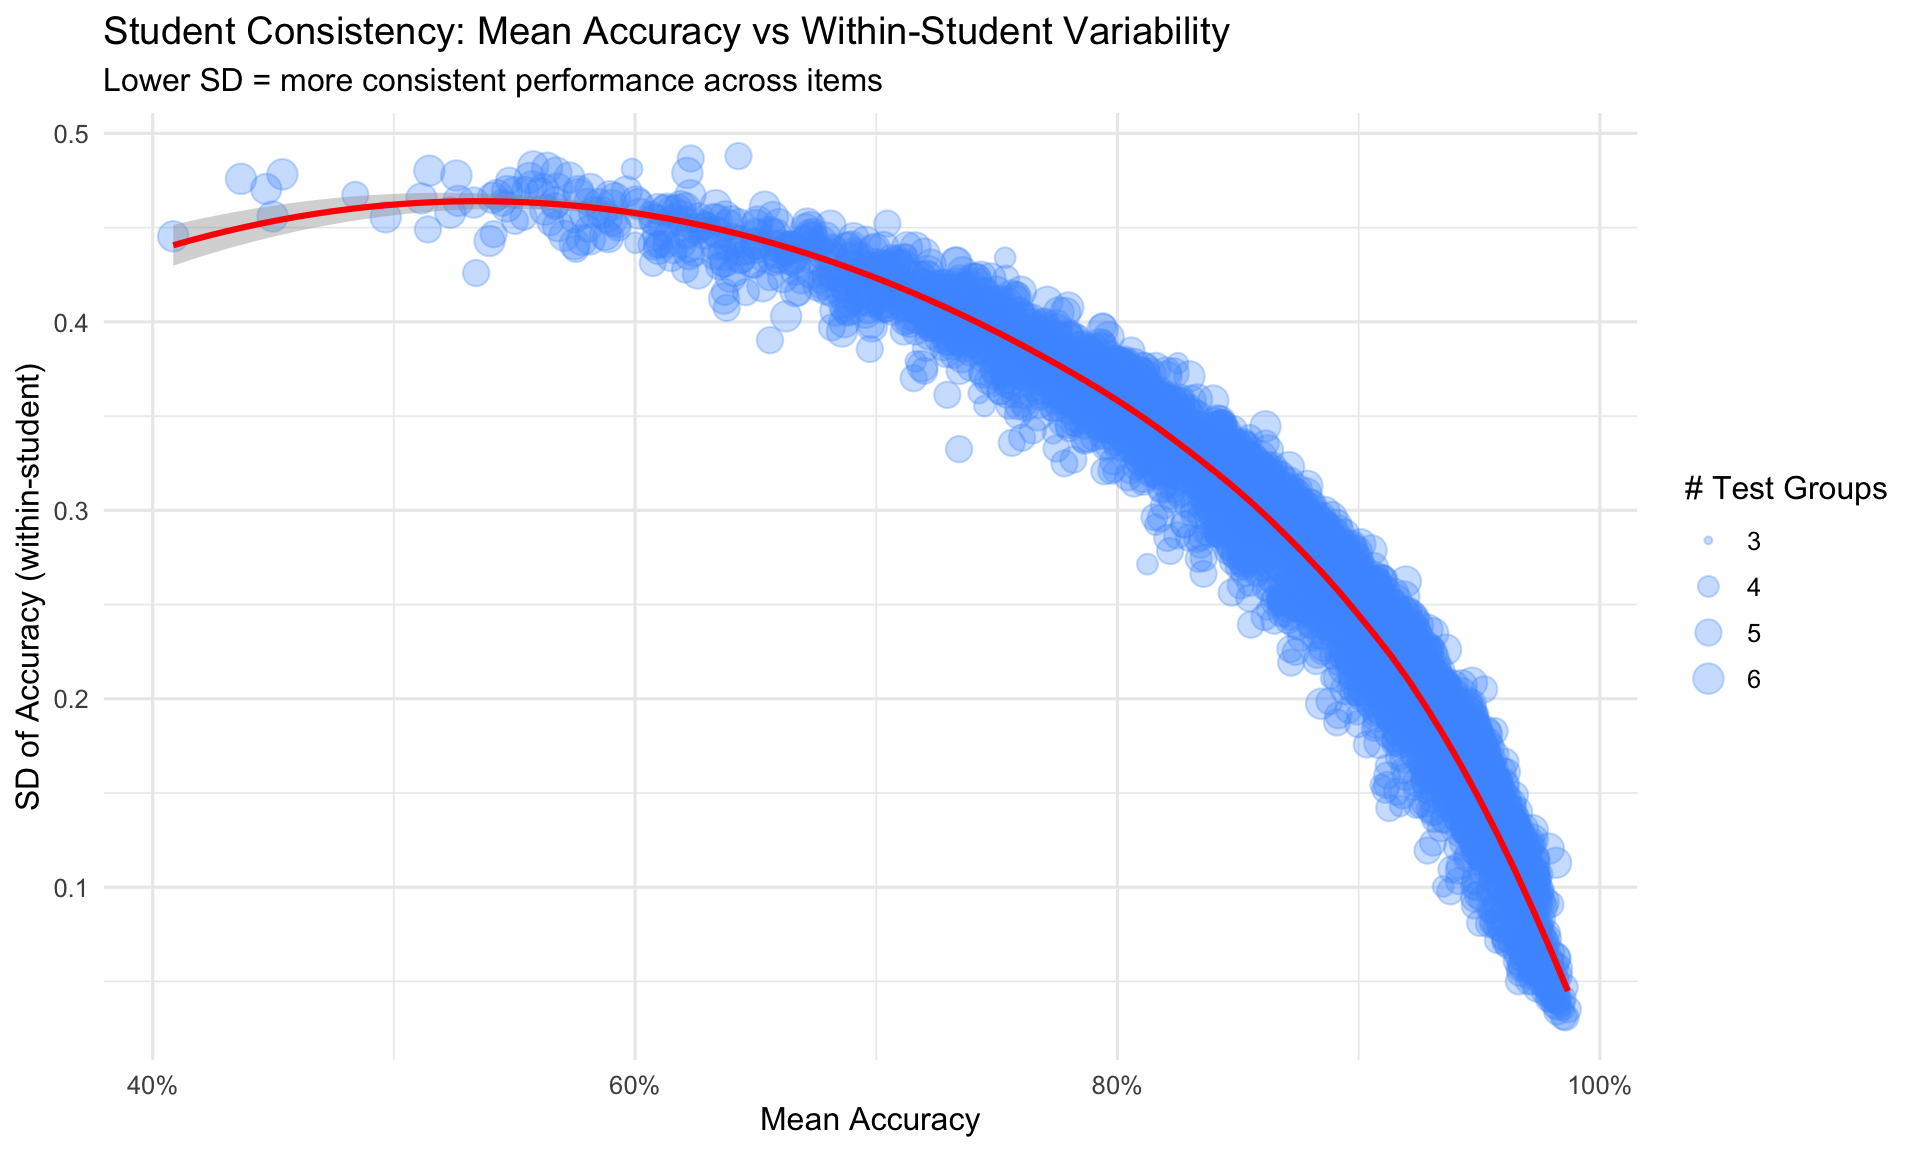
Insufficient data for parallel coordinates plot.6.3 Within-Student Consistency Analysis
7. Item-Level Patterns
Exploring item characteristics and psychometric properties.
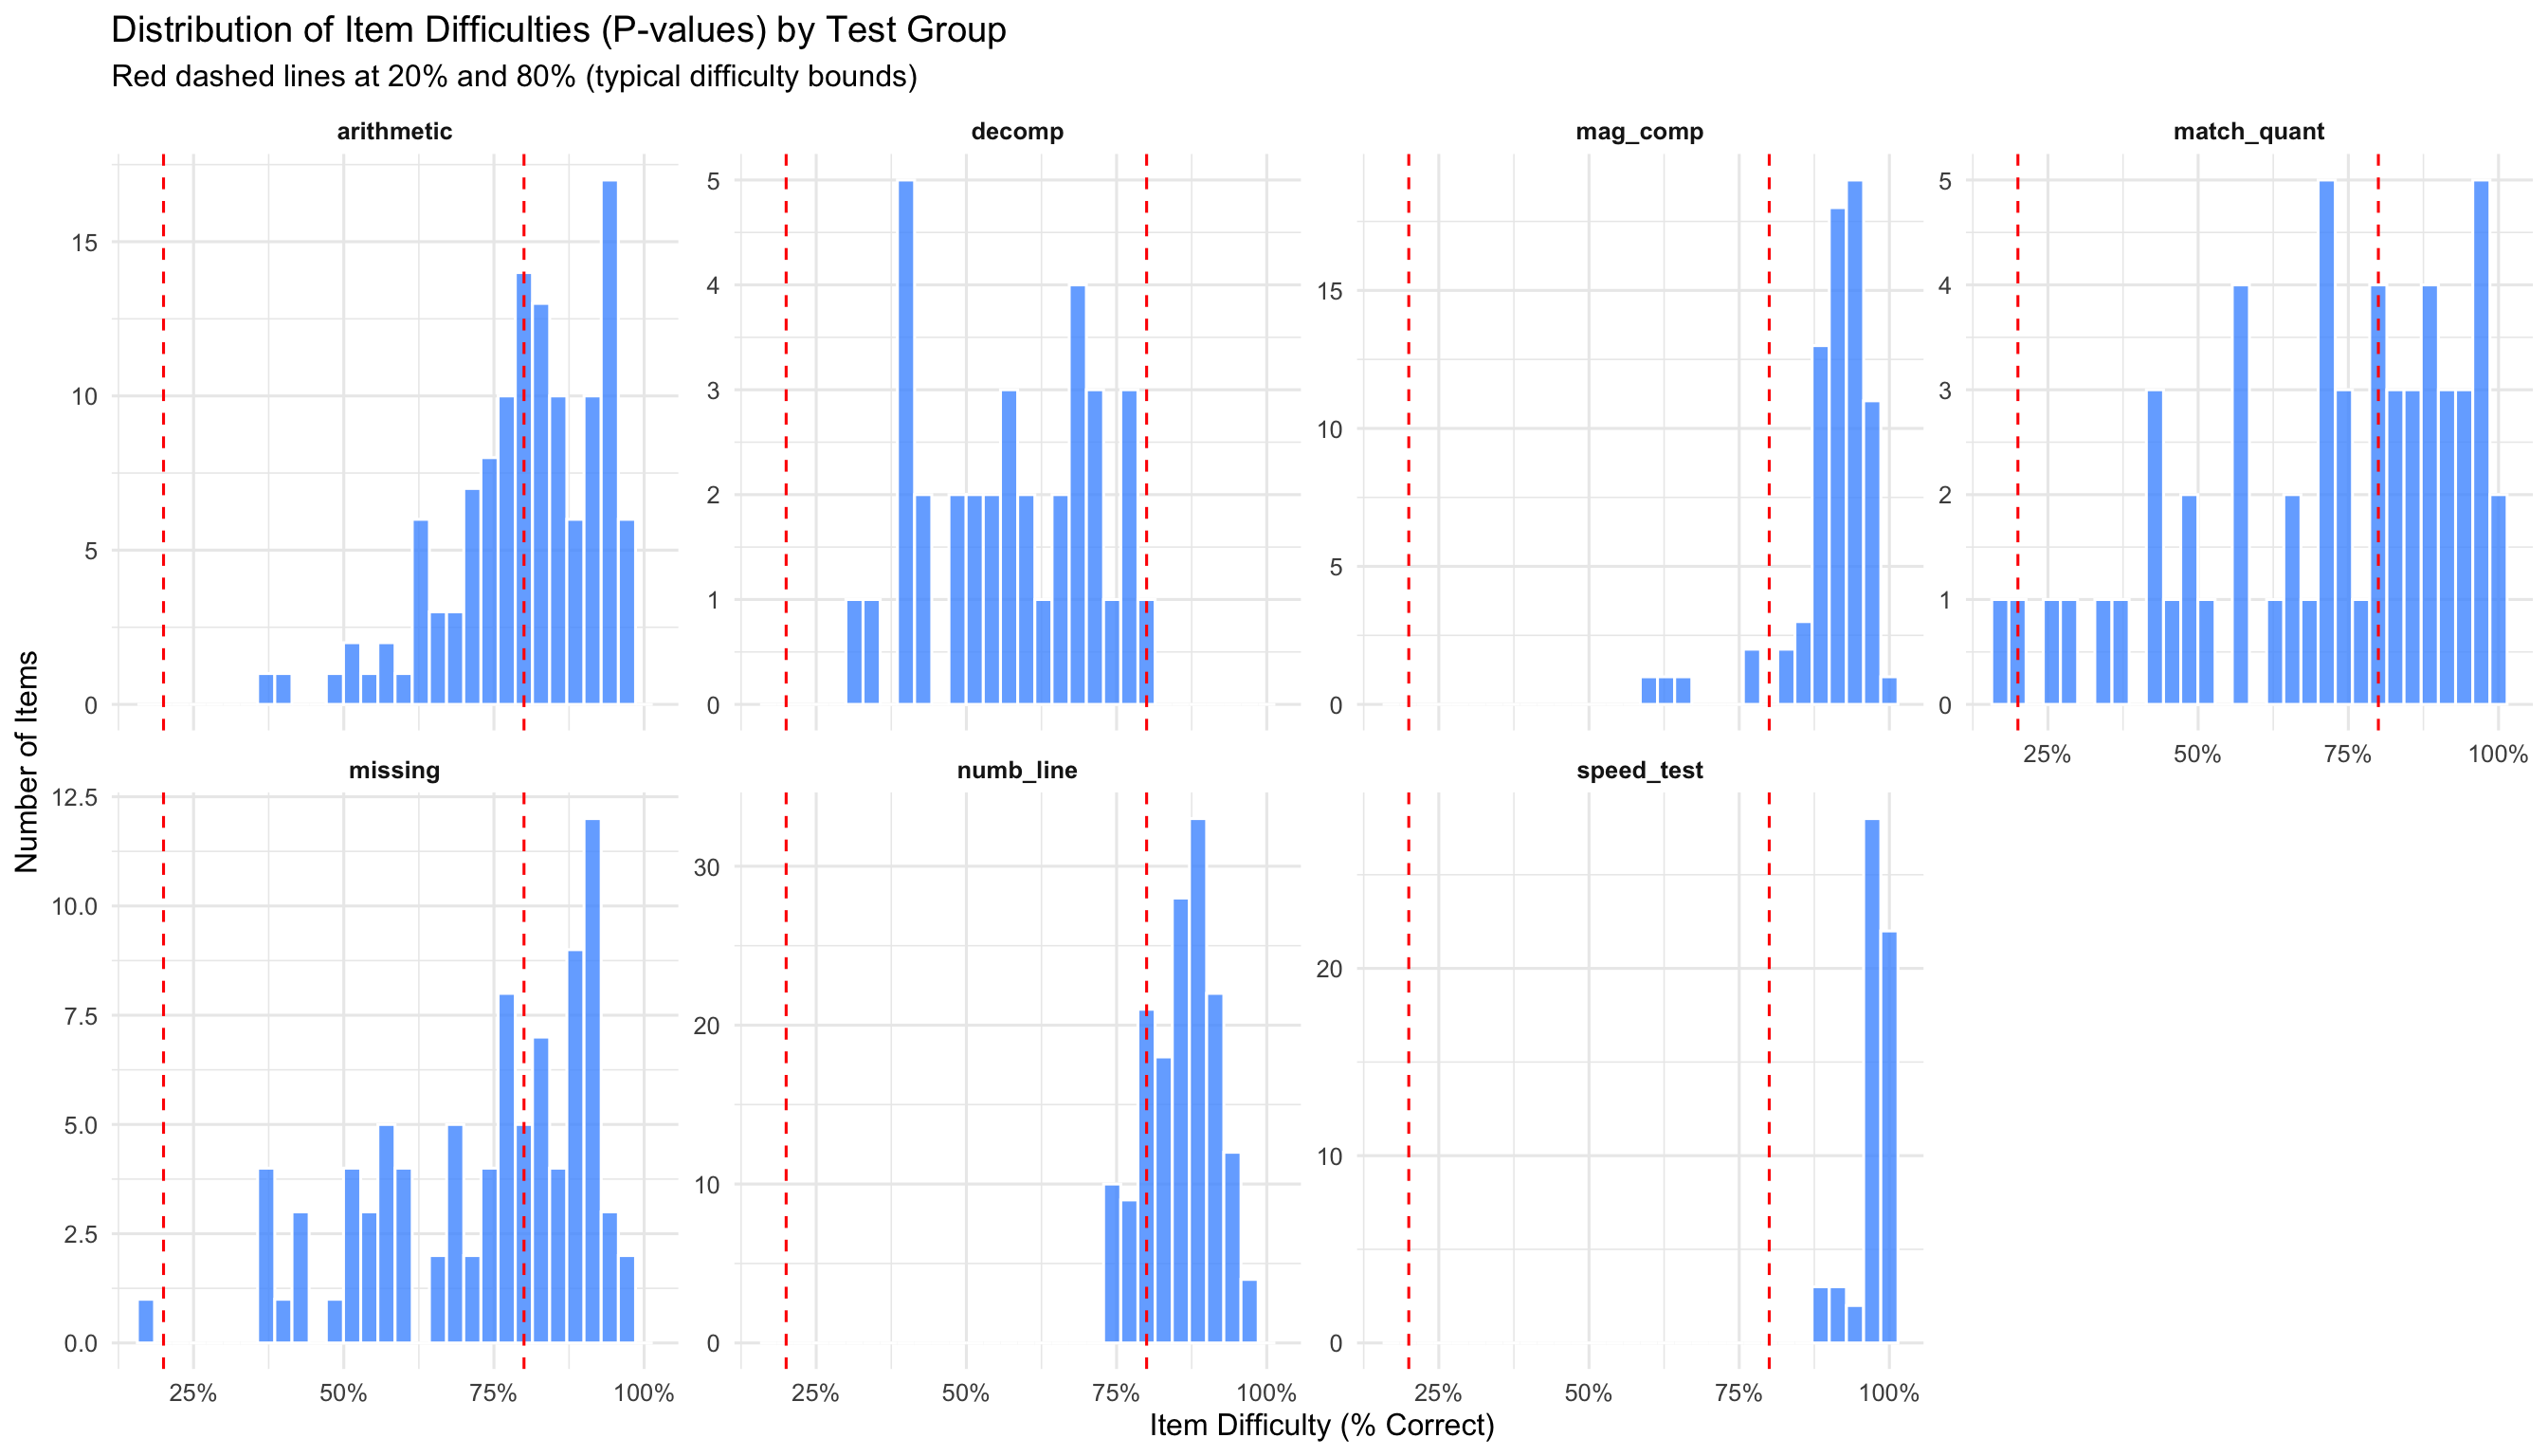
7.1 Item Difficulty Distribution
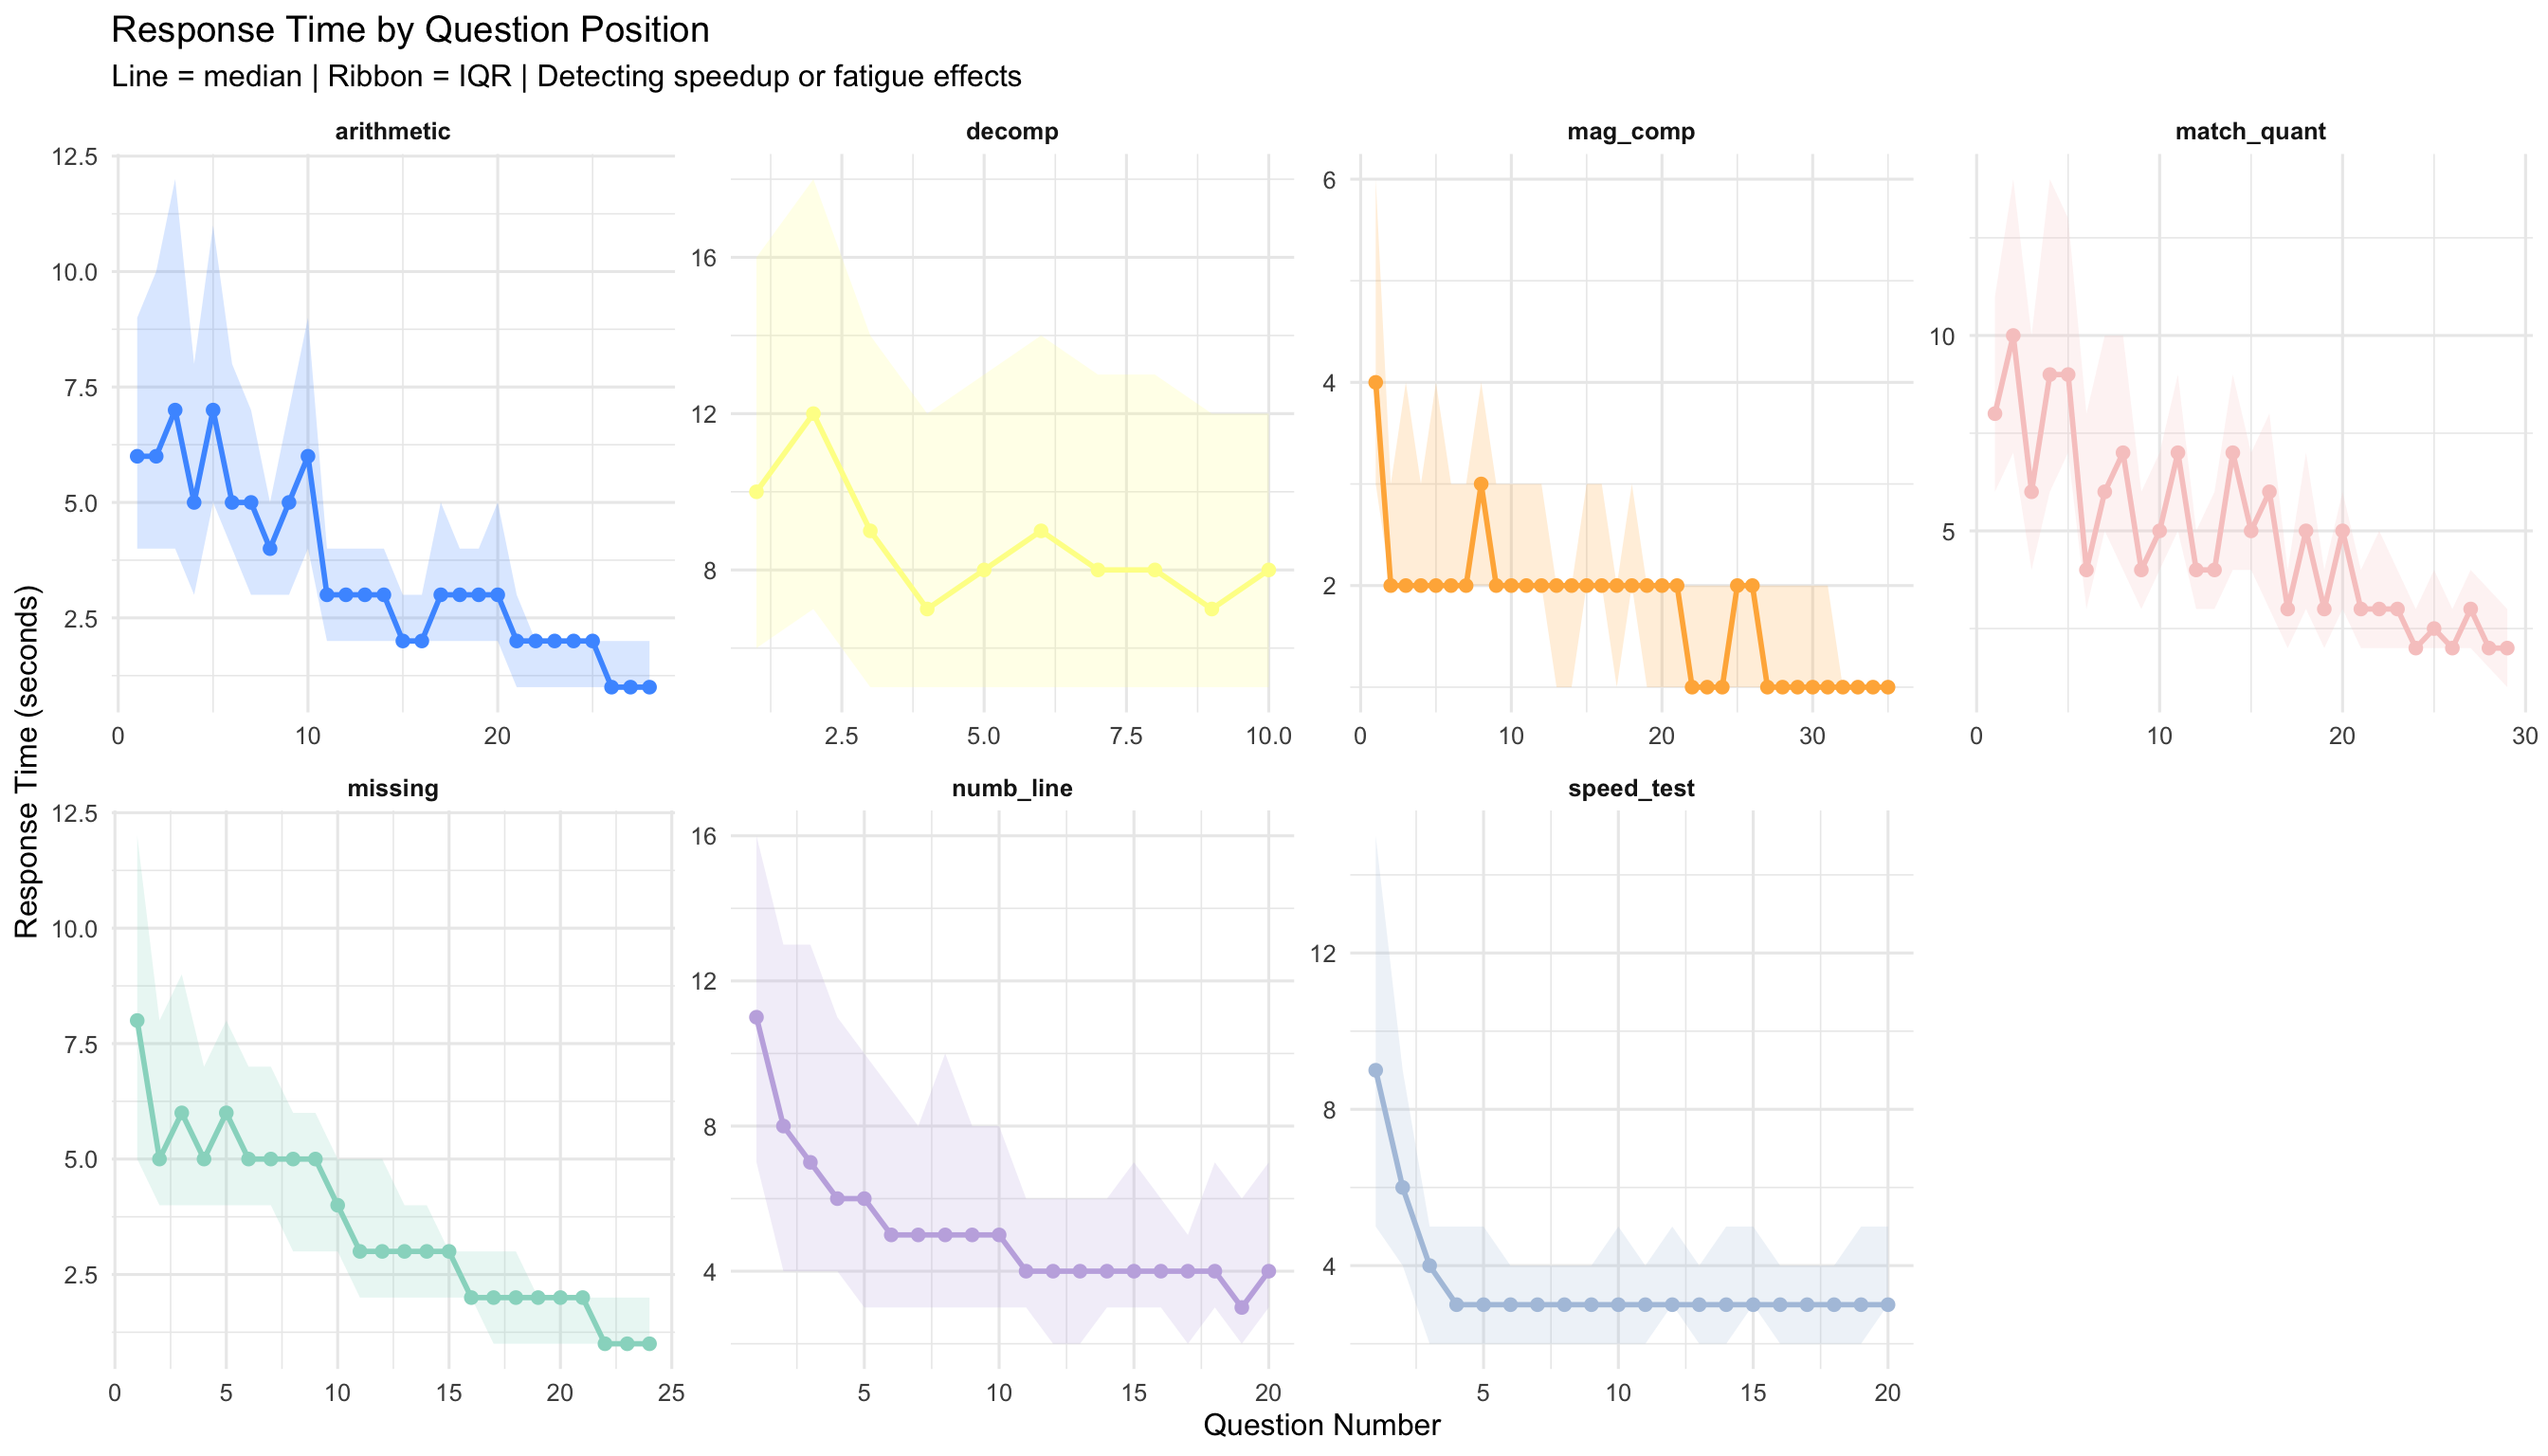
7.2 Response Time by Question Position
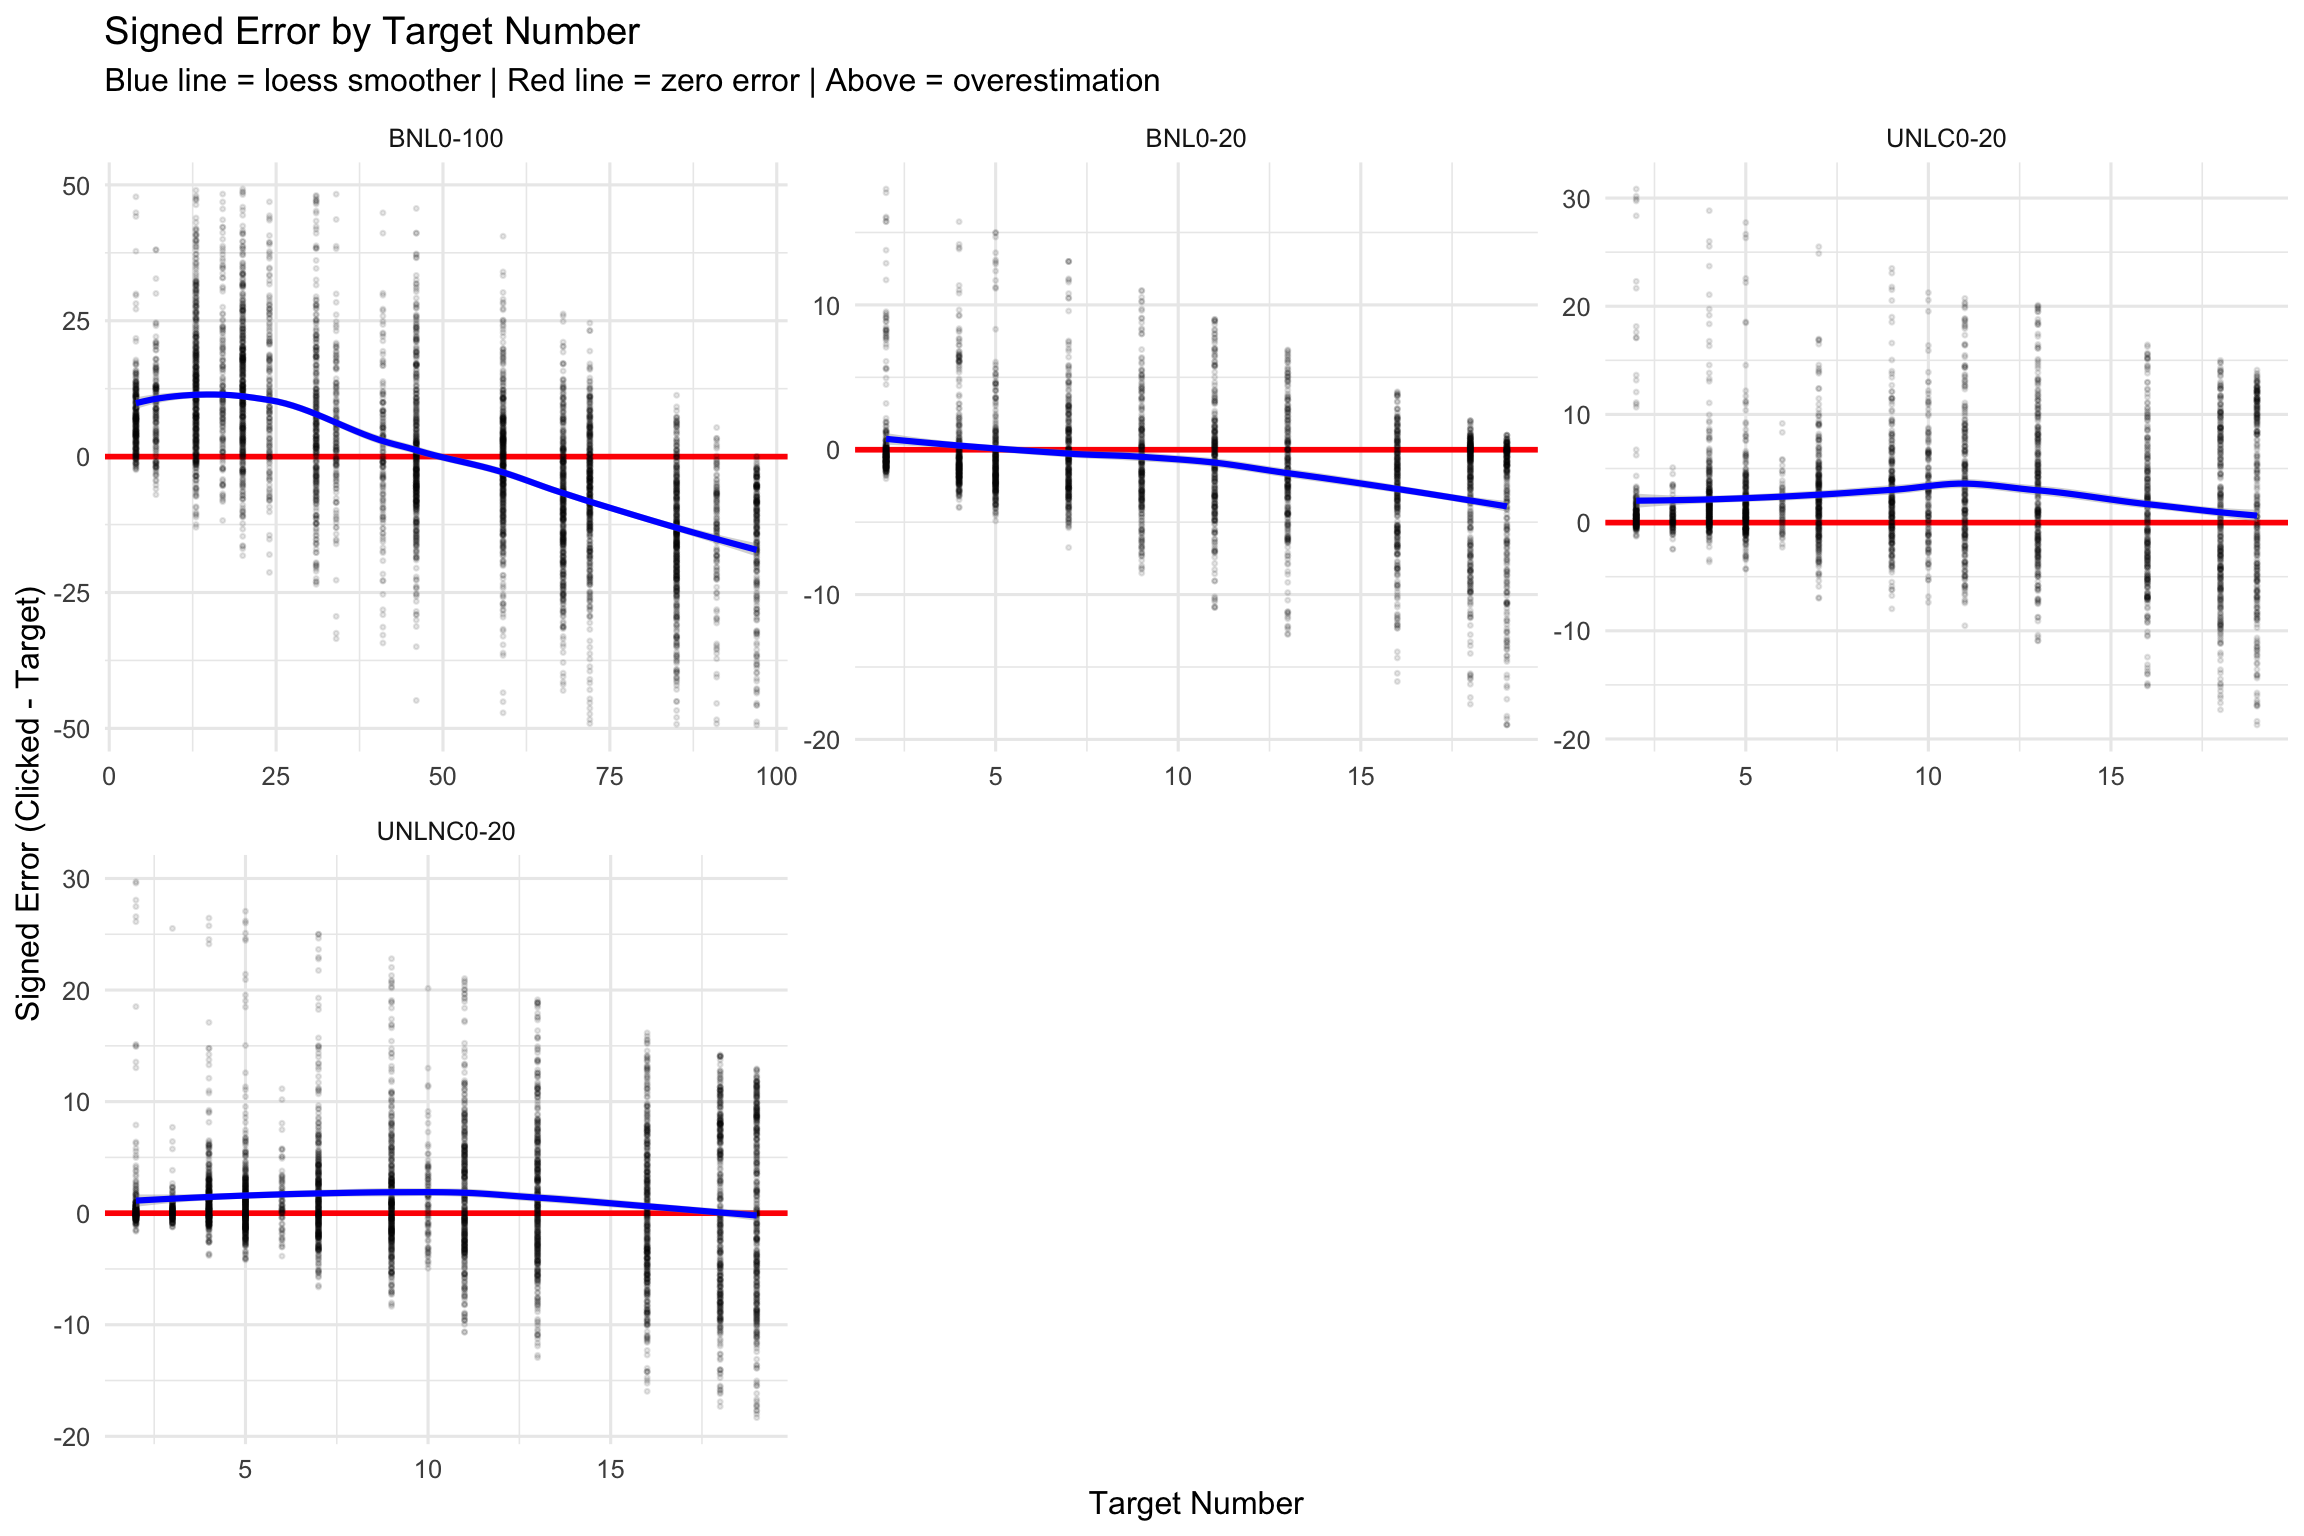
8. Number-Line Deep Dive
Detailed analysis of number-line click patterns and accuracy.
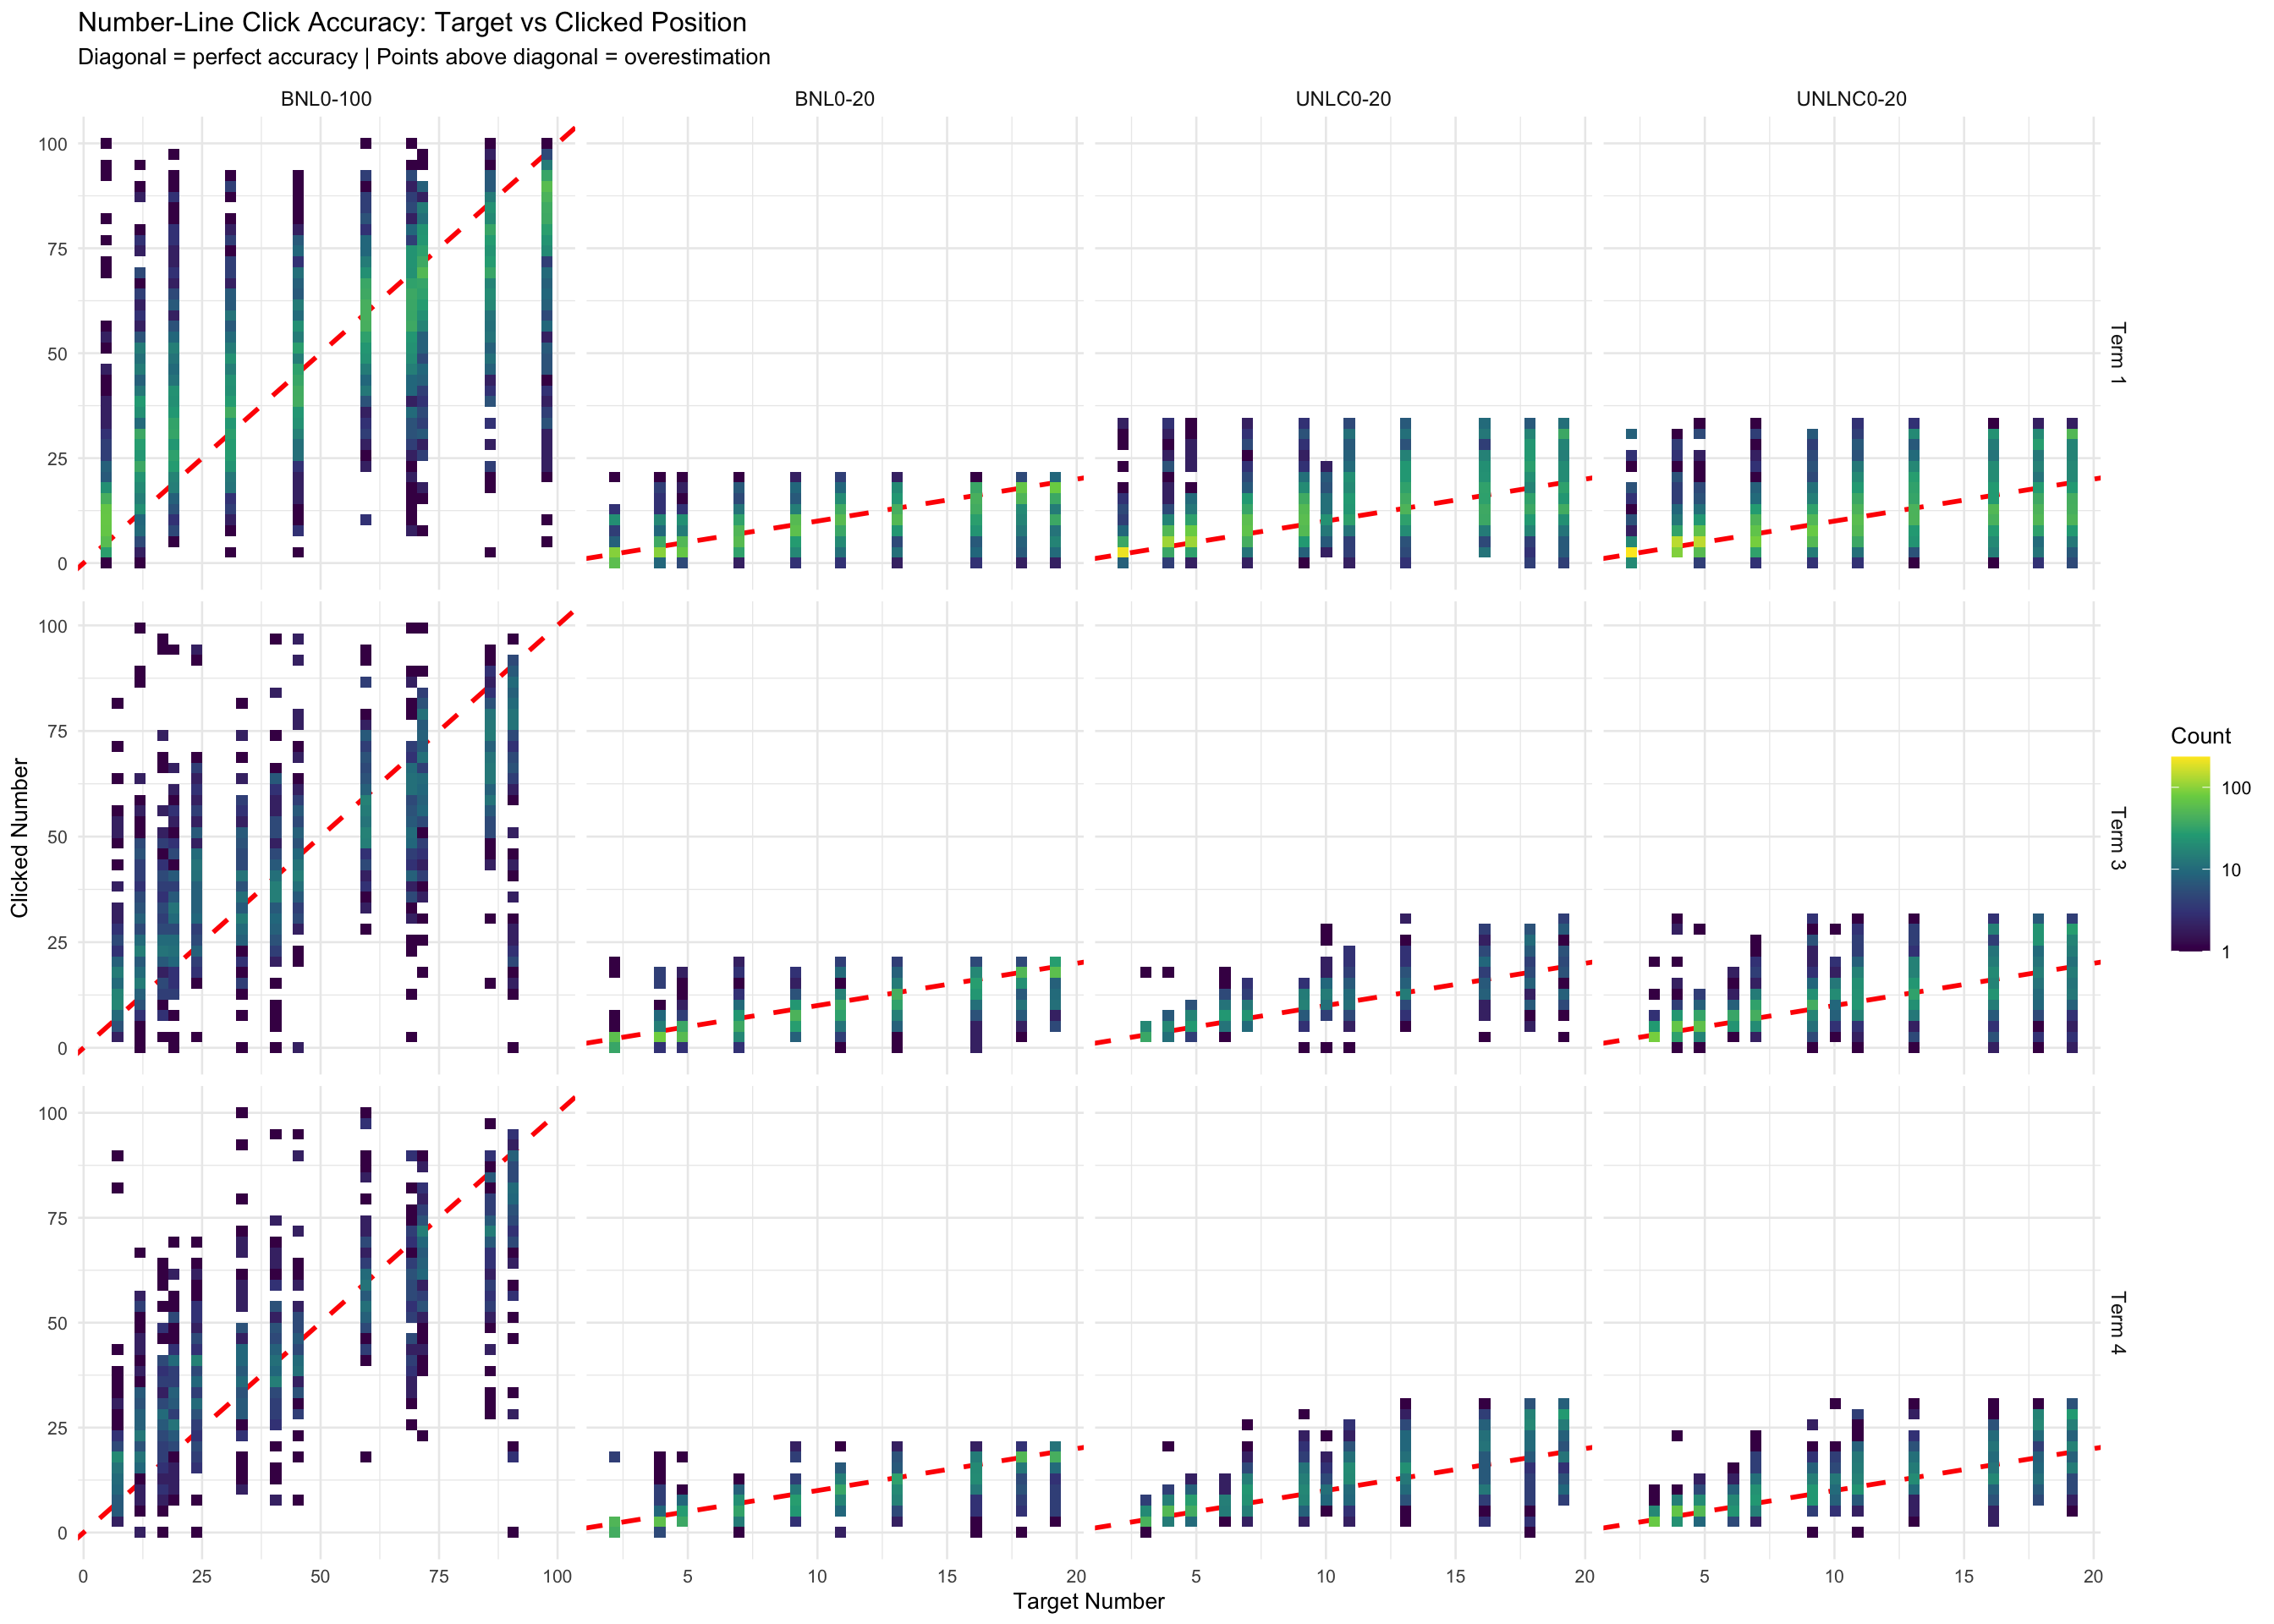
8.1 Click Accuracy
8.2 Signed Error by Target Number
8.3 Number-Line Calibration NA Summary
| Test ID | Term | Exam Group | Total Responses | raw_score NA | % NA |
|---|---|---|---|---|---|
| BNL0-100 | 1 | Year 1A - 2025 | 29,480 | 2,987 | 10.1 |
| BNL0-100 | 1 | Year 1B - 2025 | 25,058 | 2,851 | 11.4 |
| BNL0-20 | 1 | Foundation A 2025 | 15,840 | 2,750 | 17.4 |
| UNLNC0-20 | 1 | Year 1A - 2025 | 28,886 | 2,639 | 9.1 |
| BNL0-20 | 1 | Foundation B 2025 | 14,856 | 2,637 | 17.8 |
| UNLNC0-20 | 1 | Foundation A 2025 | 15,456 | 2,255 | 14.6 |
| UNLC0-20 | 1 | Year 1B - 2025 | 24,266 | 2,194 | 9.0 |
| UNLC0-20 | 1 | Foundation B 2025 | 14,196 | 2,050 | 14.4 |
| UNLNC0-20 | 3 | Foundation A 2025 | 8,668 | 864 | 10.0 |
| UNLC0-20 | 3 | Year 1B - 2025 | 8,541 | 796 | 9.3 |
| BNL0-20 | 3 | Foundation A 2025 | 8,613 | 568 | 6.6 |
| UNLNC0-20 | 3 | Year 1A - 2025 | 11,505 | 511 | 4.4 |
| UNLC0-20 | 4 | Foundation B 2025 | 5,962 | 467 | 7.8 |
| BNL0-100 | 3 | Year 1A - 2025 | 12,082 | 416 | 3.4 |
| BNL0-20 | 3 | Foundation B 2025 | 7,117 | 386 | 5.4 |
| UNLNC0-20 | 4 | Foundation A 2025 | 6,413 | 370 | 5.8 |
| BNL0-20 | 4 | Foundation A 2025 | 6,226 | 357 | 5.7 |
| UNLNC0-20 | 4 | Year 1A - 2025 | 7,787 | 350 | 4.5 |
| BNL0-20 | 4 | Foundation B 2025 | 5,687 | 348 | 6.1 |
| UNLC0-20 | 4 | Year 1B - 2025 | 6,383 | 303 | 4.7 |
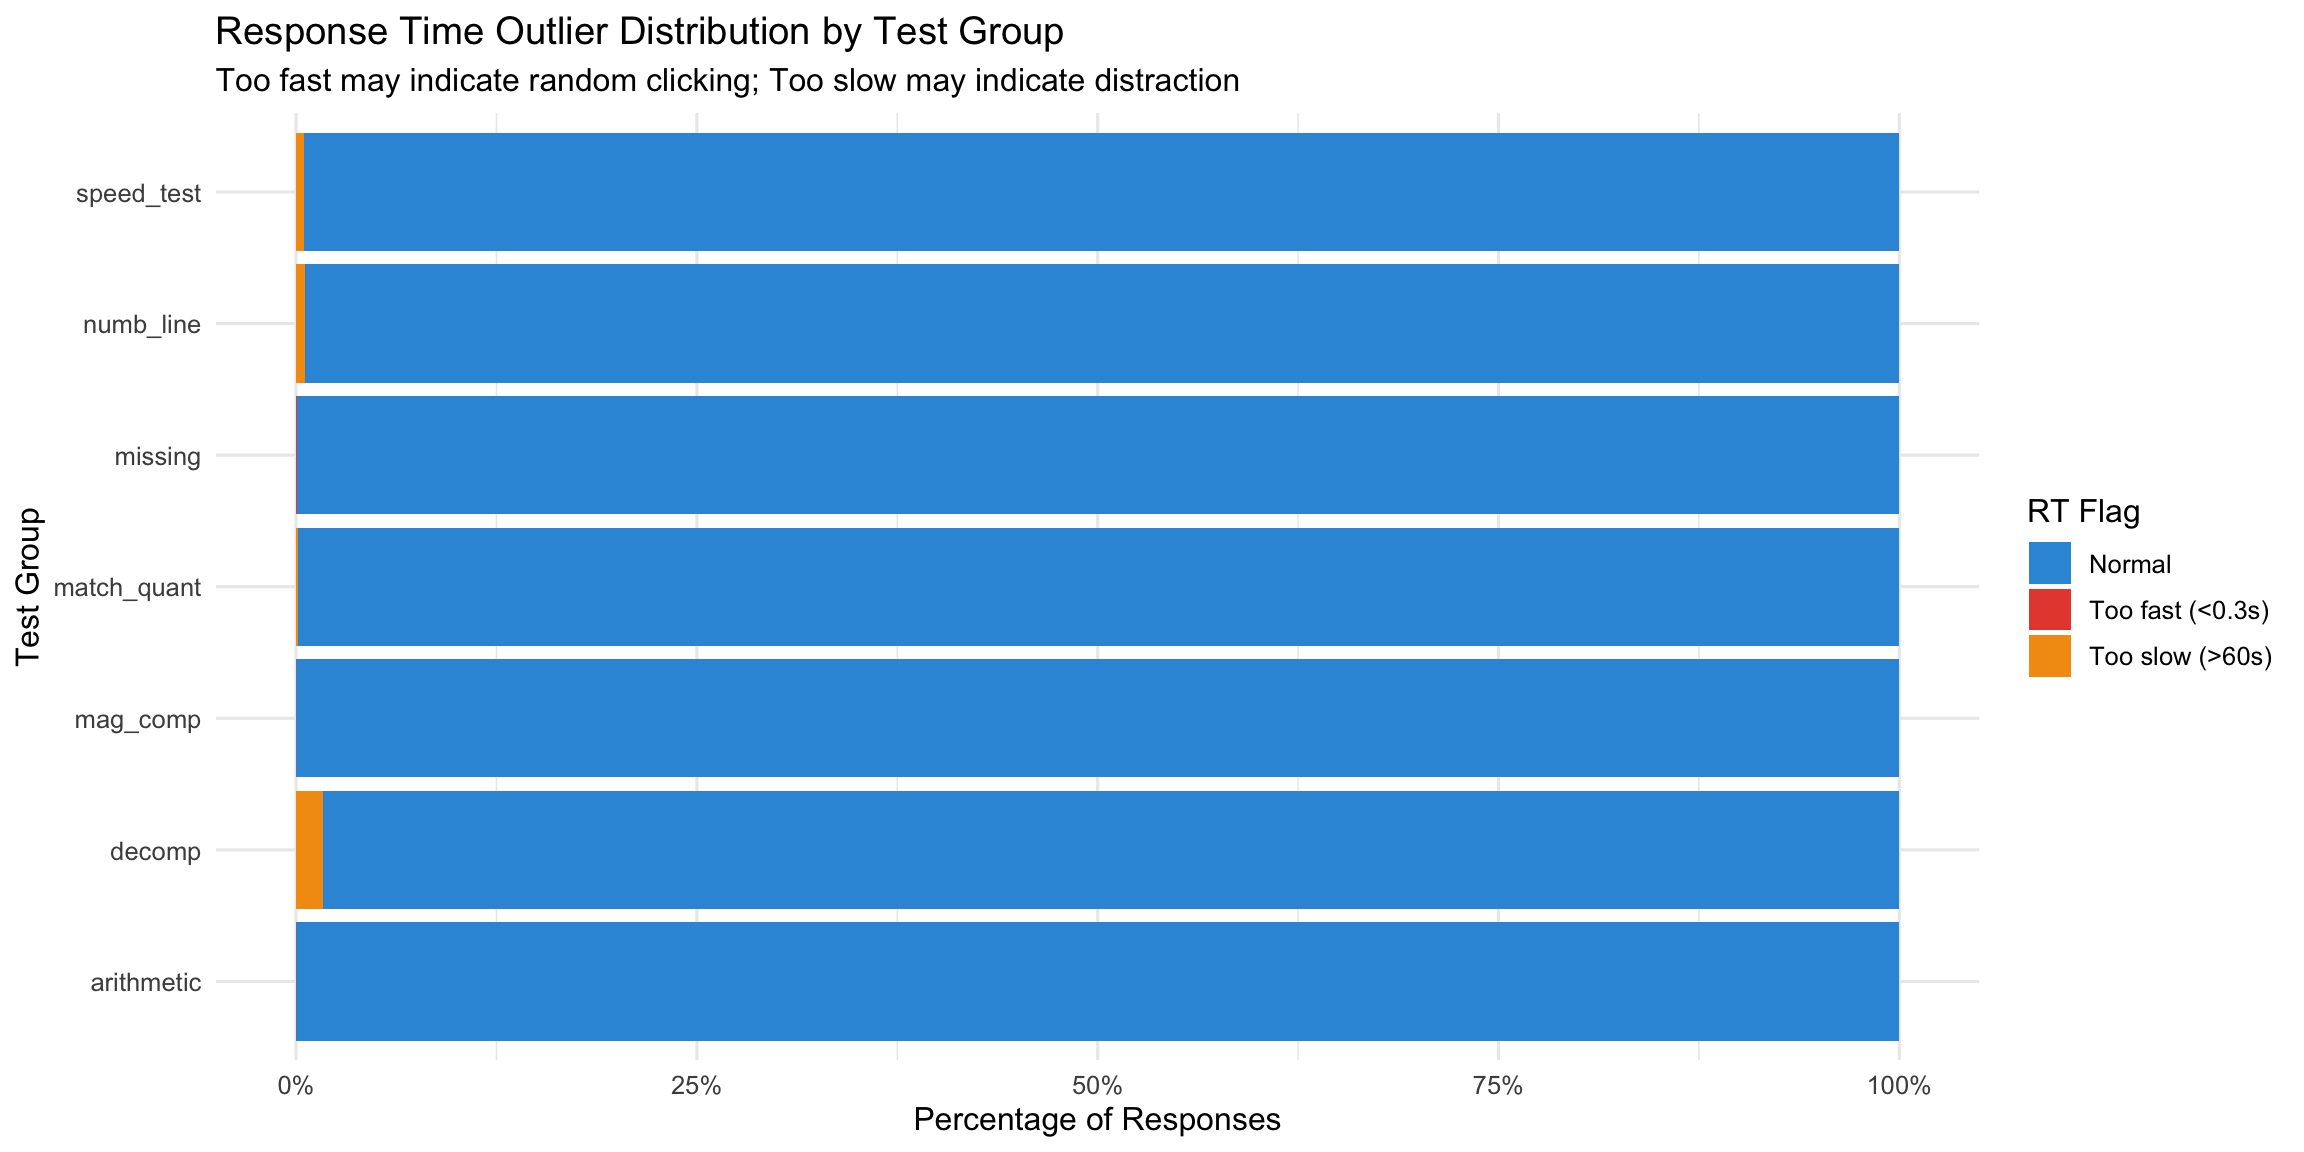
9. Outlier Detection and Data Quality Flags
Systematically identifying suspicious patterns for further investigation.
9.1 Response Time Outliers
9.2 Accuracy Outlier Patterns
| Test Group | Flag | Count |
|---|---|---|
| arithmetic | 100% accuracy (20+ items) | 213 |
| arithmetic | ~50% accuracy (random 2-choice?) | 20 |
| arithmetic | ~25% accuracy (random 4-choice?) | 6 |
| arithmetic | 0% accuracy (10+ items) | 2 |
| decomp | ~50% accuracy (random 2-choice?) | 97 |
| decomp | ~25% accuracy (random 4-choice?) | 55 |
| decomp | 100% accuracy (20+ items) | 42 |
| decomp | 0% accuracy (10+ items) | 16 |
| mag_comp | 100% accuracy (20+ items) | 786 |
| mag_comp | ~50% accuracy (random 2-choice?) | 25 |
| mag_comp | 0% accuracy (10+ items) | 3 |
| mag_comp | ~25% accuracy (random 4-choice?) | 3 |
| match_quant | 100% accuracy (20+ items) | 247 |
| match_quant | ~50% accuracy (random 2-choice?) | 25 |
| match_quant | ~25% accuracy (random 4-choice?) | 7 |
| missing | 100% accuracy (20+ items) | 443 |
| missing | ~50% accuracy (random 2-choice?) | 37 |
| missing | ~25% accuracy (random 4-choice?) | 36 |
| missing | 0% accuracy (10+ items) | 1 |
| numb_line | ~50% accuracy (random 2-choice?) | 2 |
| speed_test | 100% accuracy (20+ items) | 3546 |
| speed_test | ~25% accuracy (random 4-choice?) | 1 |
| speed_test | ~50% accuracy (random 2-choice?) | 1 |
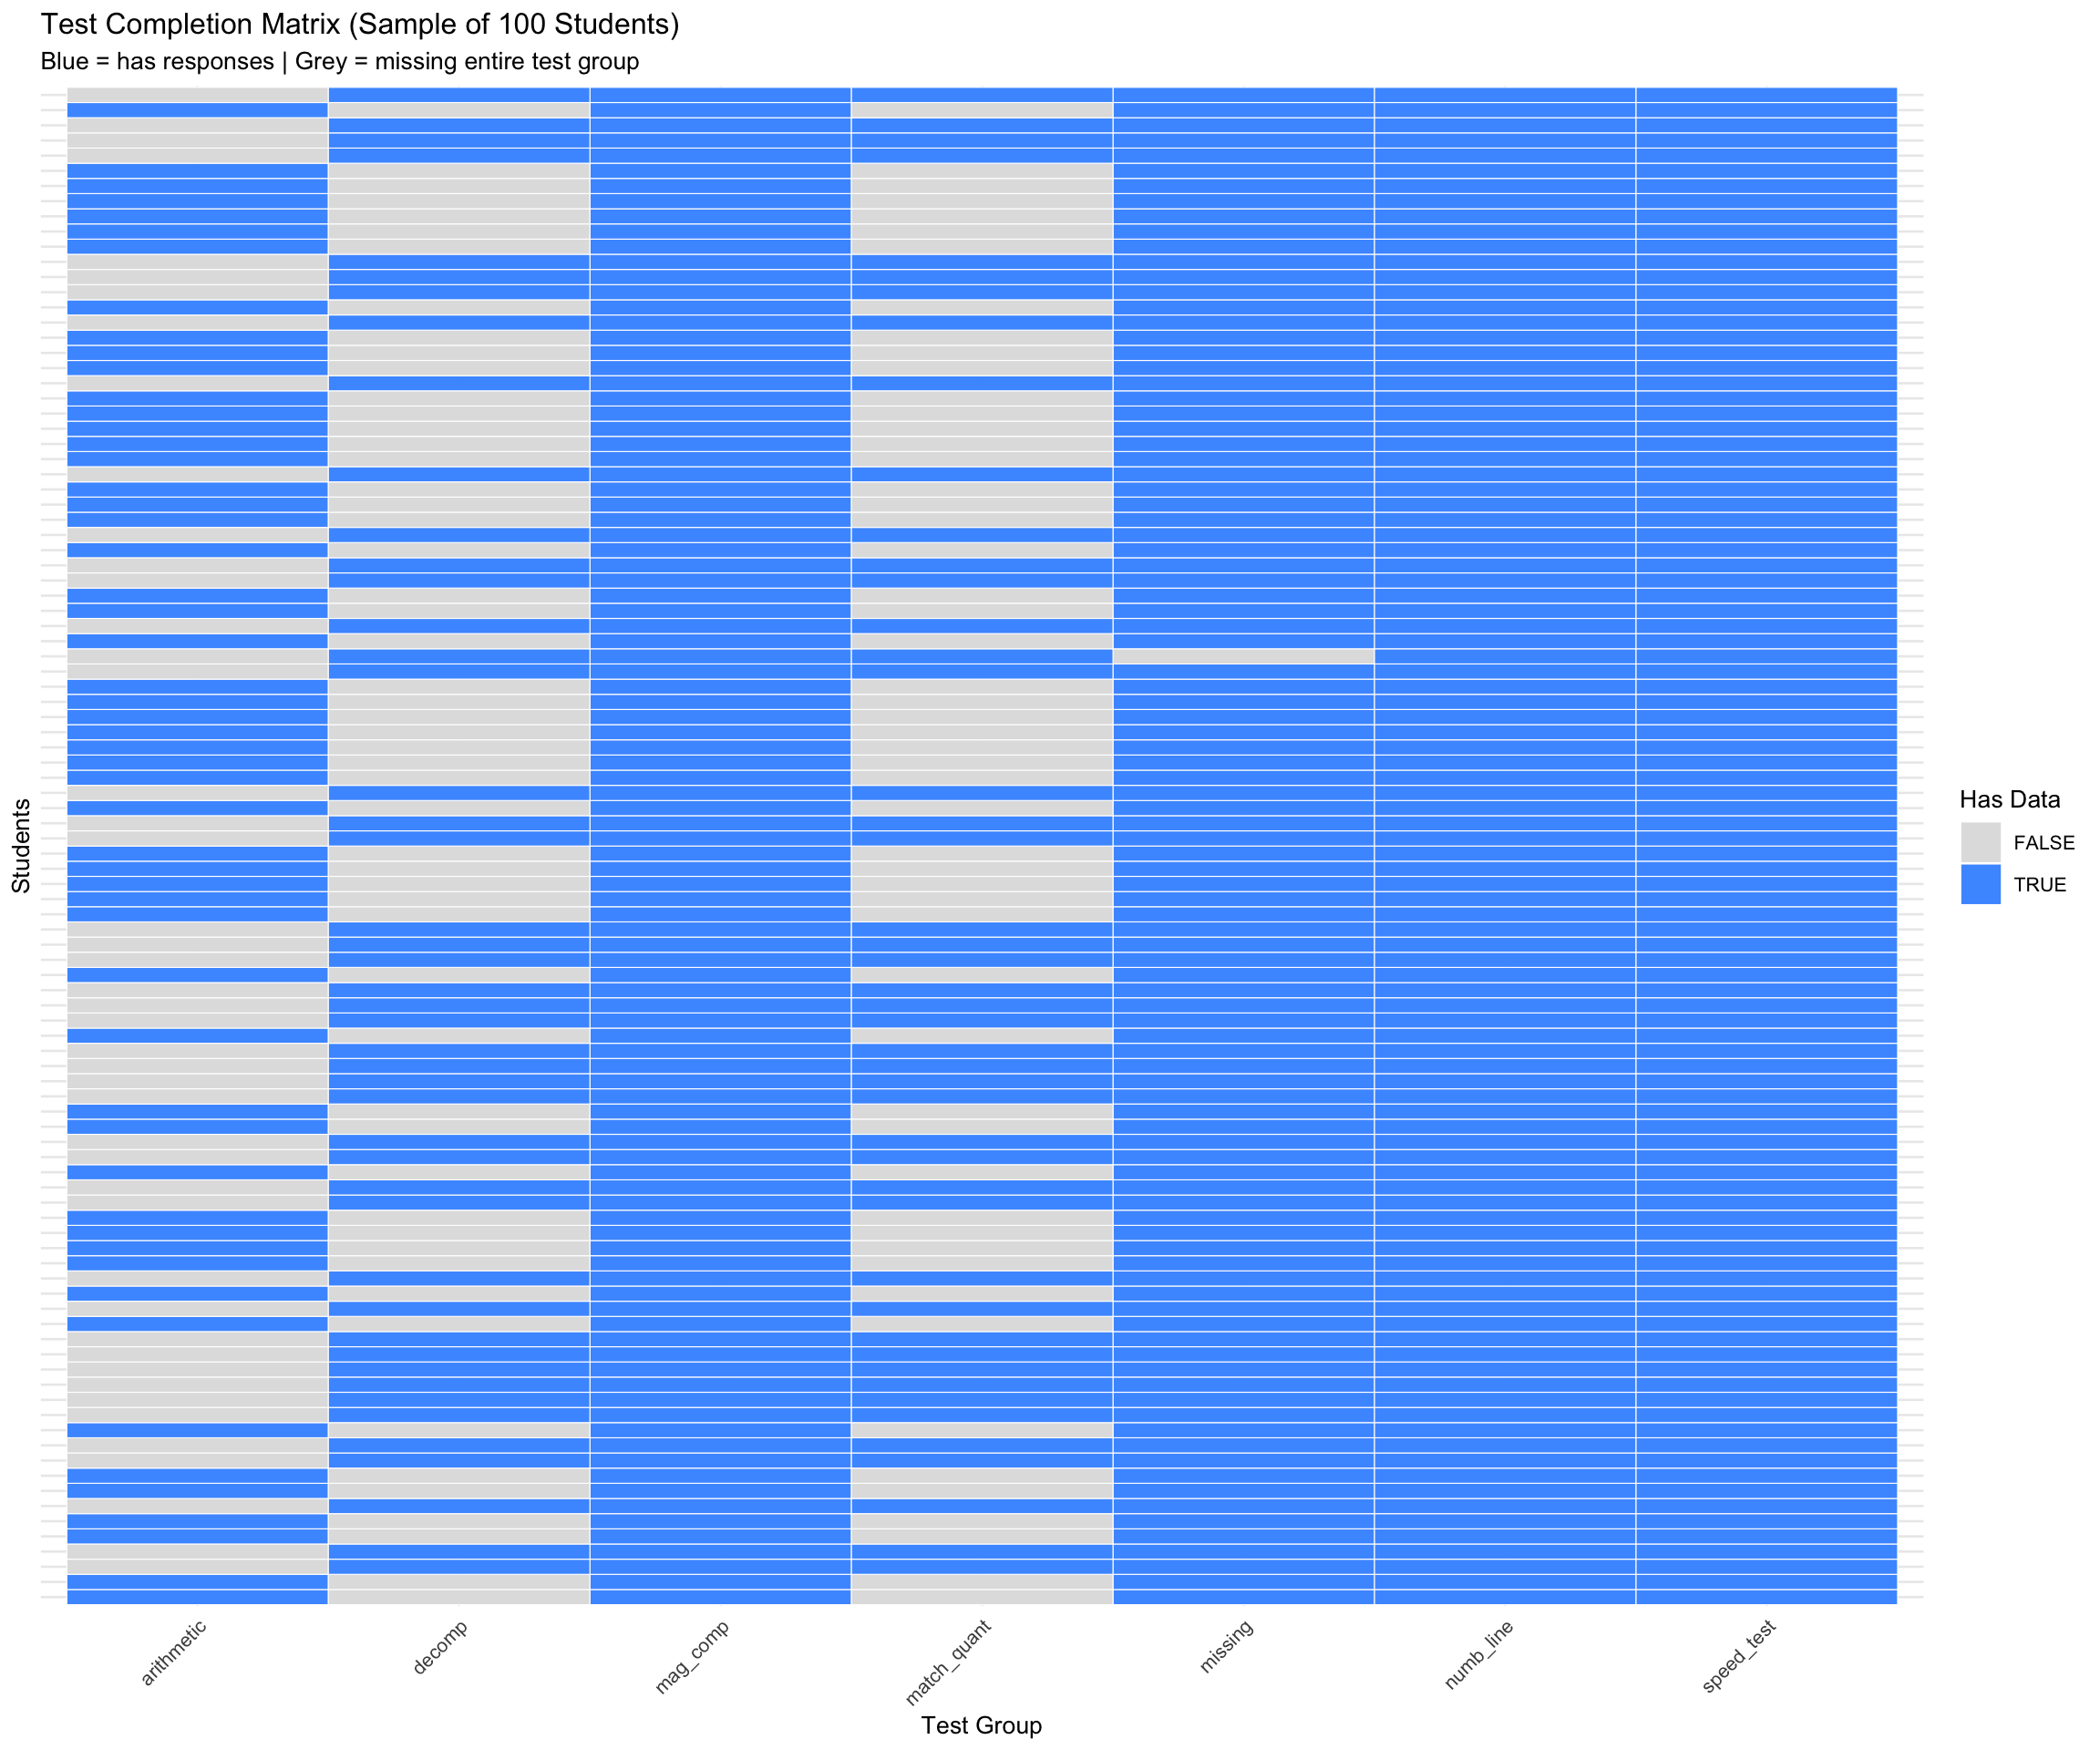
9.3 Test Completion Heatmap
10. Summary Dashboard
10.1 Key Metrics Overview
NoteDataset Summary
- Total responses: 2,247,811
- Unique students: 6,362
- After standard filtering: 852,082 responses
- Missing raw_score: 40.1%
TipPerformance Highlights
- Median accuracy (filtered): 100.0%
- Cross-test correlation range: Moderate to strong correlations between test groups
- Growth T1→T3: Positive growth observed across most test groups and cohorts
WarningData Quality Notes
- Number-line calibration issues cause ~800k NA values in raw_score
- Extreme RT outliers present (< 0.3s and > 60s) - consider filtering
- Some students show patterns consistent with disengagement or random responding
10.2 Flagged Records for Follow-up
| Flag Type | Detail | # Records/Students |
|---|---|---|
| Accuracy Pattern | 0% accuracy (10+ items) | 22 |
| Accuracy Pattern | 100% accuracy (20+ items) | 5,277 |
| Accuracy Pattern | ~25% accuracy (random 4-choice?) | 108 |
| Accuracy Pattern | ~50% accuracy (random 2-choice?) | 207 |
| RT Outlier | Too fast (<0.3s) | 60 |
| RT Outlier | Too slow (>60s) | 2,411 |
Report generated: 2026-06-13 18:15:58.528934