| Term | Year Level | Students with STPM | Total Students | Coverage (%) | Items (min/median/max) |
|---|---|---|---|---|---|
| Term 1 | Foundation | 2504 | 2517 | 99.5 | 1 / 20 / 20 |
| Term 1 | Year 1 | 2432 | 2435 | 99.9 | 1 / 20 / 20 |
| Term 3 | Foundation | 1447 | 1449 | 99.9 | 1 / 9 / 9 |
| Term 3 | Year 1 | 1505 | 1510 | 99.7 | 1 / 9 / 9 |
| Term 4 | Foundation | 1097 | 1099 | 99.8 | 1 / 9 / 9 |
| Term 4 | Year 1 | 1067 | 1070 | 99.7 | 1 / 9 / 9 |
Speed Test Picture Match (STPM) - 2025
1. Task Description
- STPM (Speed Test Picture Match) is a brief pre-test warm-up that captures baseline responding speed. Students tap the matching picture as quickly as possible across a series of simple visual matching items.
- Baseline timed responding: Establishes a student’s general speed of responding to timed items before substantive assessment begins
- Warm-up function: Typically administered first or second in the battery to help students settle into the testing environment
- Processing speed indicator: Captures general timed responding speed / processing-speed-plus-attention
- Not a pure motor measure: Research and data analysis below shows non-trivial correlation with maths performance, suggesting STPM captures more than just device familiarity
2. Data & Scoring Conventions
Filters Applied
- Attempted only:
is_attempted == TRUE - Exclude practice:
is_practice != TRUE - Exclude ABR forms:
is_abr == FALSE
Response Time Handling
- Floor at 0.5s: Applied before log transform to avoid log(0) issues
- Pause exclusion: Items with RT >60s excluded from speed calculations (retained for accuracy)
- Medians used: Robust to outliers, no hard cap needed for main statistics
- Log transform: Used for distributions and correlations to reduce skew
Metrics Reported
| Metric | Description |
|---|---|
median_rt_sec |
Median response time per item (seconds) |
rcpm |
Responses Correct Per Minute |
accuracy |
Proportion correct (should be near-ceiling for STPM) |
log_median_rt |
Log-transformed median RT for correlations |
3. Coverage & Administration
NoteItem Counts by Term
STPM item counts differ across terms:
- Term 1: Typically 20 items (full battery)
- Terms 3 & 4: Typically 9 items (reduced battery)
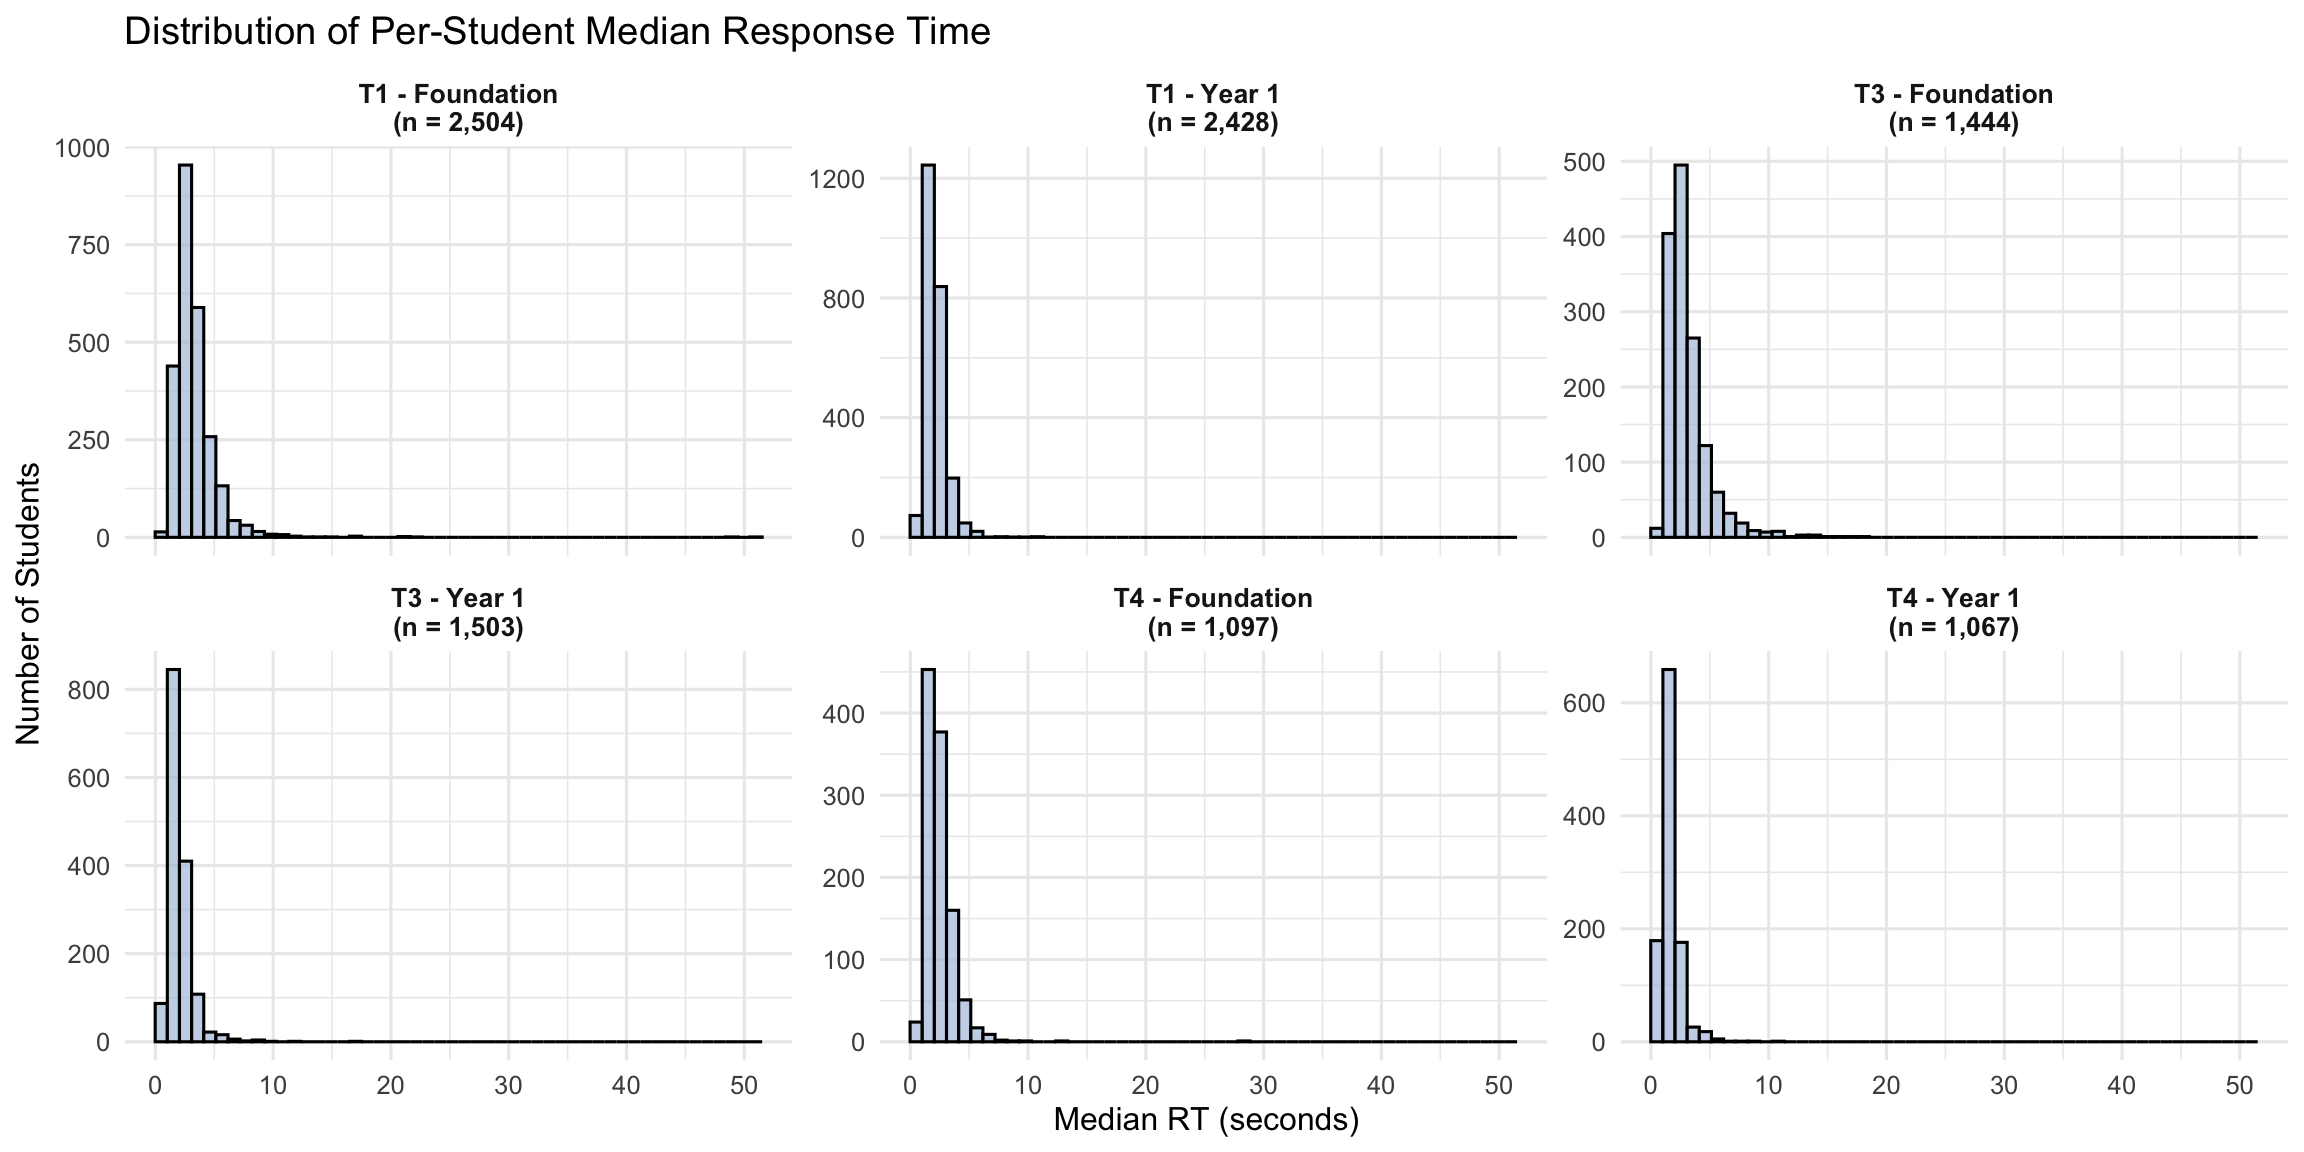
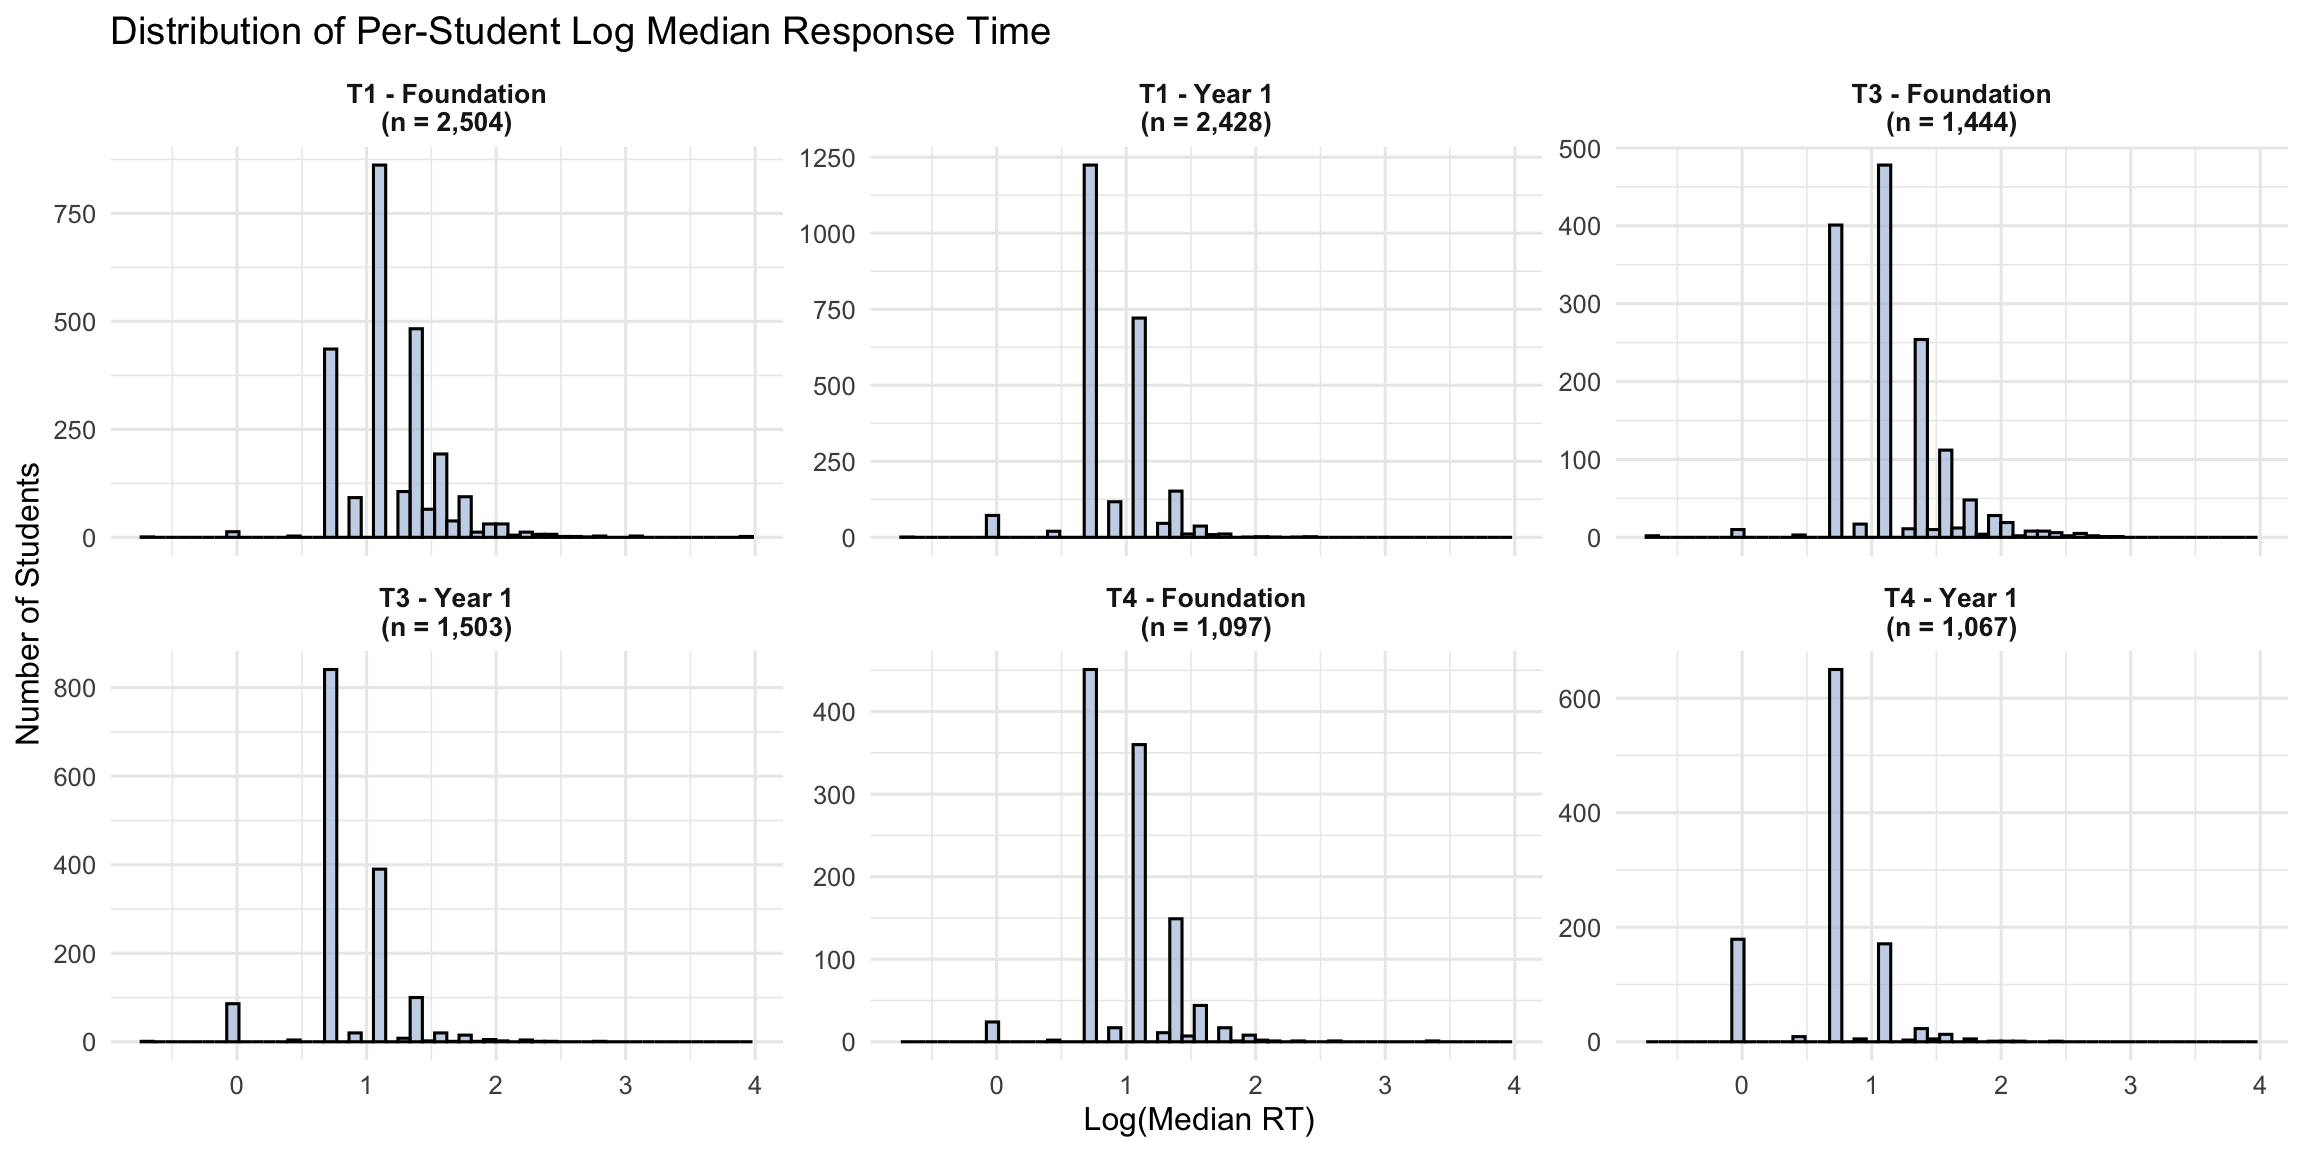
4. STPM Distributions
4.1 Histograms of Per-Student Median RT
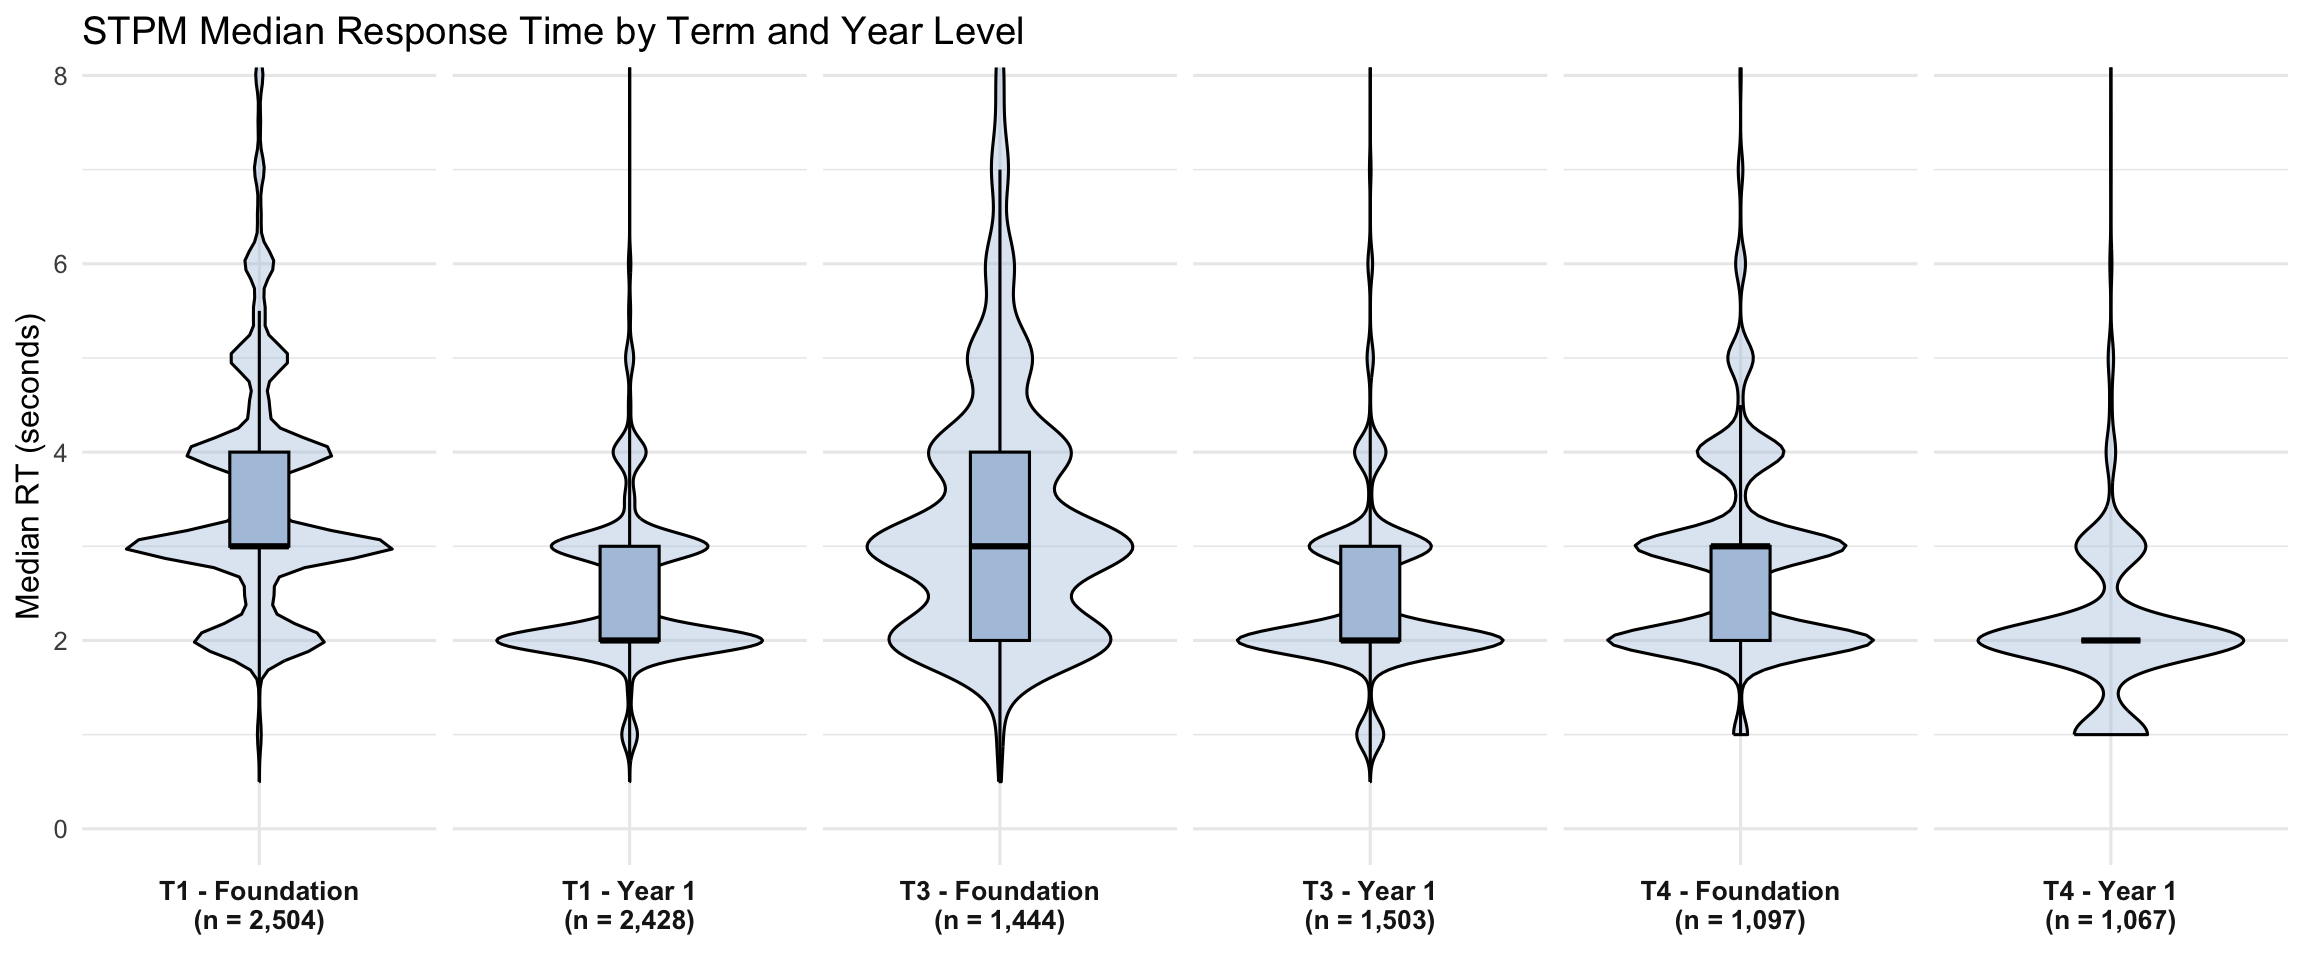
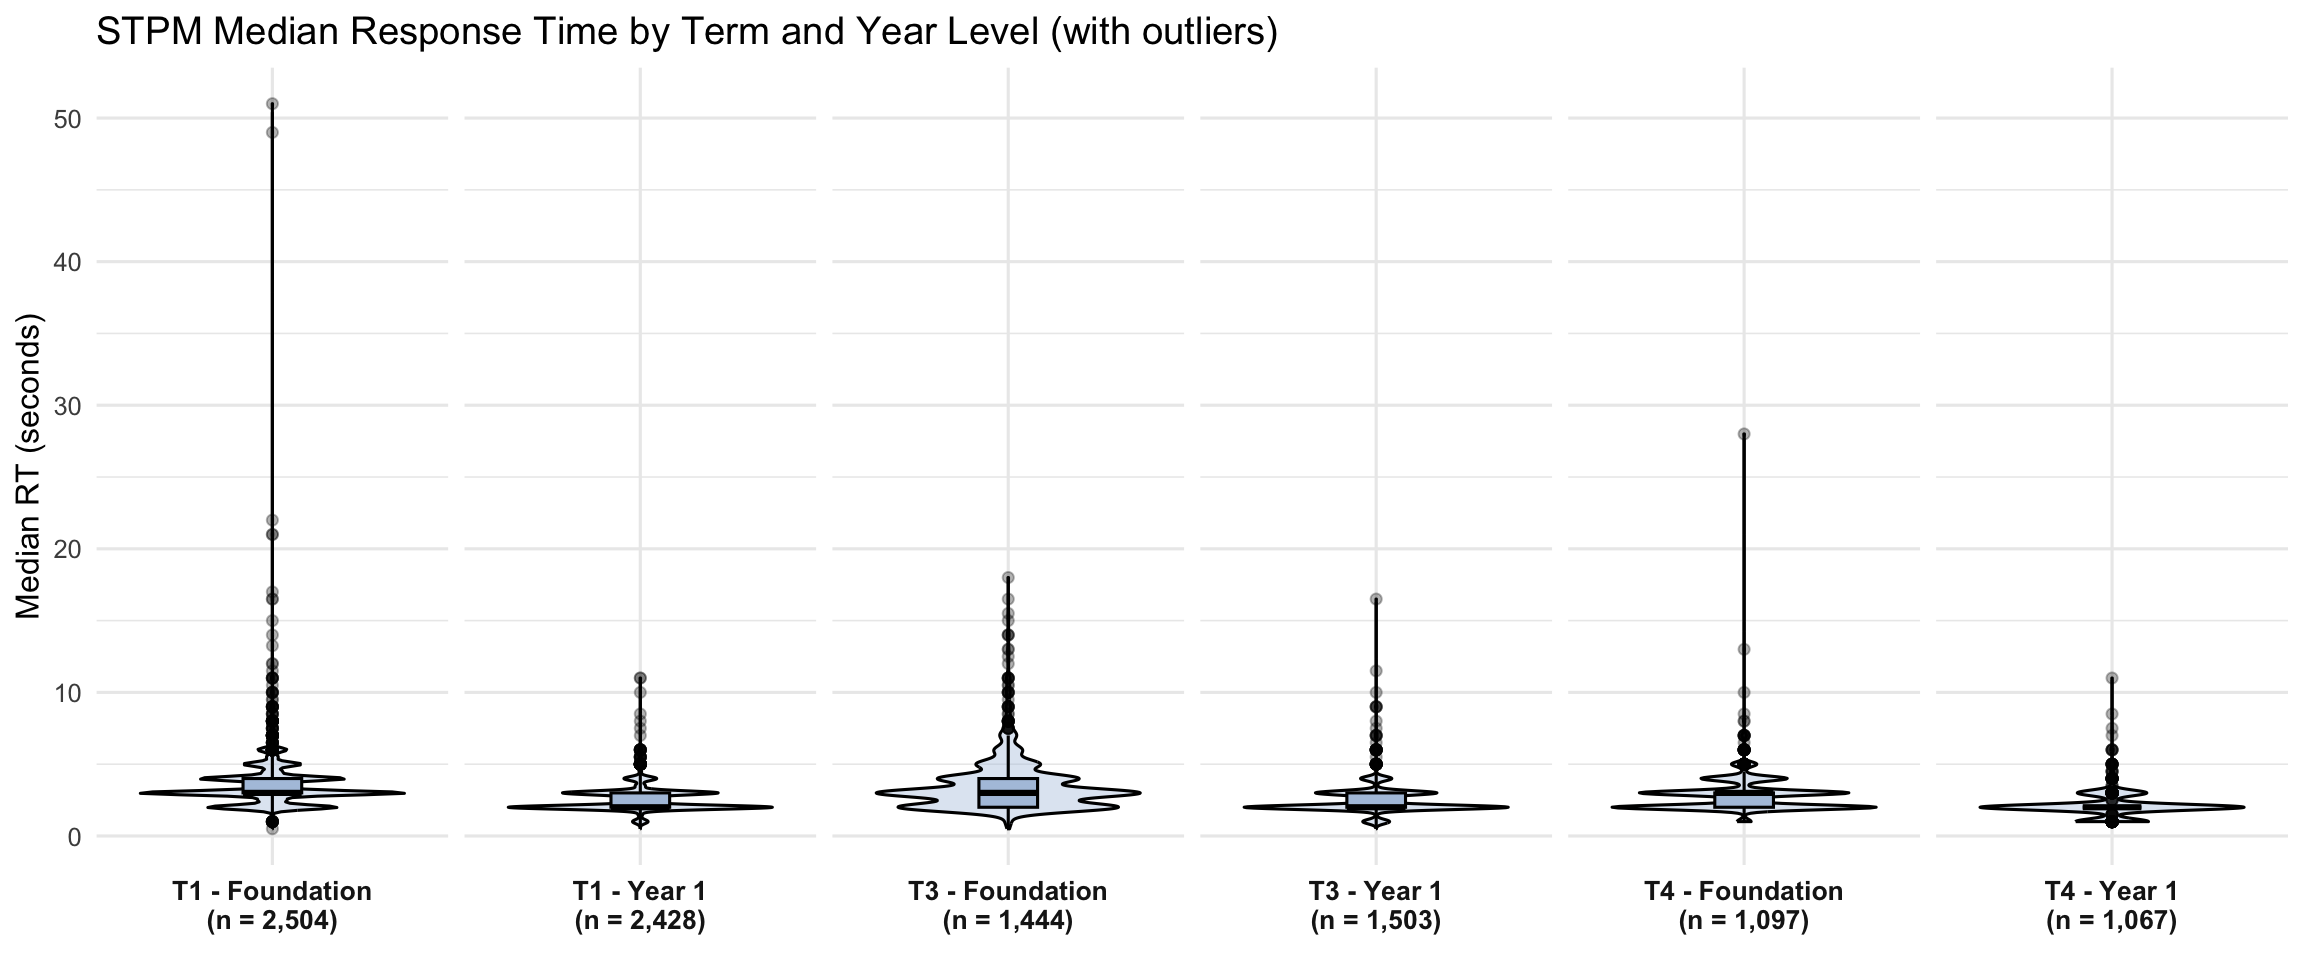
4.2 Violin + Boxplots
4.3 Extreme Pause Summary
| Term | Year Level | N | p50 | p75 | p90 | p95 | p99 | % with any item >30s | % with any item >60s |
|---|---|---|---|---|---|---|---|---|---|
| Term 1 | Foundation | 2504 | 3 | 4 | 5.0 | 6 | 10.0 | 26.4 | 10.7 |
| Term 1 | Year 1 | 2432 | 2 | 3 | 3.5 | 4 | 5.5 | 22.2 | 8.4 |
| Term 3 | Foundation | 1447 | 3 | 4 | 5.5 | 7 | 11.0 | 24.7 | 7.6 |
| Term 3 | Year 1 | 1505 | 2 | 3 | 4.0 | 4 | 6.0 | 13.9 | 2.5 |
| Term 4 | Foundation | 1097 | 3 | 3 | 4.0 | 5 | 7.0 | 17.7 | 3.7 |
| Term 4 | Year 1 | 1067 | 2 | 2 | 3.0 | 3 | 5.0 | 16.2 | 6.8 |
NoteUnderstanding the Metrics
Percentile columns (p50-p99): These show the distribution of each student’s median RT across their STPM items. For example, p90 = 4.5s means 10% of students have a median item RT above 4.5 seconds.
Pause columns: These show the percentage of students with any single item exceeding the threshold. A student can have a median RT of 2 seconds but still have one 35-second pause—medians are resistant to outliers.
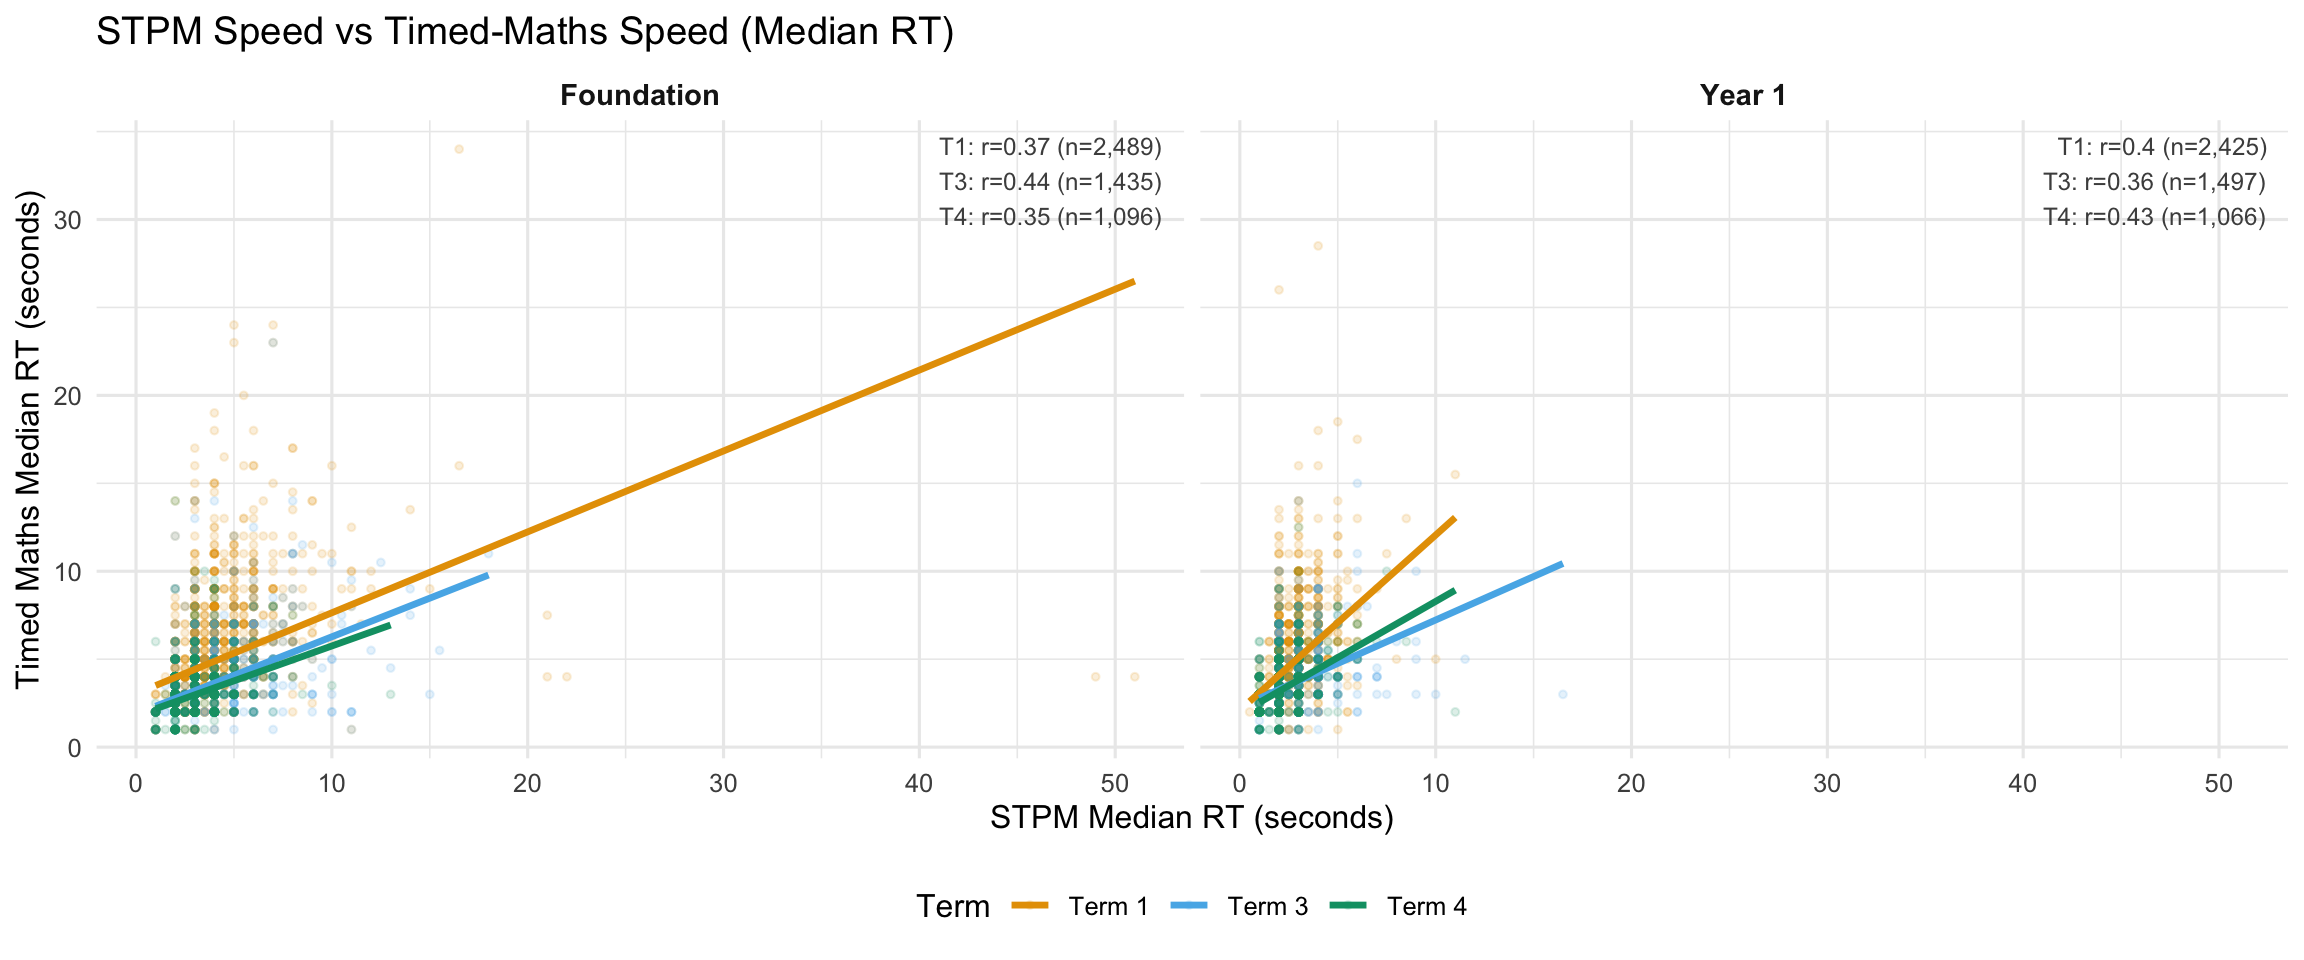
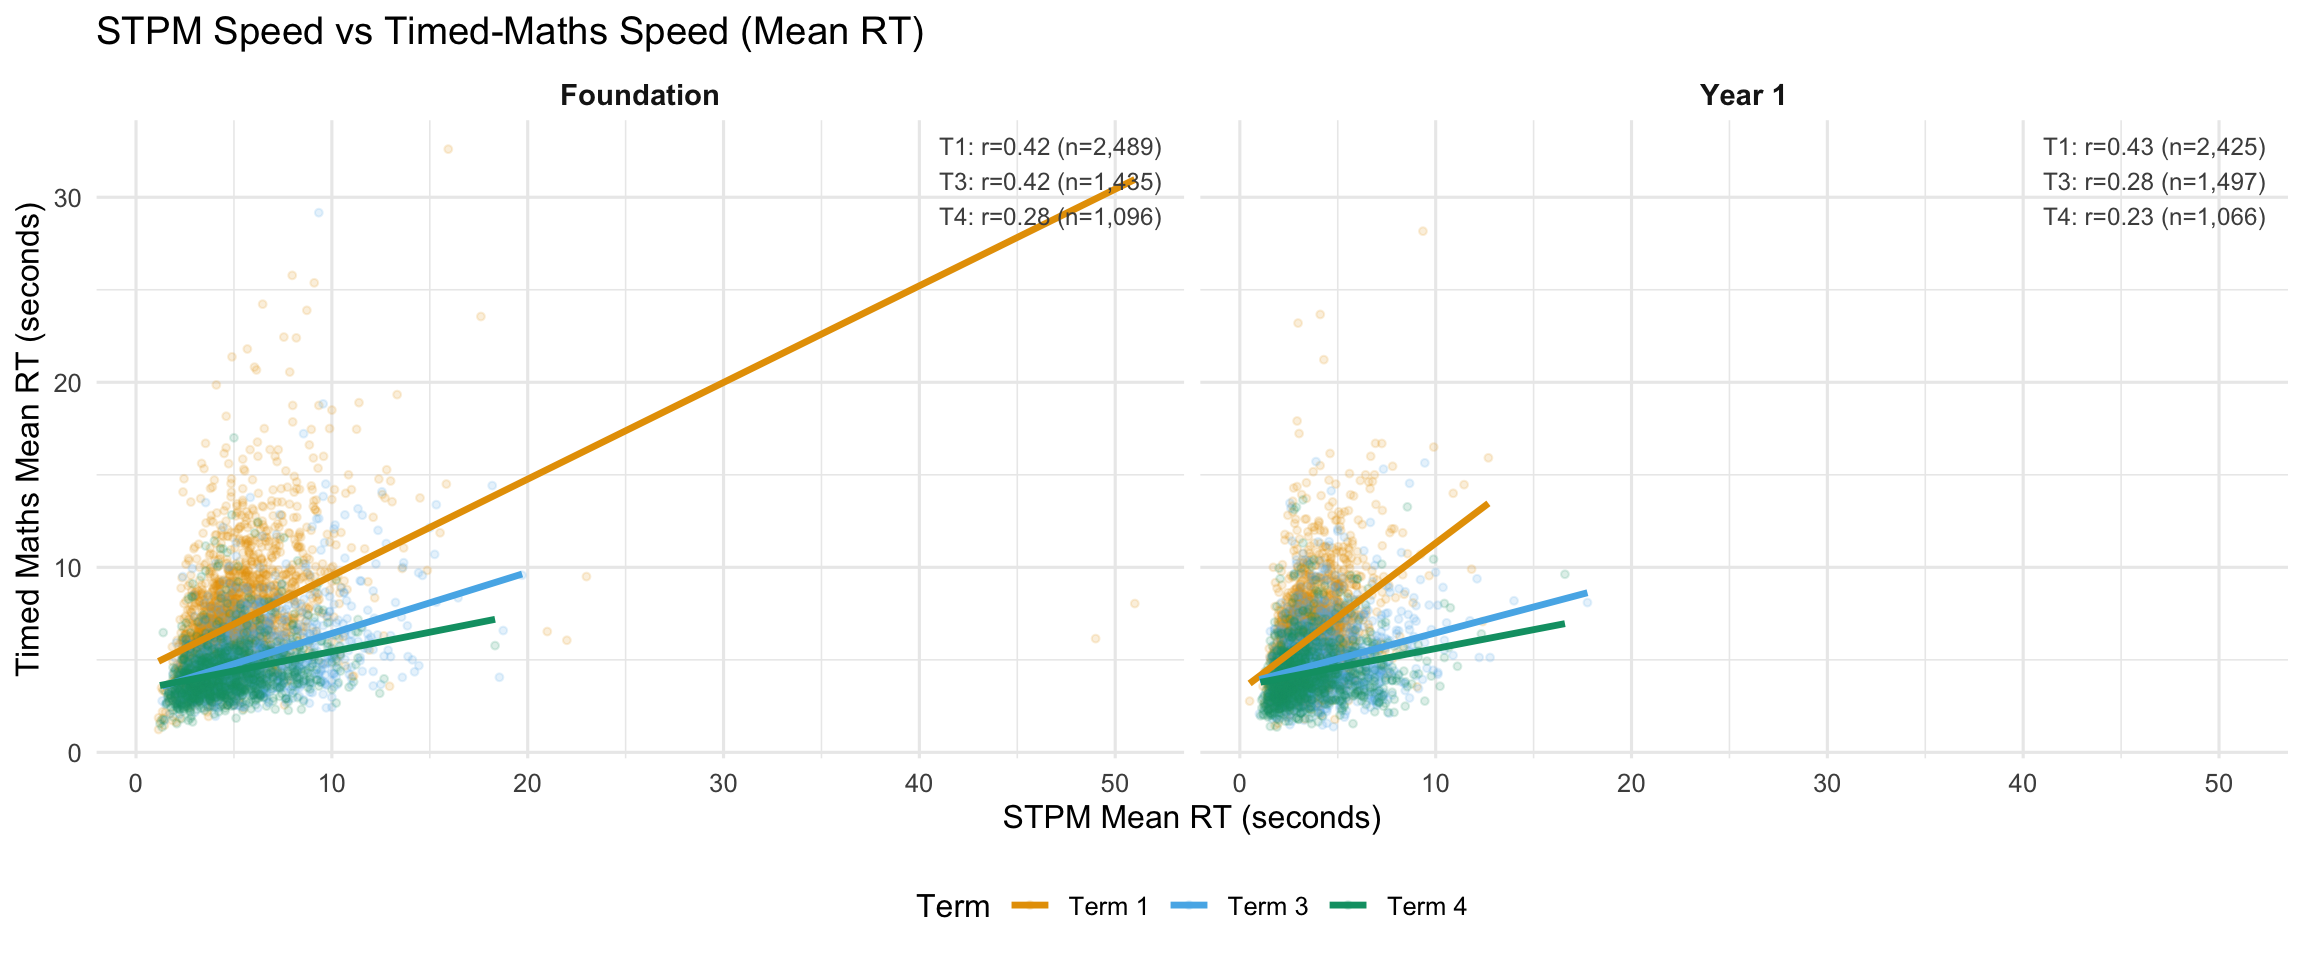
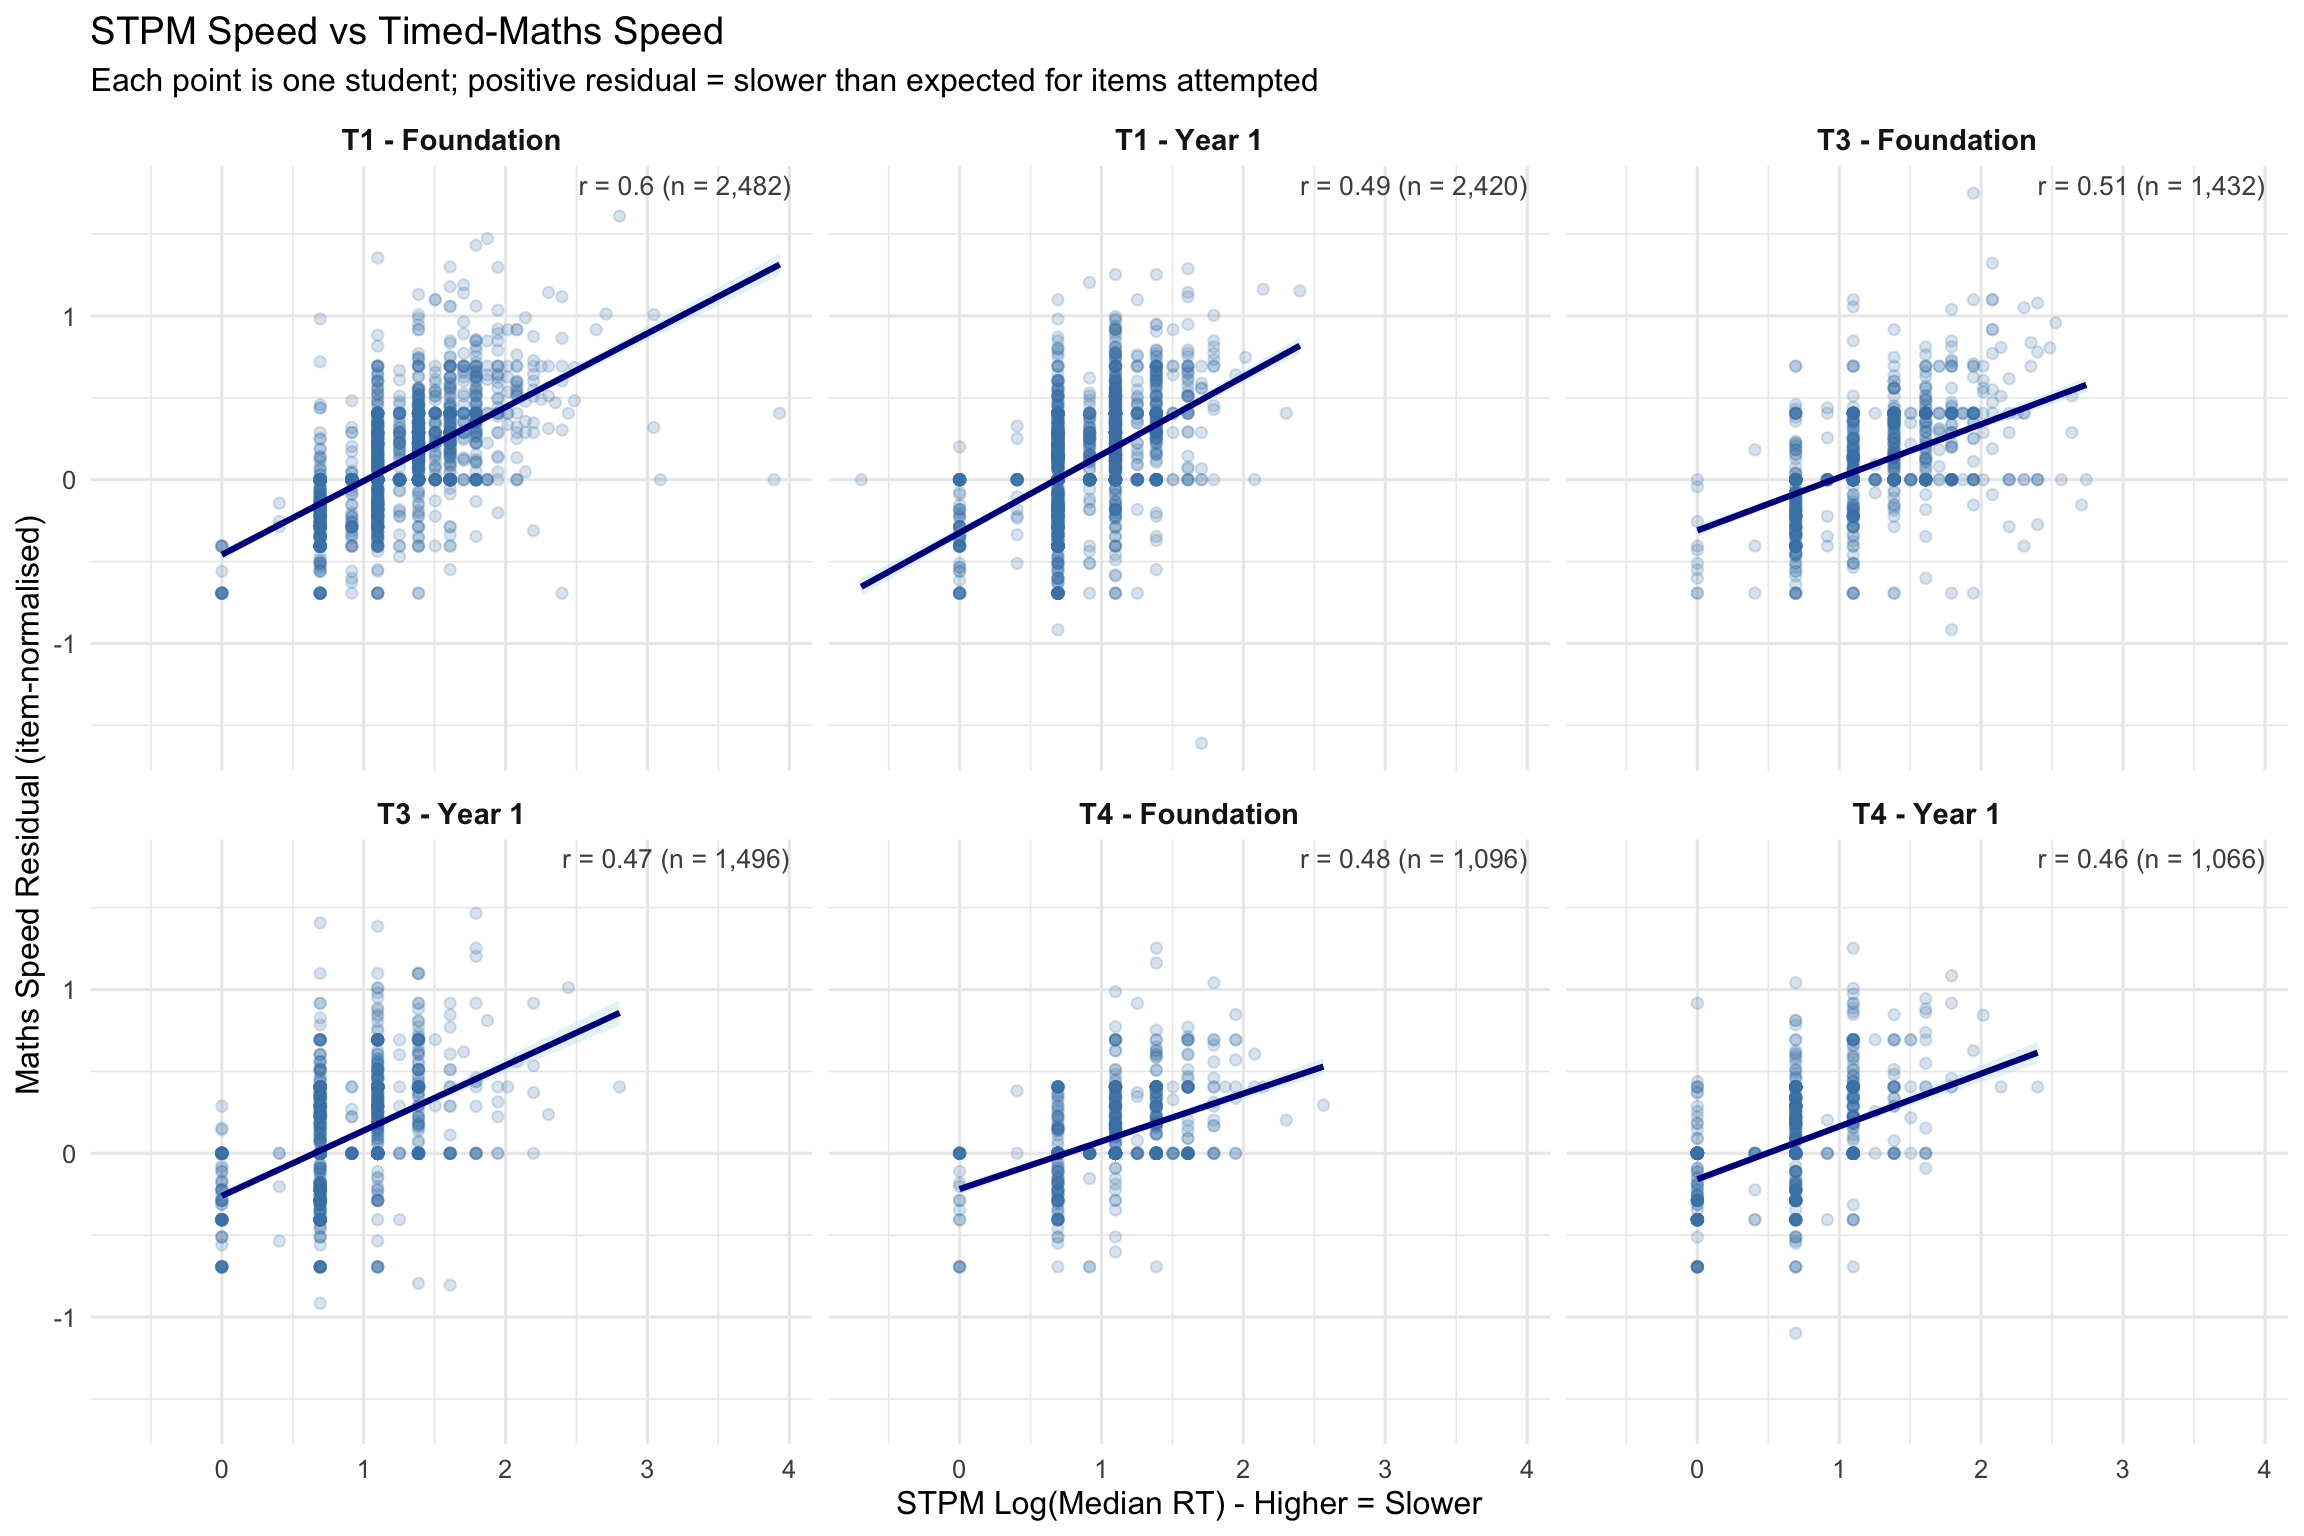
4.4 STPM Speed vs Timed-Maths Speed
This section examines the relationship between STPM responding speed and responding speed on timed maths tasks. A strong correlation would indicate that STPM captures a general responding speed factor that transfers to maths tasks.
5. Within-Test Warm-Up Effects
This section examines whether early STPM items show different response patterns compared to later items, suggesting a “settling in” period.
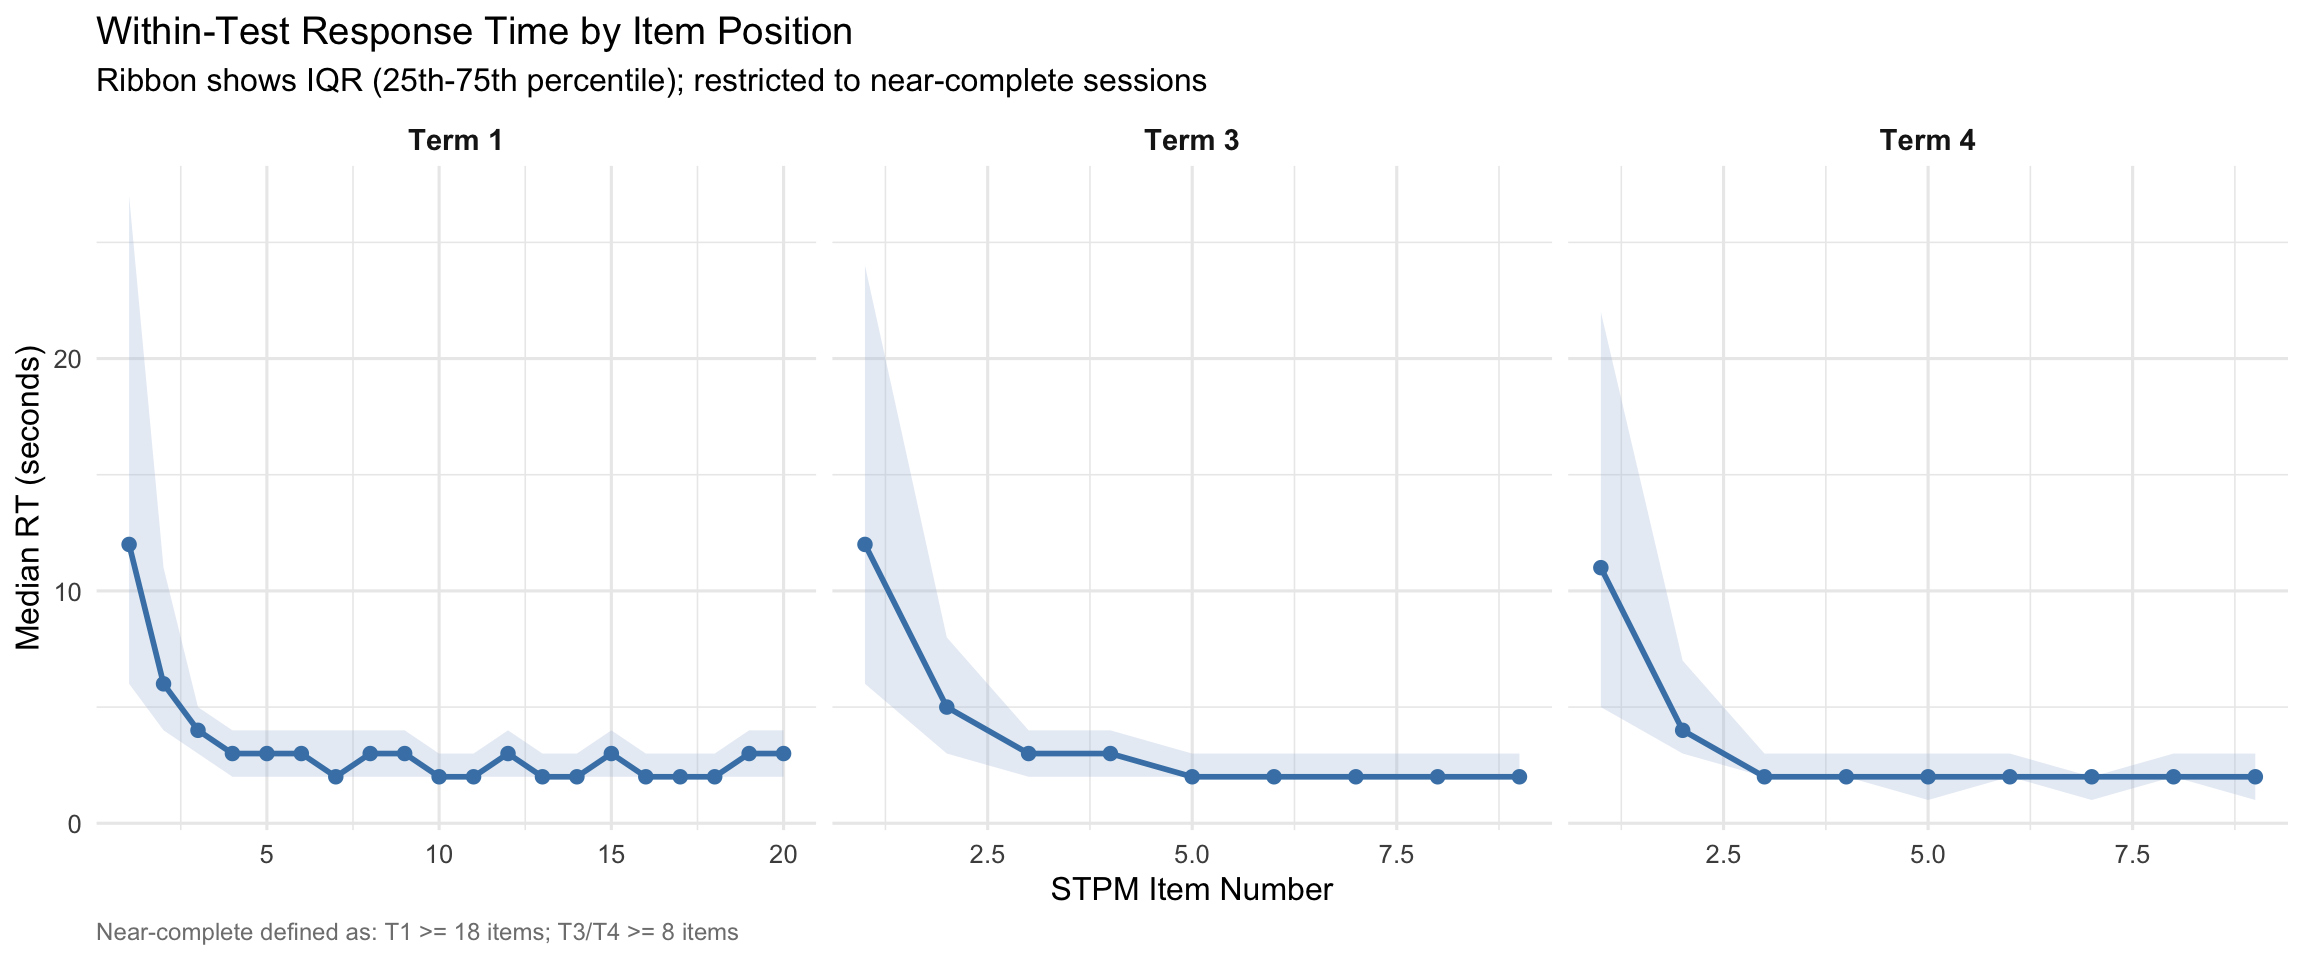
NoteWarm-Up Pattern Interpretation
- Early items (1-3) often show slightly elevated RT as students settle in
- Response times typically stabilise after the first few items
- This pattern supports placing STPM early in the battery as a warm-up
6. Reliability
This section examines whether STPM provides consistent measurement of responding speed.
Split-half reliability measures internal consistency: if we randomly split the STPM items into two halves, do they rank students similarly? High reliability (>0.80) indicates the task measures a stable characteristic rather than random noise.
Rank-order stability examines whether students who are fast/slow relative to peers at one time point remain so at another. This is NOT classical test-retest reliability, as genuine improvement over time is expected.
6.1 Split-Half Reliability
| Term | Year Level | N Students | Mean r (half) | Reliability (S-B) |
|---|---|---|---|---|
| Term 1 | Foundation | 2327 | 0.735 | 0.847 |
| Term 1 | Year 1 | 2369 | 0.684 | 0.813 |
| Term 4 | Foundation | 1085 | 0.331 | 0.497 |
| Term 4 | Year 1 | 1049 | 0.276 | 0.432 |
| Term 3 | Foundation | 1388 | 0.384 | 0.555 |
| Term 3 | Year 1 | 1482 | 0.320 | 0.484 |
| Based on 100 random splits with Spearman-Brown correction. Near-complete sessions only. |
6.2 Rank-Order Stability Across Terms
| Comparison | Year Level | N | Correlation (r) | Mean Difference (log RT) |
|---|---|---|---|---|
| T1 vs T3 | Foundation | 1296 | 0.494 | -0.088 |
| T1 vs T3 | Year 1 | 1363 | 0.461 | -0.052 |
| T3 vs T4 | Foundation | 820 | 0.432 | -0.180 |
| T3 vs T4 | Year 1 | 819 | 0.456 | -0.161 |
| Negative mean difference indicates faster responding at later term. Based on students with valid STPM at both time points. |
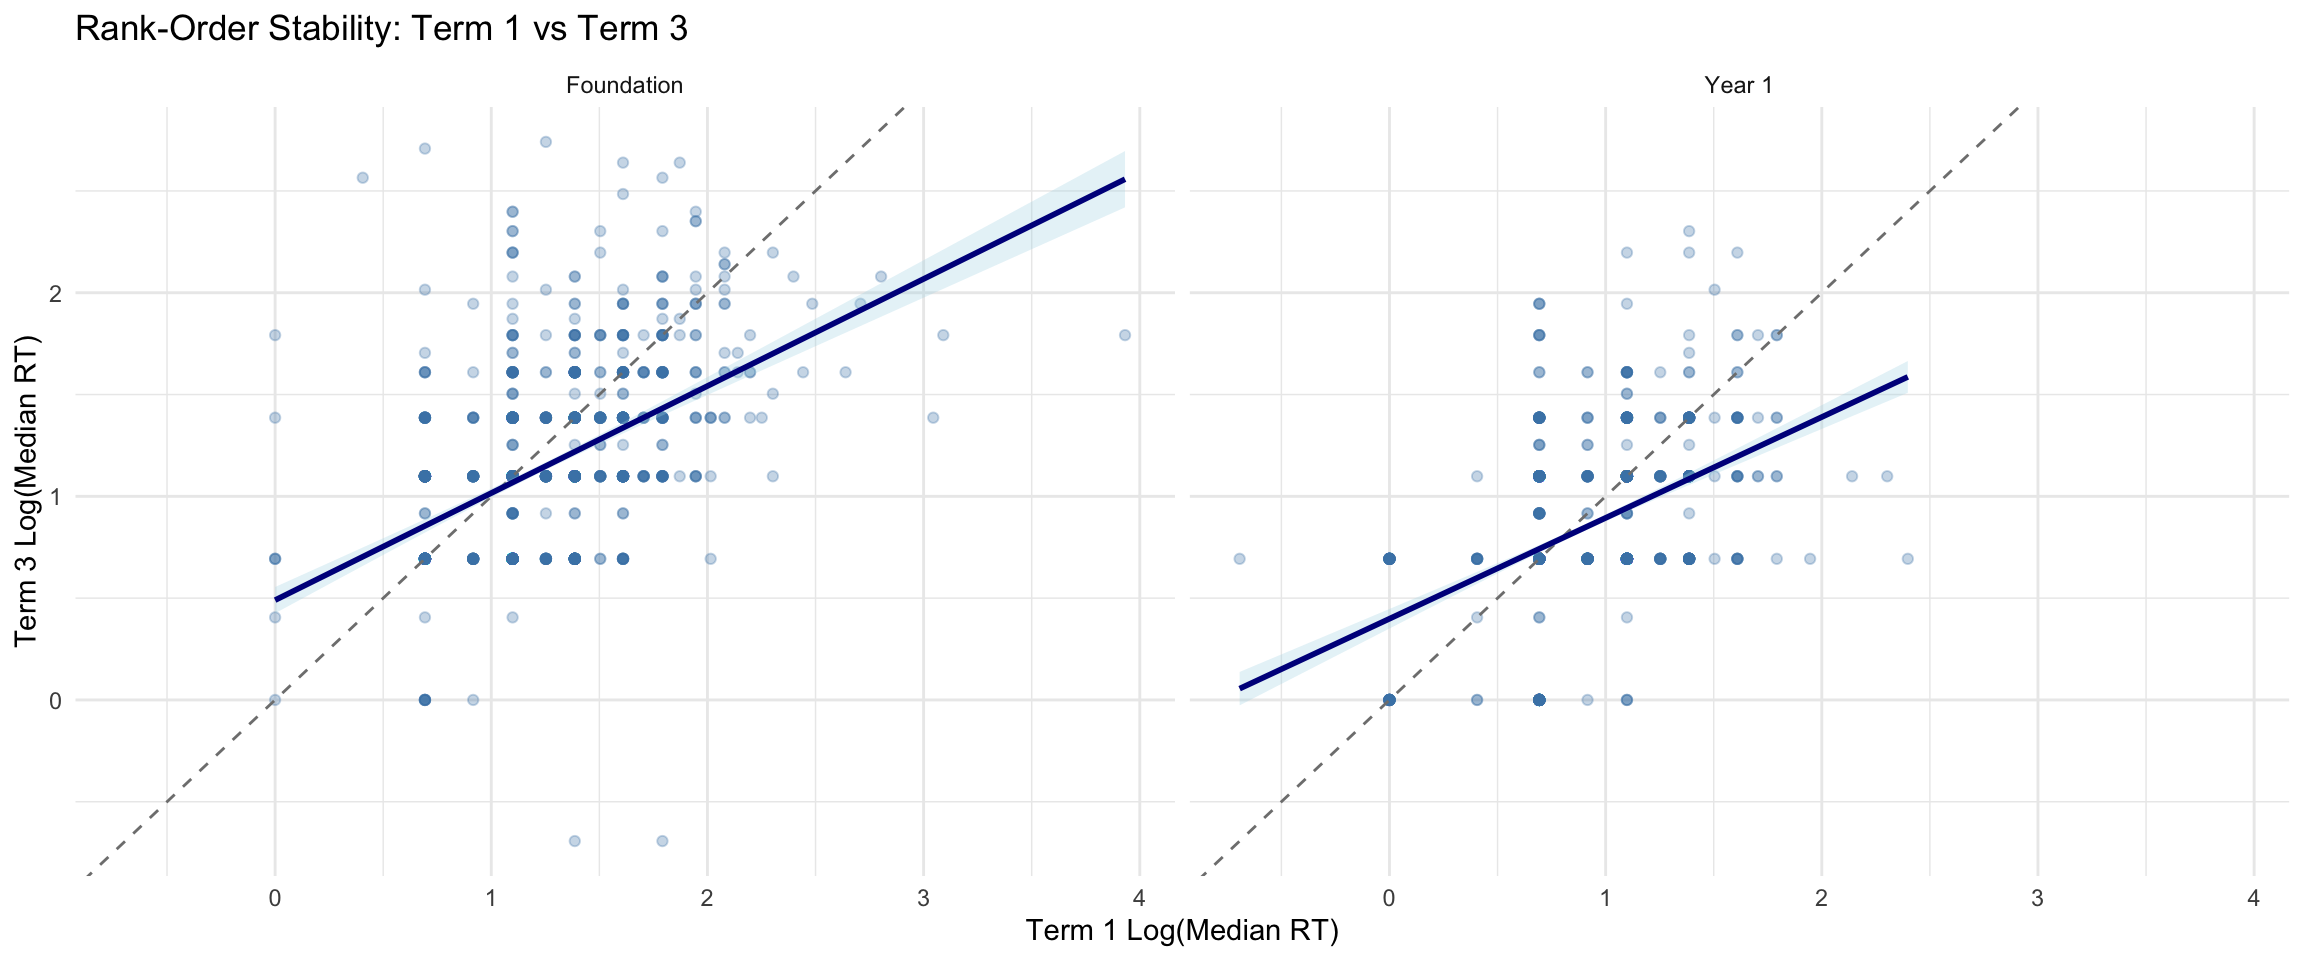
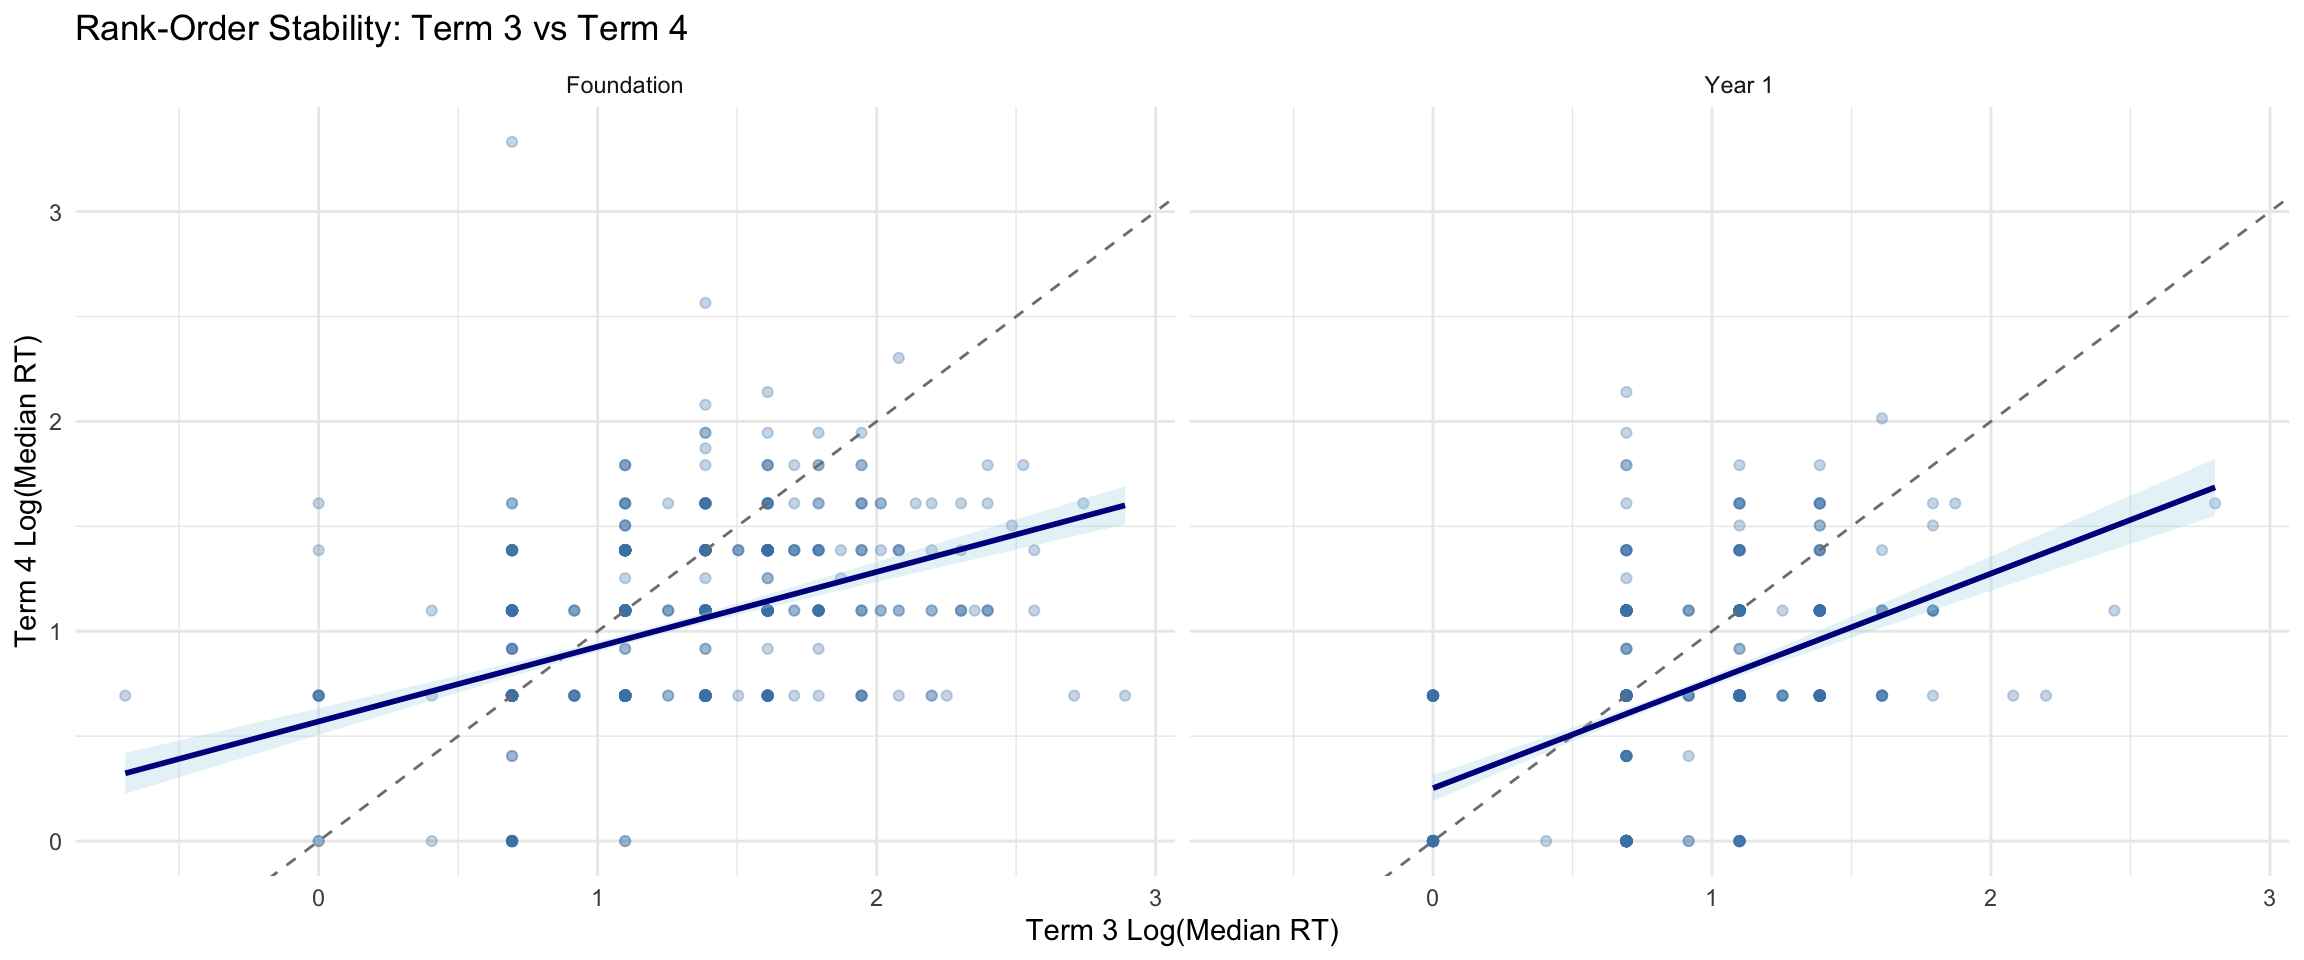
NoteStability Interpretation
- Moderate-to-strong correlations indicate rank-order stability (students who are fast/slow relative to peers tend to remain so)
- Negative mean differences reflect expected improvement over time (faster responding at later terms)
- This is not classical test-retest reliability, as genuine change is expected
7. Relationship to Maths Performance
This section examines how STPM speed relates to performance on timed maths probes.
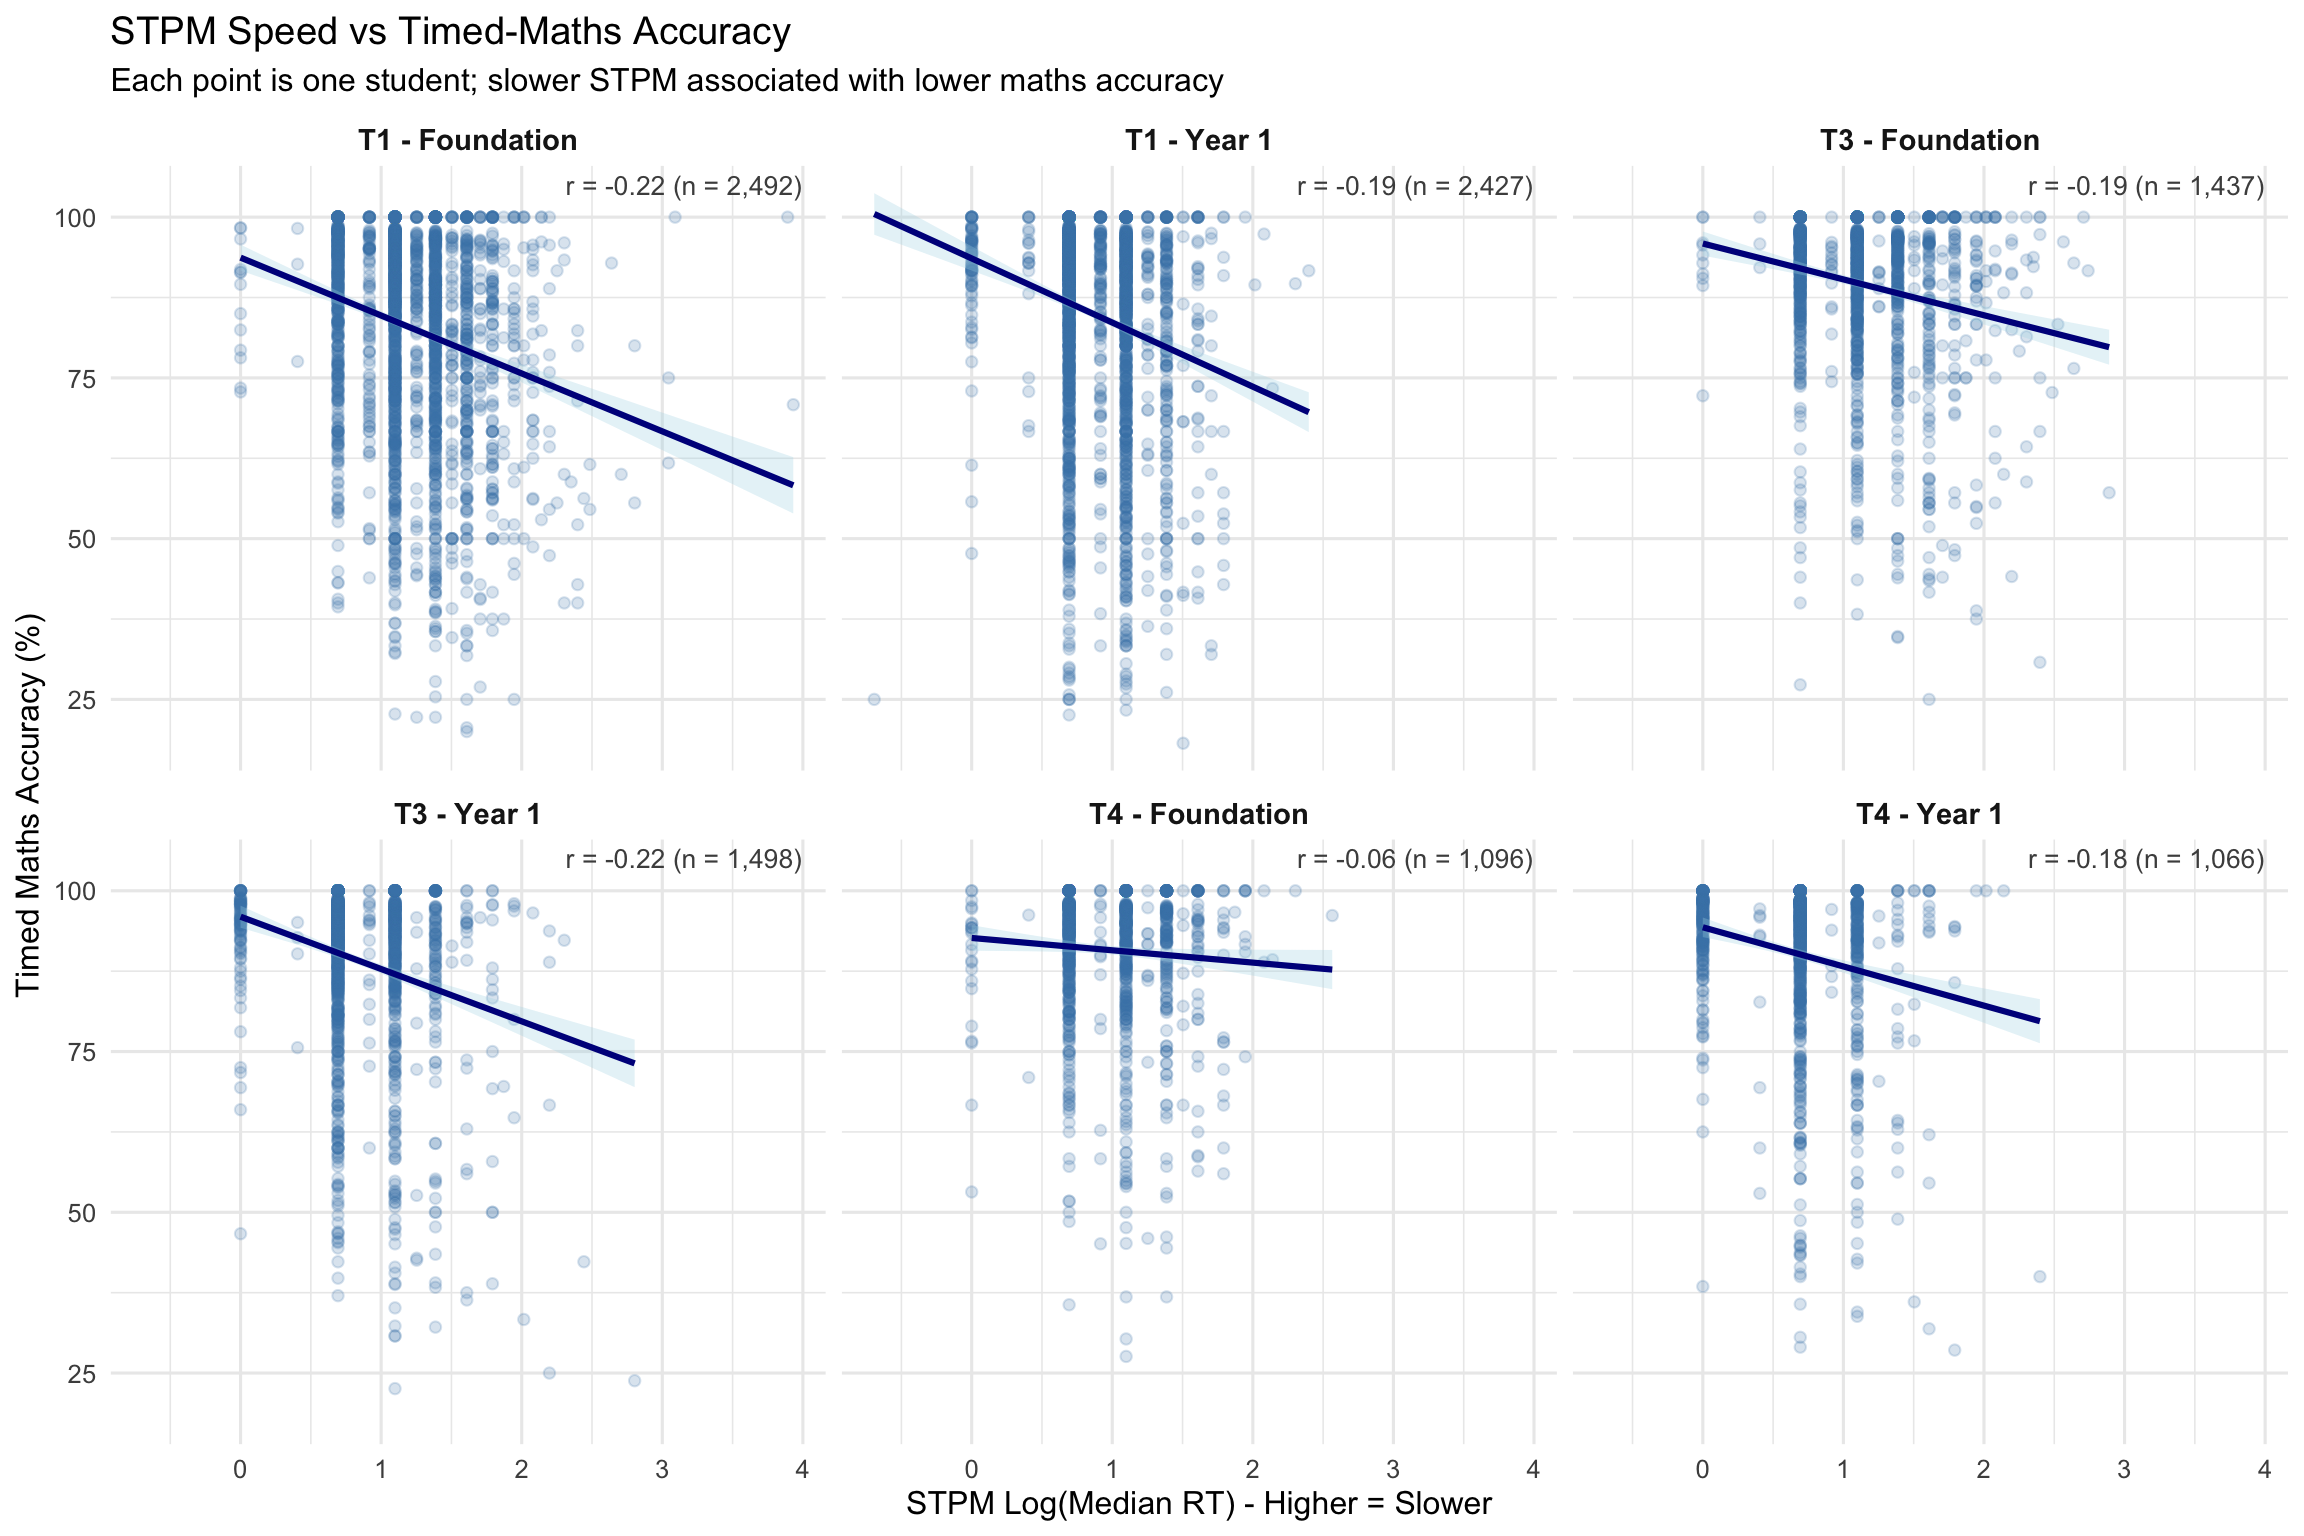
7.1 STPM Speed vs Timed-Maths Accuracy
7.2 STPM Speed vs Timed-Maths Speed
7.3 Correlation Summary by Probe Group
| Term | Year Level | Probe Group | N | r (Accuracy) | r (Speed) |
|---|---|---|---|---|---|
| Term 1 | Foundation | MC | 2482 | -0.22 | 0.52 |
| Term 1 | Foundation | MQ | 2486 | -0.08 | 0.55 |
| Term 1 | Foundation | Missing Number | 2413 | -0.21 | 0.28 |
| Term 1 | Year 1 | Arithmetic | 2362 | -0.12 | 0.46 |
| Term 1 | Year 1 | MC | 2424 | -0.18 | 0.43 |
| Term 1 | Year 1 | Missing Number | 2410 | -0.12 | 0.31 |
| Term 3 | Foundation | MC | 1431 | -0.17 | 0.48 |
| Term 3 | Foundation | MQ | 1433 | 0.02 | 0.45 |
| Term 3 | Foundation | Missing Number | 1416 | -0.20 | 0.28 |
| Term 3 | Year 1 | Arithmetic | 1491 | -0.15 | 0.41 |
| Term 3 | Year 1 | MC | 1495 | -0.21 | 0.41 |
| Term 3 | Year 1 | Missing Number | 1490 | -0.15 | 0.34 |
| Term 4 | Foundation | MC | 1092 | -0.03 | 0.37 |
| Term 4 | Foundation | MQ | 1090 | 0.00 | 0.42 |
| Term 4 | Foundation | Missing Number | 1073 | -0.10 | 0.34 |
| Term 4 | Year 1 | Arithmetic | 1064 | -0.15 | 0.34 |
| Term 4 | Year 1 | MC | 1066 | -0.18 | 0.40 |
| Term 4 | Year 1 | Missing Number | 1066 | -0.12 | 0.34 |
NoteReading the Correlations
Correlations between STPM log(RT) and task-specific metrics. Negative r with accuracy expected (slower STPM → lower accuracy). Positive r with speed expected (slower STPM → slower maths RT).
ImportantKey Finding
STPM correlates with both maths speed AND maths accuracy within each term. This is NOT just “device familiarity” - it captures processing speed relevant to fluency. This supports the research note conclusion: don’t treat STPM as pure motor.
8. “Don’t Over-Correct” Illustration
This section illustrates why mechanically residualising maths speed by STPM can change what the metric measures.
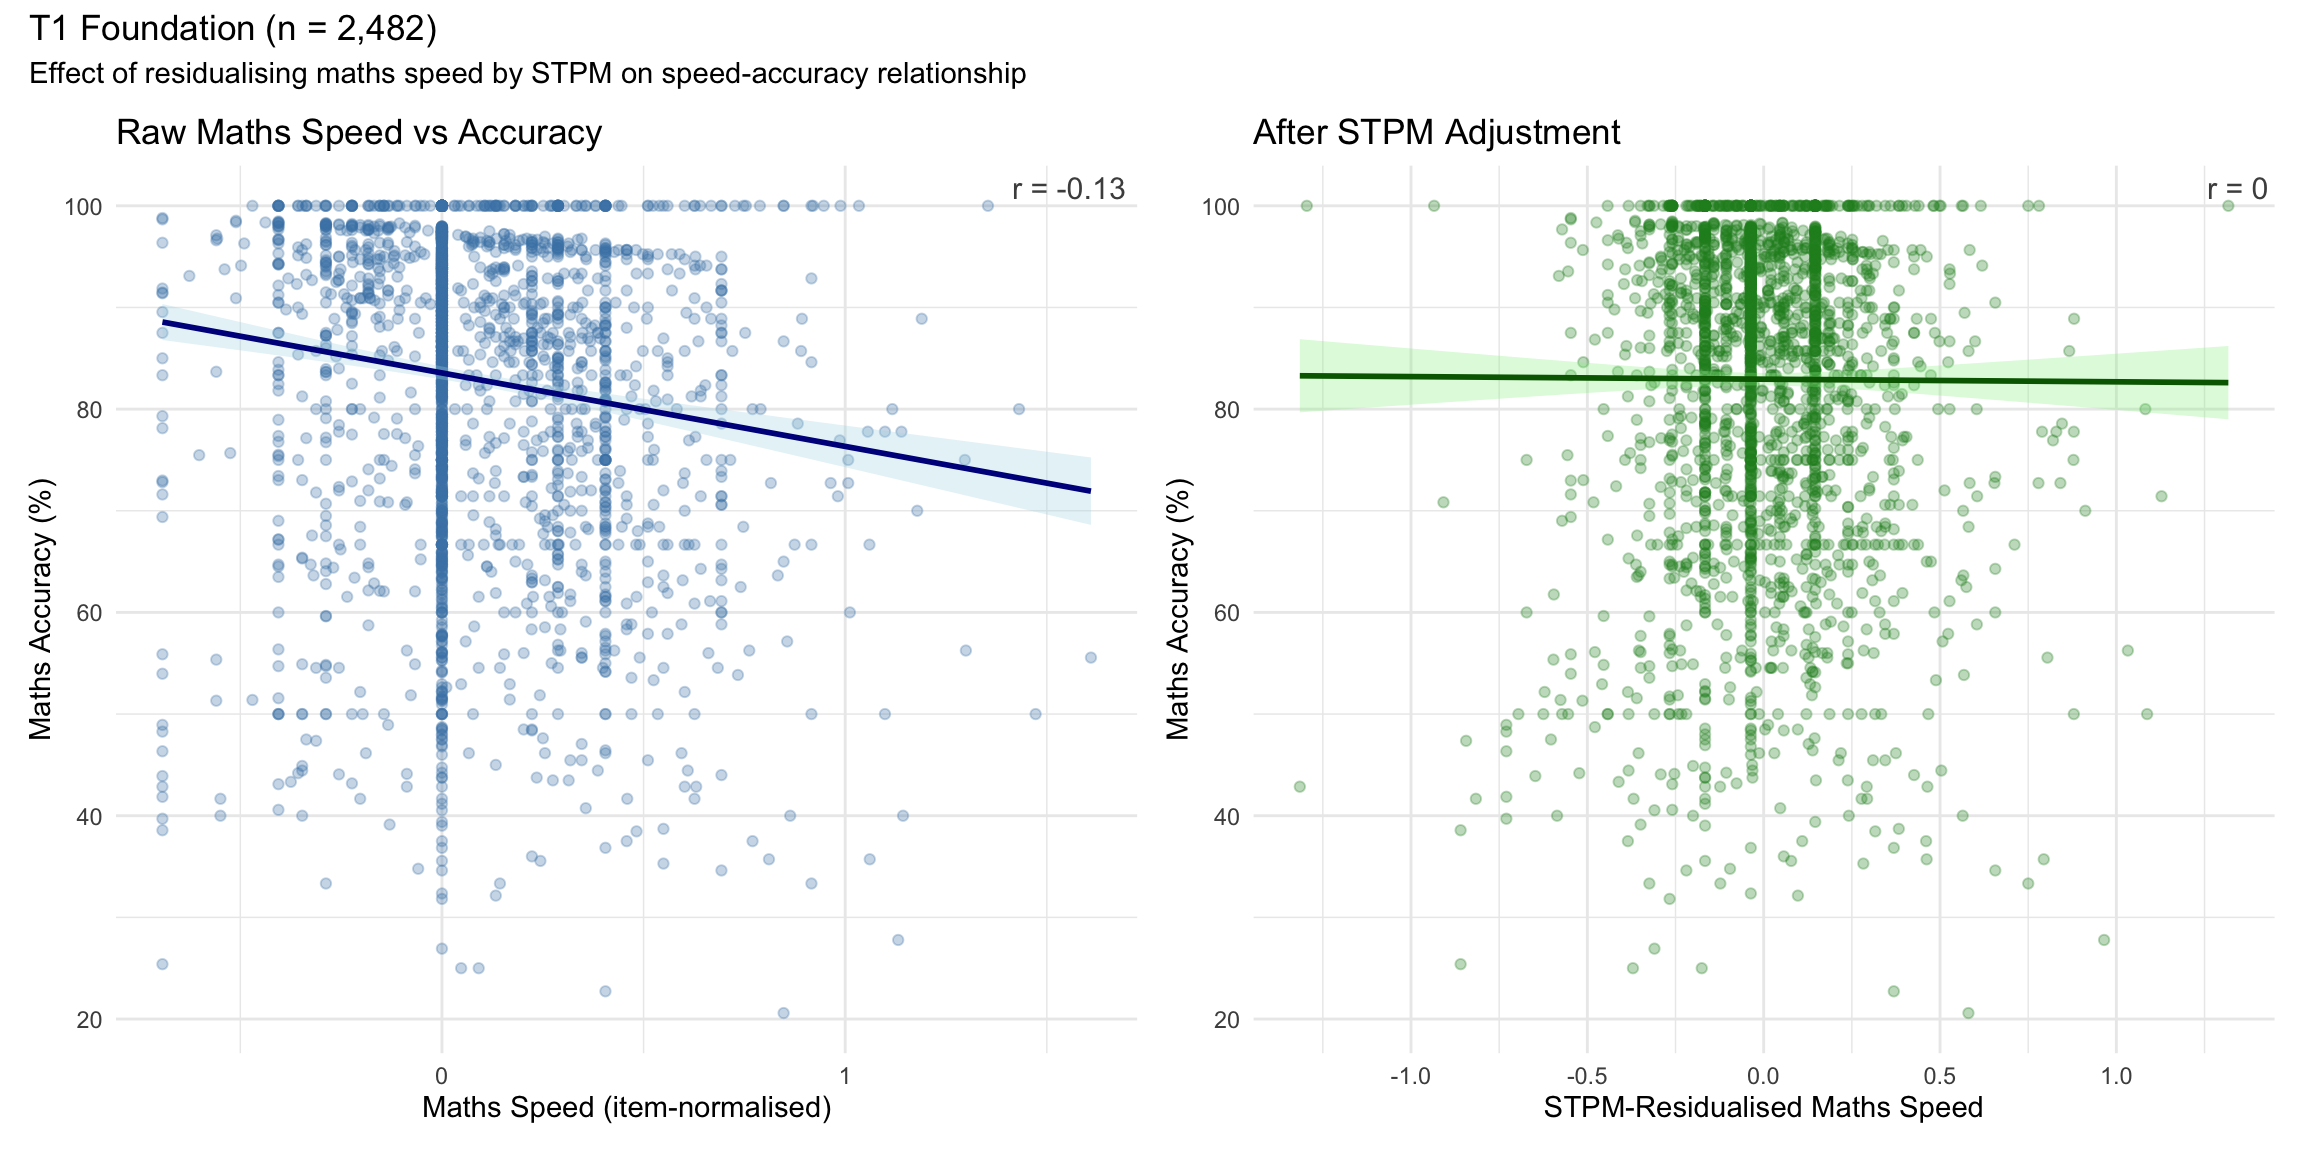
CautionInterpretation Caveat
This illustration shows correlation patterns, not causal effects.
The residualised metric is a relative speed signal, not “maths fluency net of device skill”:
- “Faster-than-expected given STPM” may reflect rushing/guessing rather than greater fluency
- The relationship between speed and accuracy may weaken or reverse after adjustment
- Mechanically subtracting STPM changes what the metric measures
Takeaway: Use STPM as context for interpretation, not as an automatic correction factor.
9. STPM Accuracy Diagnostic
STPM accuracy should be near-ceiling for most students. Low accuracy may indicate:
- Misunderstanding of the task
- Attention or engagement issues
- Possible validity concerns for the session
| Term | Typical Items | Threshold | Interpretation |
|---|---|---|---|
| T1 | 20 | <0.9 | >=3 errors |
| T1 | 20 | <0.8 | >=5 errors |
| T3/T4 | 9 | <0.9 | >=2 errors |
| T3/T4 | 9 | <0.8 | >=2 errors |
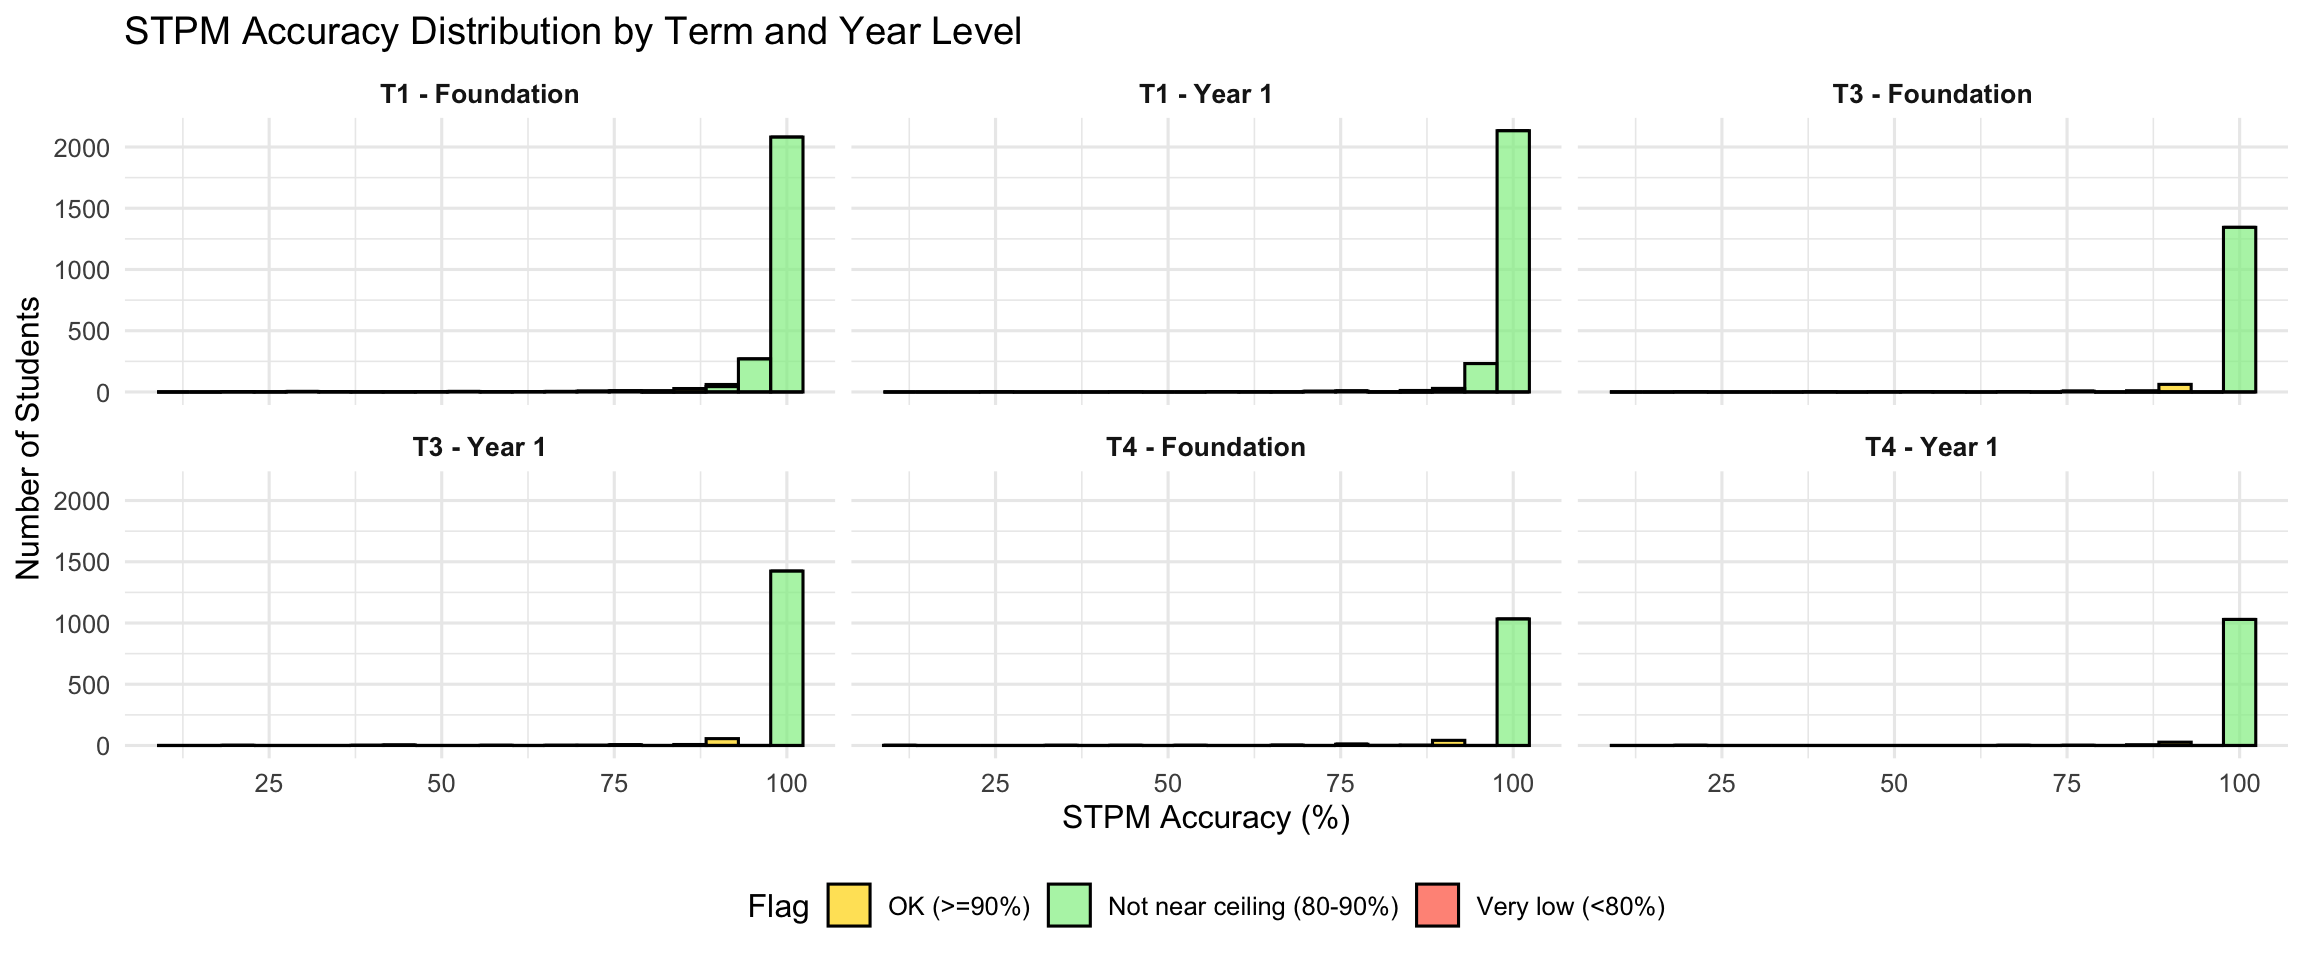
| Term | Year Level | N | % OK | % Not Near Ceiling | % Very Low |
|---|---|---|---|---|---|
| Term 1 | Foundation | 2492 | 96.1 | 2.2 | 1.6 |
| Term 1 | Year 1 | 2431 | 98.5 | 0.7 | 0.8 |
| Term 3 | Foundation | 1433 | 93.9 | 5.1 | 1.0 |
| Term 3 | Year 1 | 1503 | 94.9 | 4.3 | 0.9 |
| Term 4 | Foundation | 1095 | 94.3 | 4.2 | 1.5 |
| Term 4 | Year 1 | 1065 | 96.6 | 3.1 | 0.3 |
9.1 STPM Accuracy and Maths Performance
Do students with low STPM accuracy show different patterns in maths performance? This could indicate attention issues affecting both STPM and maths, or task misunderstanding affecting STPM validity for those students.
| Term | Year Level | STPM Accuracy Flag | N | r (Maths Acc) | r (Maths Speed) | Mean Maths Acc (%) |
|---|---|---|---|---|---|---|
| Term 1 | Foundation | Not Near Ceiling (80-90%) | 55 | -0.02 | 0.68 | 75.7 |
| Term 1 | Foundation | OK (>=90%) | 2389 | -0.22 | 0.63 | 83.2 |
| Term 1 | Foundation | Very Low (<80%) | 40 | -0.21 | 0.09 | 67.2 |
| Term 1 | Year 1 | Not Near Ceiling (80-90%) | 18 | -0.31 | 0.50 | 80.8 |
| Term 1 | Year 1 | OK (>=90%) | 2393 | -0.18 | 0.51 | 85.0 |
| Term 1 | Year 1 | Very Low (<80%) | 19 | -0.27 | 0.50 | 65.7 |
| Term 3 | Foundation | Not Near Ceiling (80-90%) | 72 | -0.14 | 0.59 | 84.7 |
| Term 3 | Foundation | OK (>=90%) | 1346 | -0.19 | 0.53 | 89.8 |
| Term 3 | Foundation | Very Low (<80%) | 13 | -0.08 | 0.20 | 77.3 |
| Term 3 | Year 1 | Not Near Ceiling (80-90%) | 64 | -0.46 | 0.27 | 83.6 |
| Term 3 | Year 1 | OK (>=90%) | 1422 | -0.20 | 0.49 | 89.5 |
| Term 3 | Year 1 | Very Low (<80%) | 13 | -0.01 | 0.04 | 71.2 |
| Term 4 | Foundation | Not Near Ceiling (80-90%) | 46 | -0.09 | 0.44 | 87.7 |
| Term 4 | Foundation | OK (>=90%) | 1033 | -0.05 | 0.48 | 91.2 |
| Term 4 | Foundation | Very Low (<80%) | 16 | 0.32 | 0.47 | 73.1 |
| Term 4 | Year 1 | Not Near Ceiling (80-90%) | 33 | -0.17 | 0.30 | 83.5 |
| Term 4 | Year 1 | OK (>=90%) | 1029 | -0.18 | 0.46 | 90.5 |
| Term 4 | Year 1 | Very Low (<80%) | 3 | -0.65 | 0.23 | 55.7 |
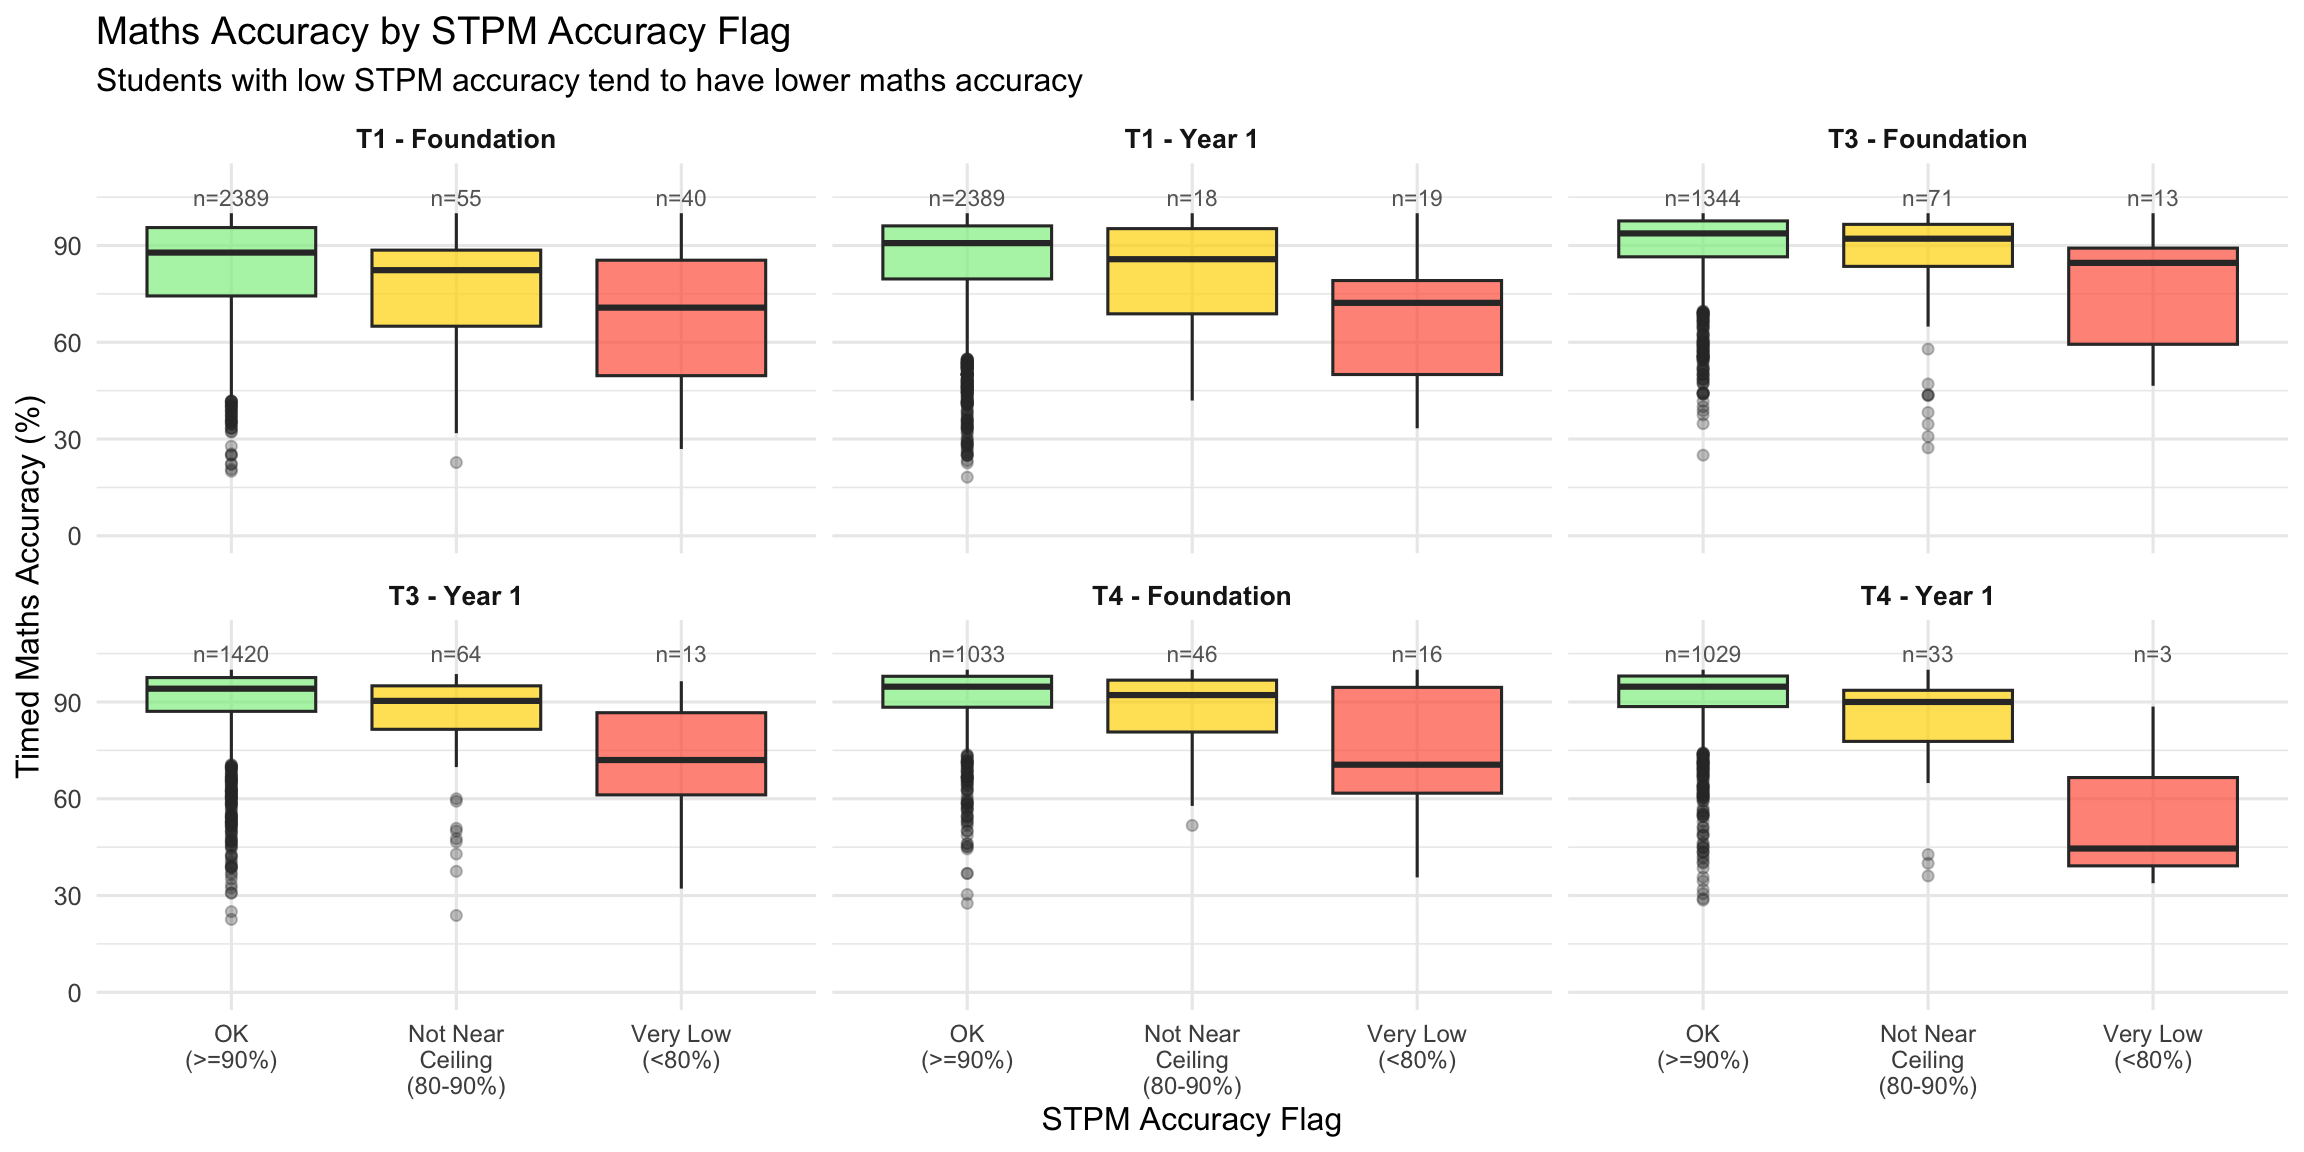
NoteInterpretation
Students flagged for low STPM accuracy typically show:
- Lower maths accuracy: Suggesting the attention/comprehension issues affecting STPM also impact maths performance
- Similar or weaker STPM-maths correlations: The relationship between STPM speed and maths may be attenuated in these groups
This supports using the STPM accuracy flag as a validity indicator for the session, rather than just filtering these students out.
10. Consultant Interpretation Guidance
Tip1. Use STPM as Context, Not Automatic Correction
- Very slow STPM = possible device/attention/motor constraints
- Very low STPM accuracy = attention/comprehension concern
- Consider re-check if student is borderline risk + extreme STPM values
Tip2. Flag, Don’t Adjust
If a student is “high risk by fluency” but also in the lowest decile on STPM speed, add an interpretation note:
“Low fluency, but unusually slow baseline responding - consider device familiarity”
If low STPM accuracy:
“Baseline task accuracy suggests possible attention/comprehension issues”
Warning3. What STPM is NOT
- Not a “correction factor” to subtract from maths RT
- Not a pure motor measure - correlates with maths performance
- Not a reason to dismiss fluency concerns - use for context only
11. Downloads
Download STPM Student Summary (CSV)
Download Fields
| Field | Description |
|---|---|
student_id |
Unique student identifier |
exam_group |
Assessment cohort |
term |
Assessment term (1, 3, or 4) |
year_level |
Foundation or Year 1 |
n_items_attempted |
Number of STPM items attempted |
n_correct |
Number of correct responses |
accuracy |
Proportion correct |
median_rt_sec |
Median response time (seconds), excluding pauses |
rcpm |
Responses Correct Per Minute |
log_median_rt |
Log-transformed median RT |
p95_rt_sec |
95th percentile RT |
max_rt_sec |
Maximum RT |
n_pauses_30s |
Count of items with RT >30s |
n_pauses_60s |
Count of items with RT >60s |
n_errors |
Number of incorrect responses |
stpm_accuracy_flag |
“ok”, “not_near_ceiling”, or “very_low” (NA if <5 items) |