1. Probe description
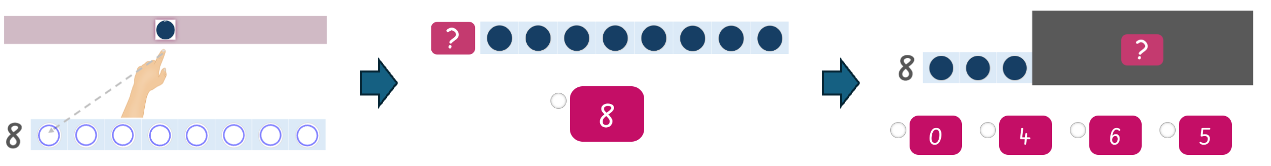
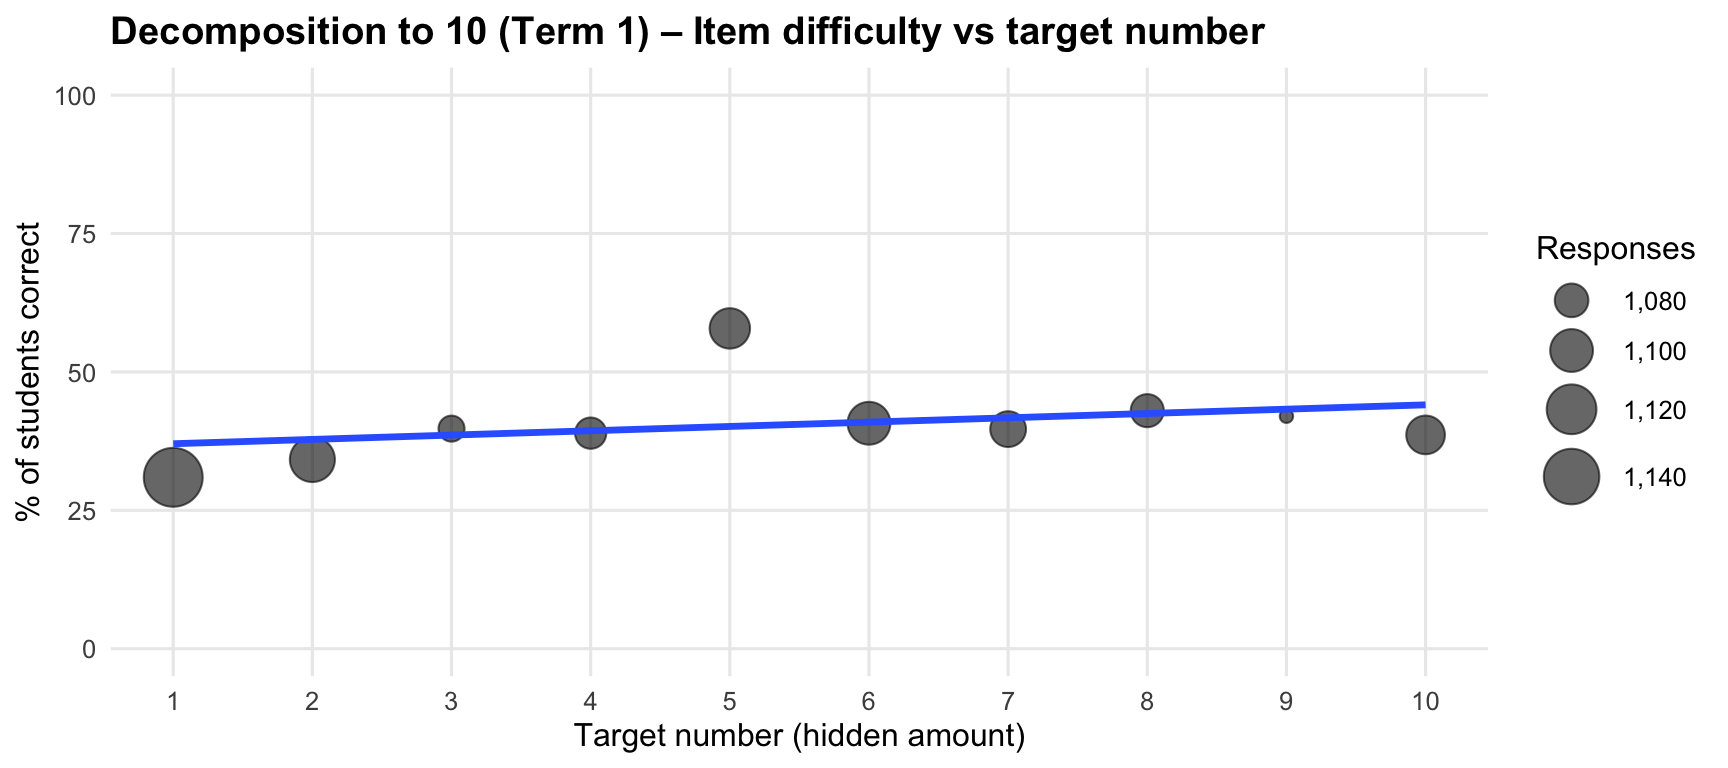
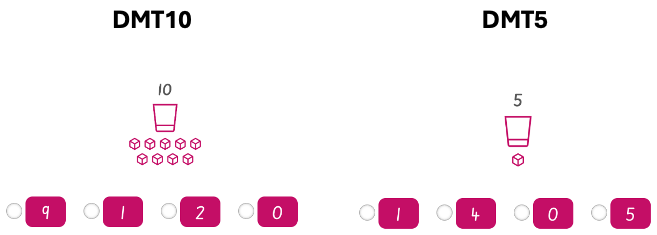
The Decomposition probe assesses students’ understanding of part-whole relationships with numbers. Students are shown a total quantity with some hidden, and must identify how many are hidden. Students select their answer from 4 multiple-choice options (numbers).
In 2025 there are two main forms used in the Foundation screening:
- Decomposition to 5 (DMT5) – Term 1
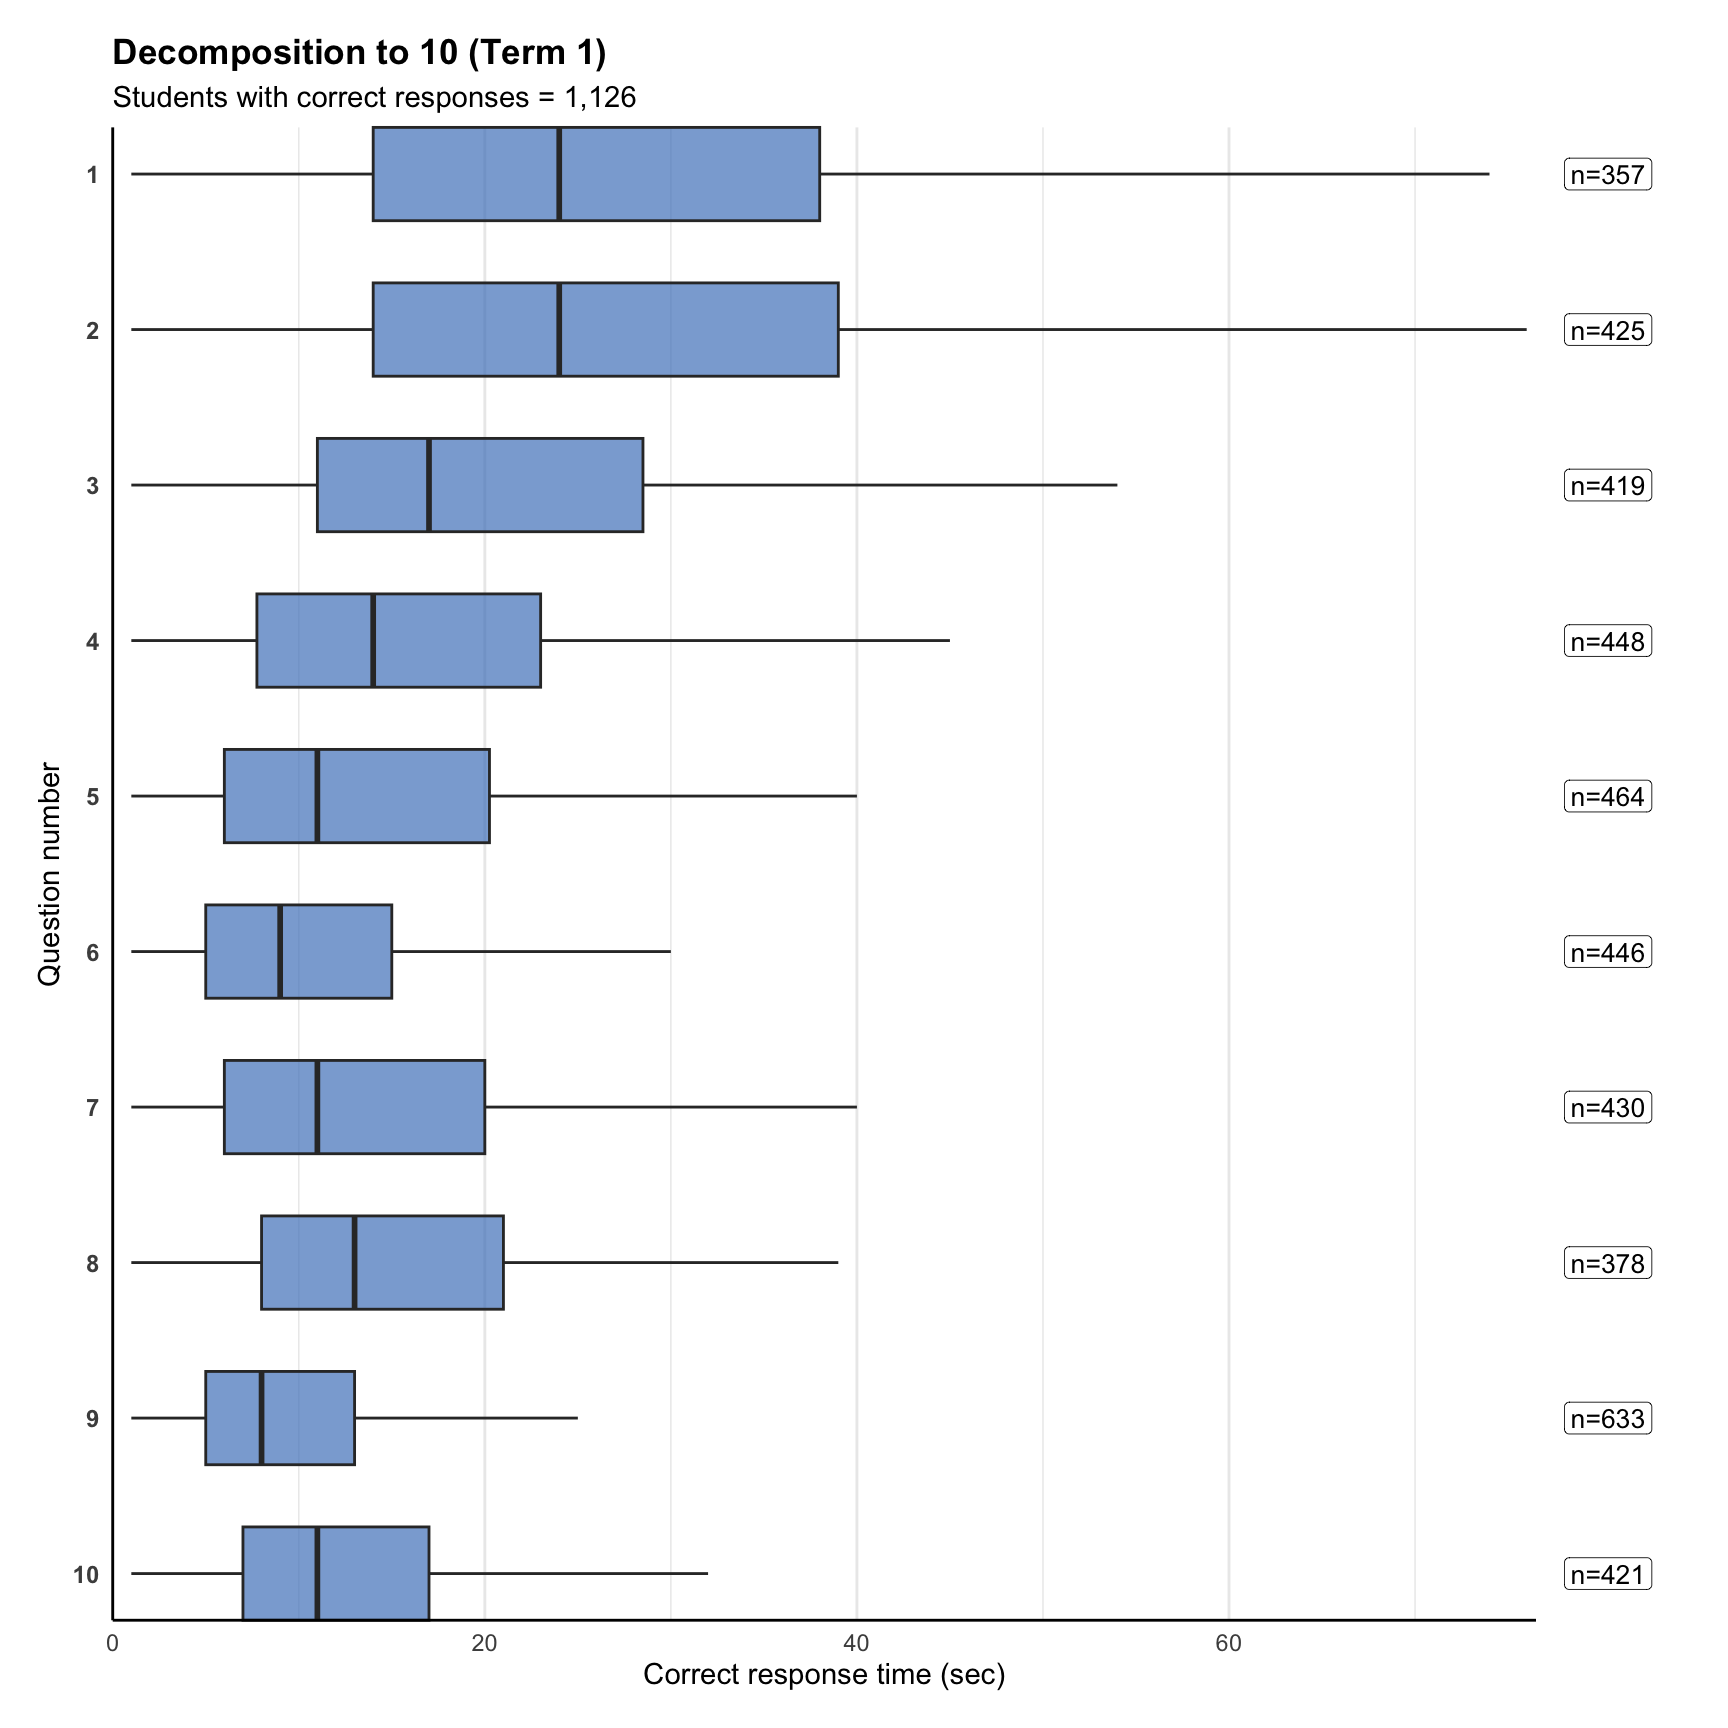
- Decomposition to 10 (DMT10) – Term 1
- Decomposition to 5 V2 (DMT5V2) – Term 3 / Term 4
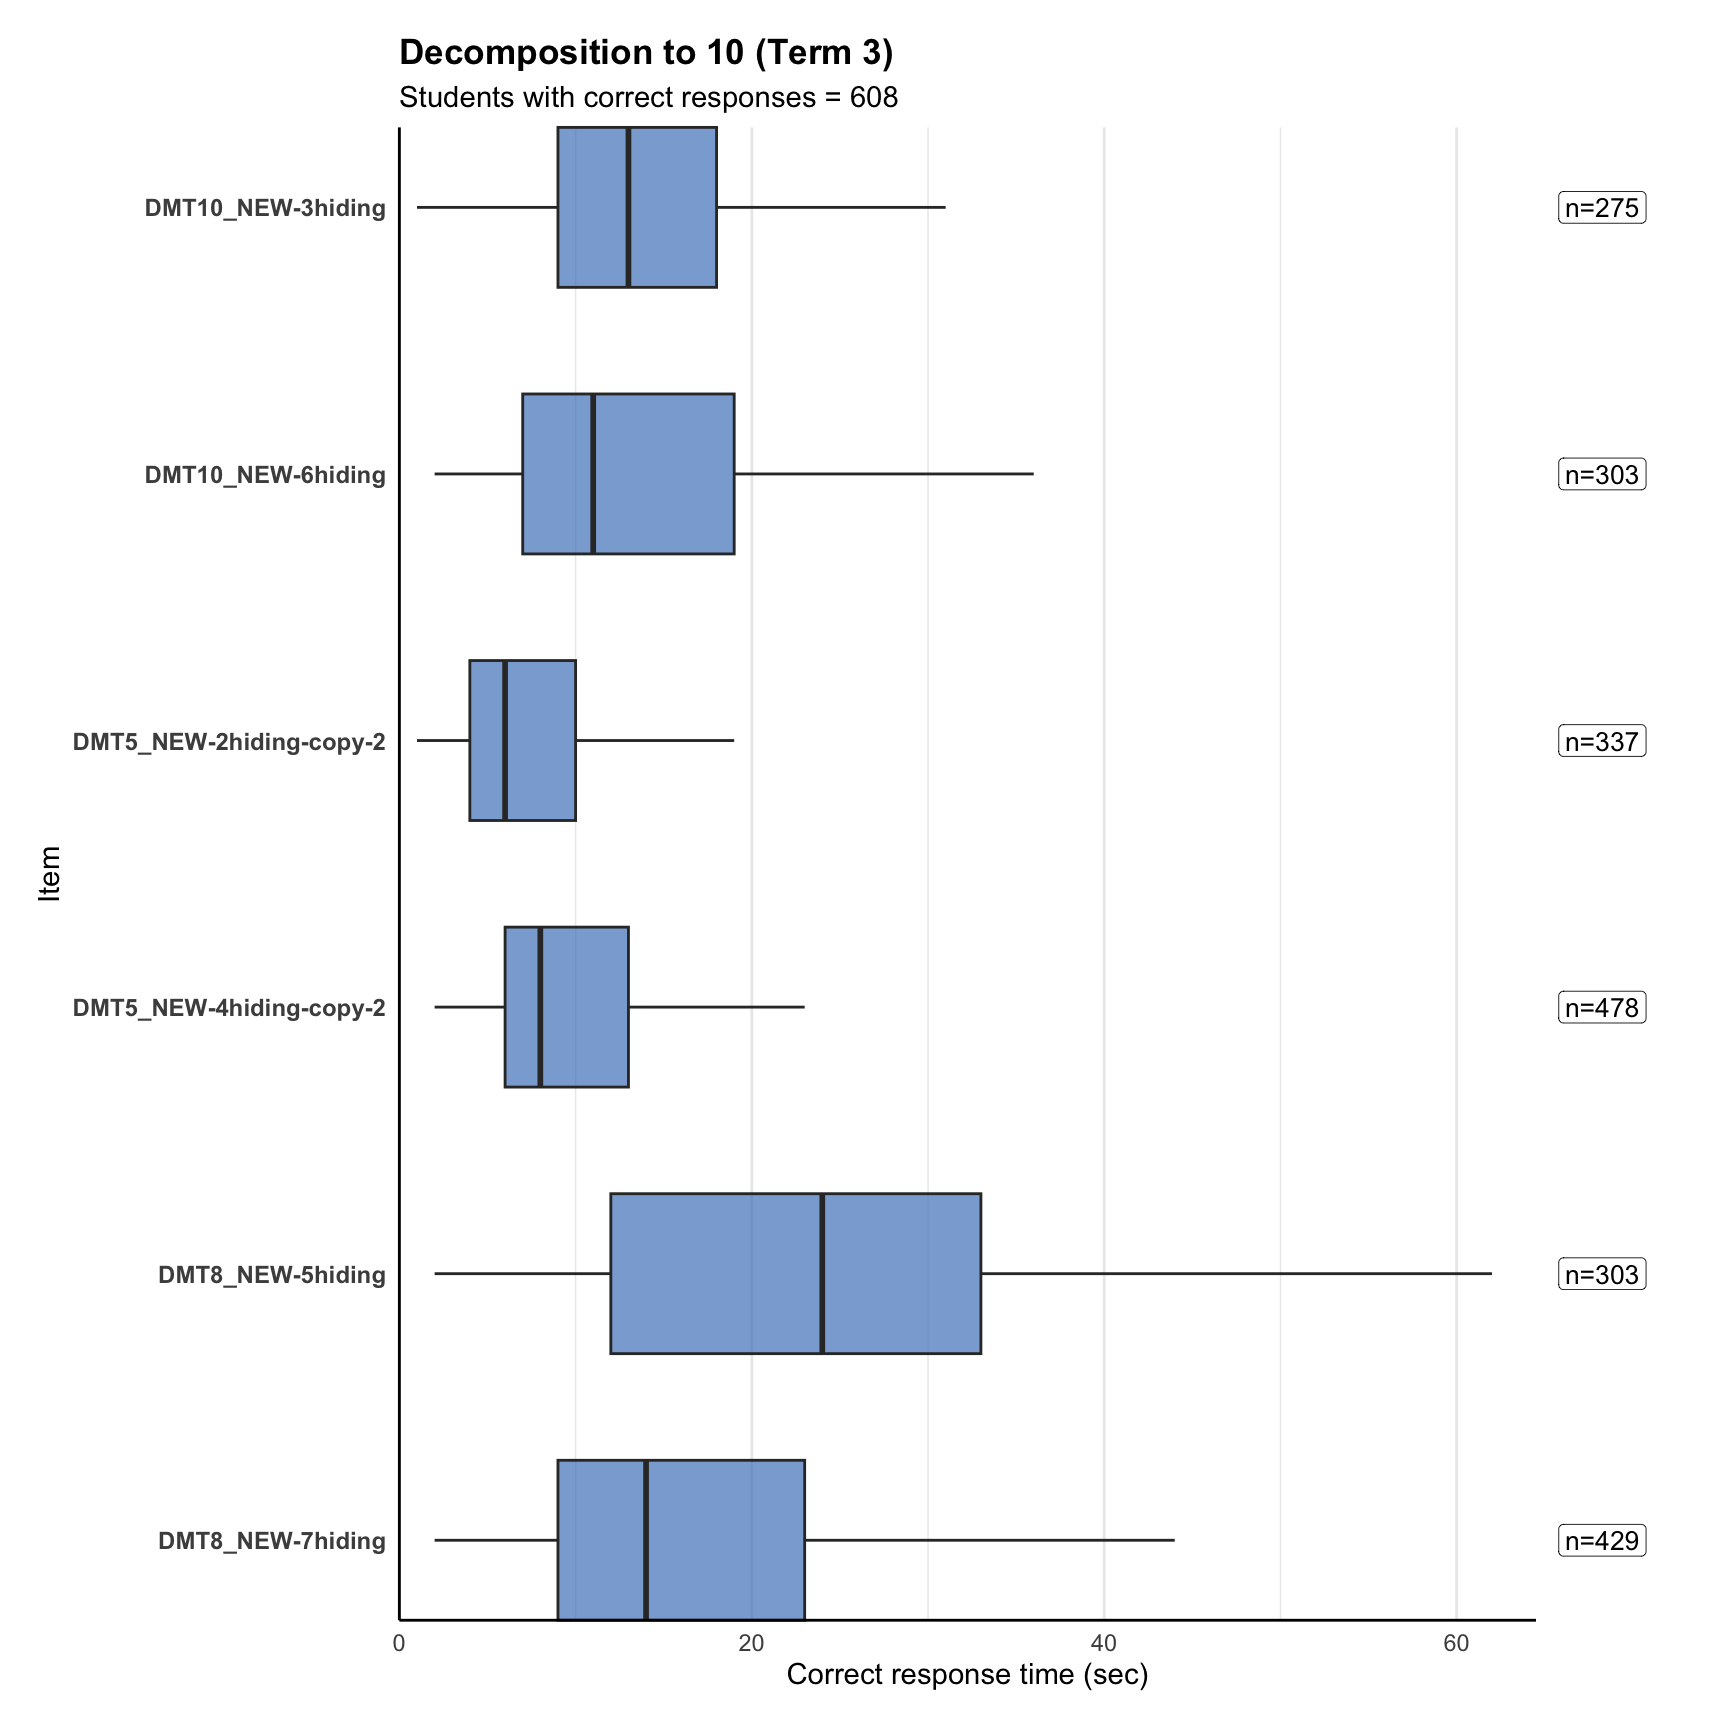
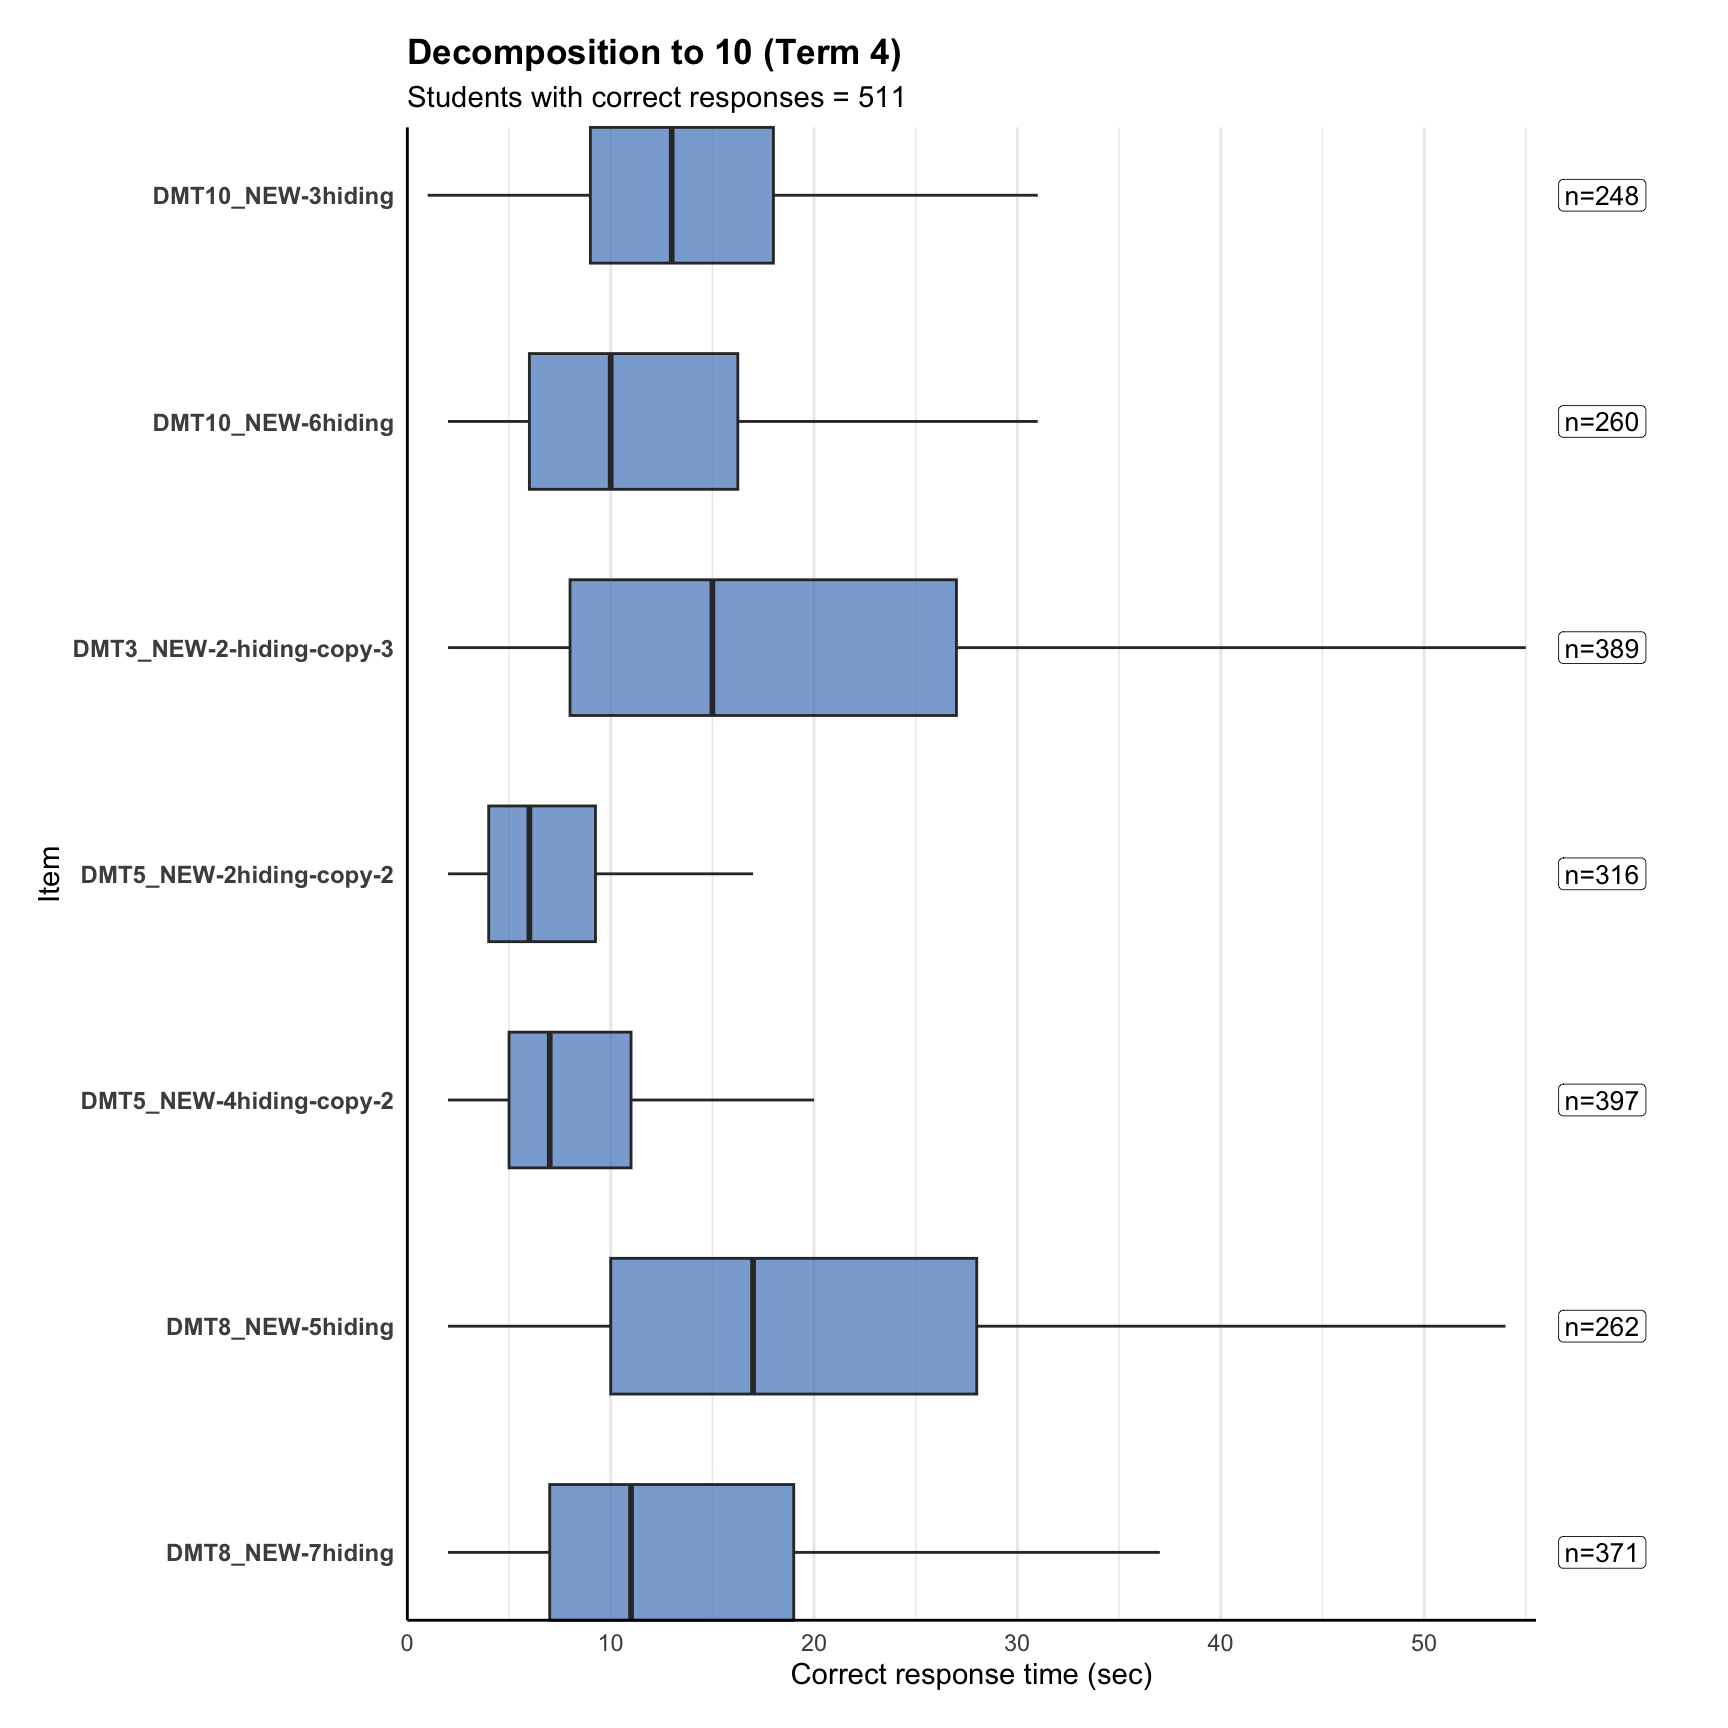
- Decomposition to 10 V2 (DMT10V2) – Term 3 / Term 4
Decomposition is not a timed probe, so there is no fluency analysis. This probe was completed only by Foundation students.
Changes from Term 1 (BOY) to Term 3 (MOY) / Term 4 (EOY)
The task presentation and quantity of items changed between BOY and MOY/EOY assessments:
| Decomposition to 5 |
5 blocks are in a cup and some fall out (10 items) |
Up to 5 counters in a line, given the total identify the hidden quantity (6 items) |
| Decomposition to 10 |
10 blocks are in a cup and some fall out (10 items) |
Up to 10 counters in a line, given the total identify the hidden quantity (6 items) |
Term 1 examples
2. Overview of test results
| 1 |
Decomposing Measure to 10 |
DMT10_2025 |
1197 |
10/10 |
30.0 |
15.10 |
| 1 |
Decomposing Measure to 5 |
DMT5_2025 |
1288 |
10/10 |
61.3 |
11.50 |
| 3 |
Decomposition Measure 10 |
DECOMP-MEASURE-10 |
647 |
6/7 |
60.0 |
13.83 |
| 3 |
Decomposition Measure 5 |
DECOMP-MEASURE-5 |
785 |
7/8 |
71.4 |
9.71 |
| 4 |
Decomposition Measure 10 |
DECOMP-MEASURE-10 |
525 |
7/7 |
66.7 |
12.57 |
| 4 |
Decomposition Measure 5 |
DECOMP-MEASURE-5 |
566 |
7/8 |
85.7 |
10.14 |
|
| * Accuracy is calculated after removing non-attempted items. |
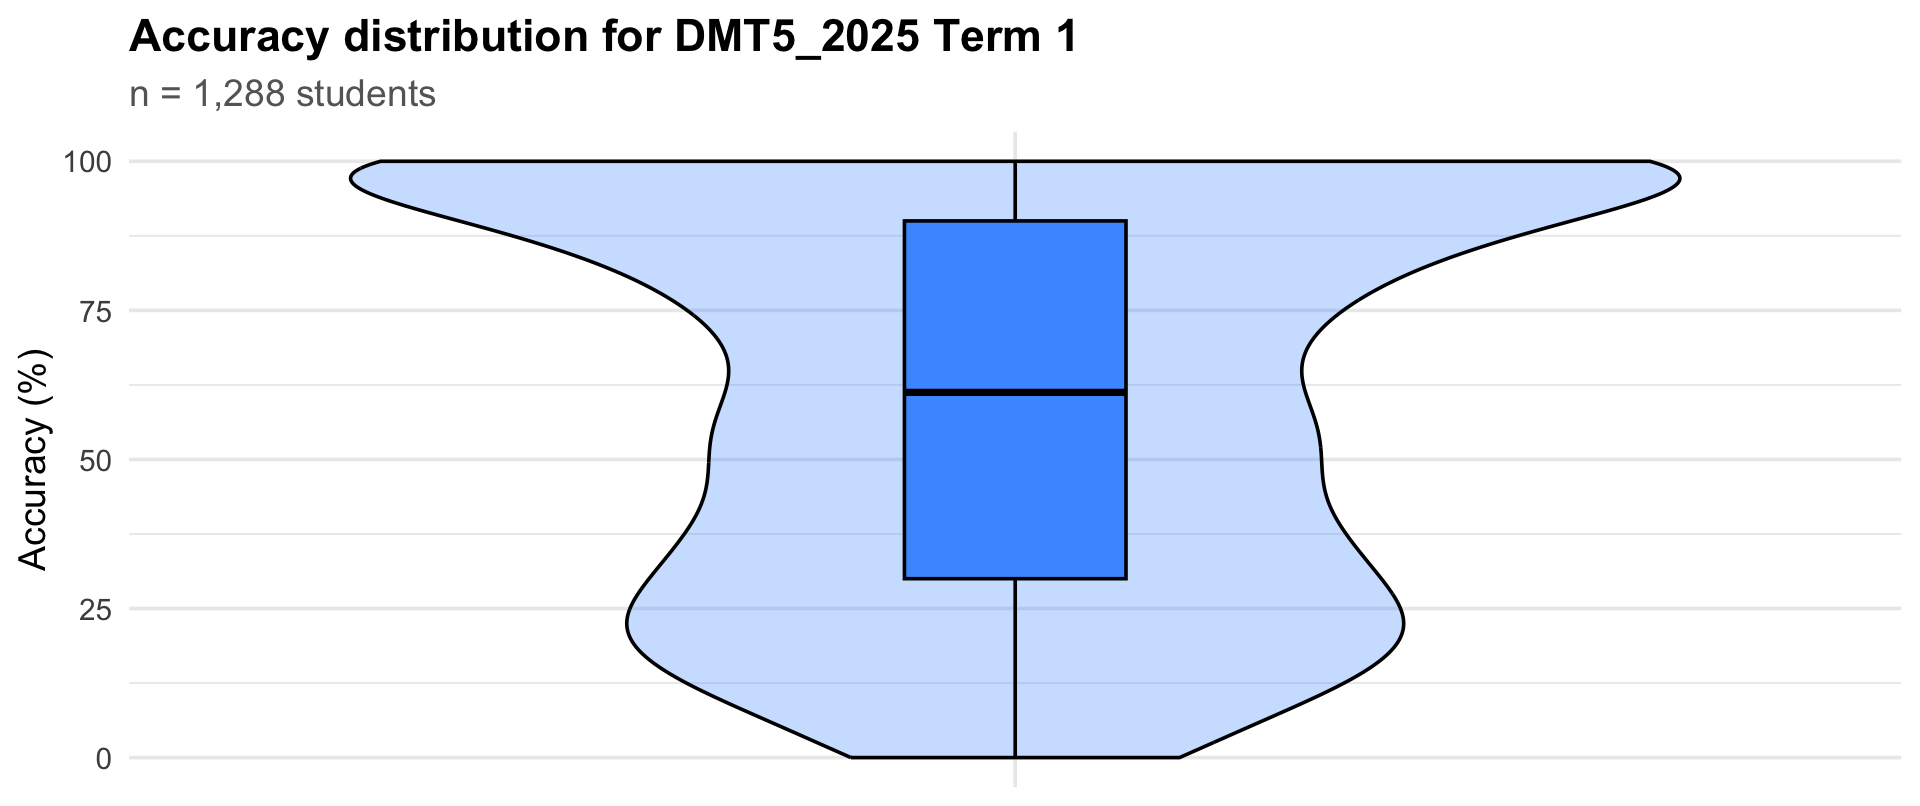
3. Accuracy distribution
Accuracy distribution
|
Term
|
Students
|
25th percentile
|
Median
|
75th percentile
|
|
Term 1
|
1288
|
30
|
61.2
|
90
|
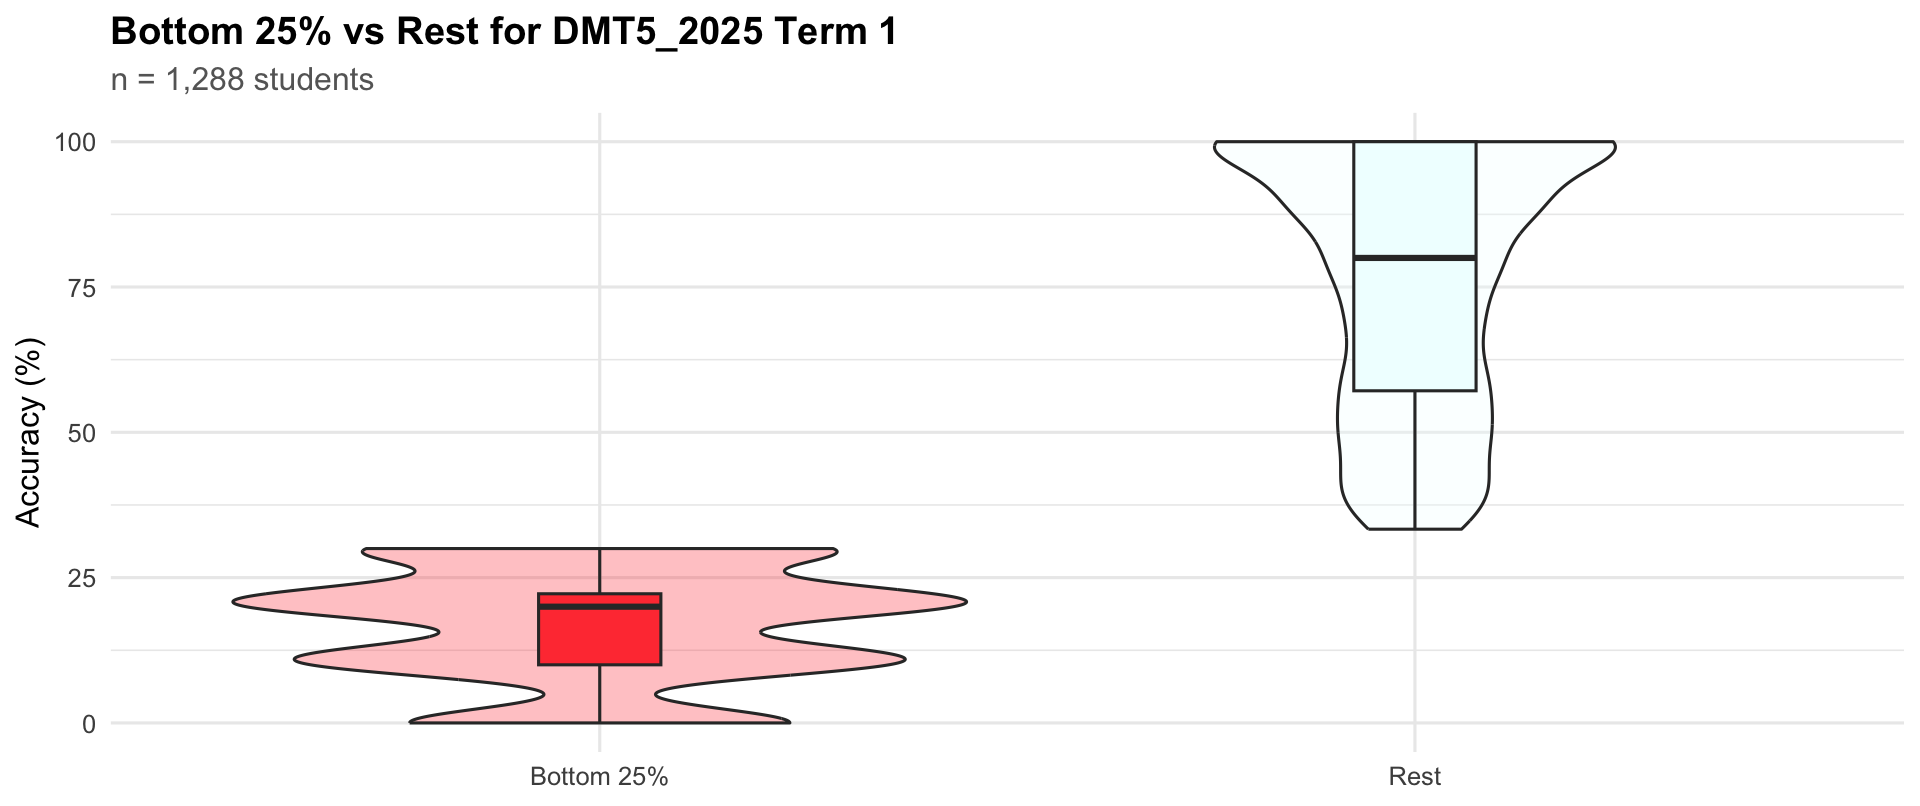
Bottom quartile vs rest
|
Term
|
Group
|
Students
|
25th percentile
|
Median
|
75th percentile
|
|
Term 1
|
Bottom 25%
|
356
|
10.0
|
20
|
22.2
|
|
Term 1
|
Rest
|
932
|
57.1
|
80
|
100.0
|
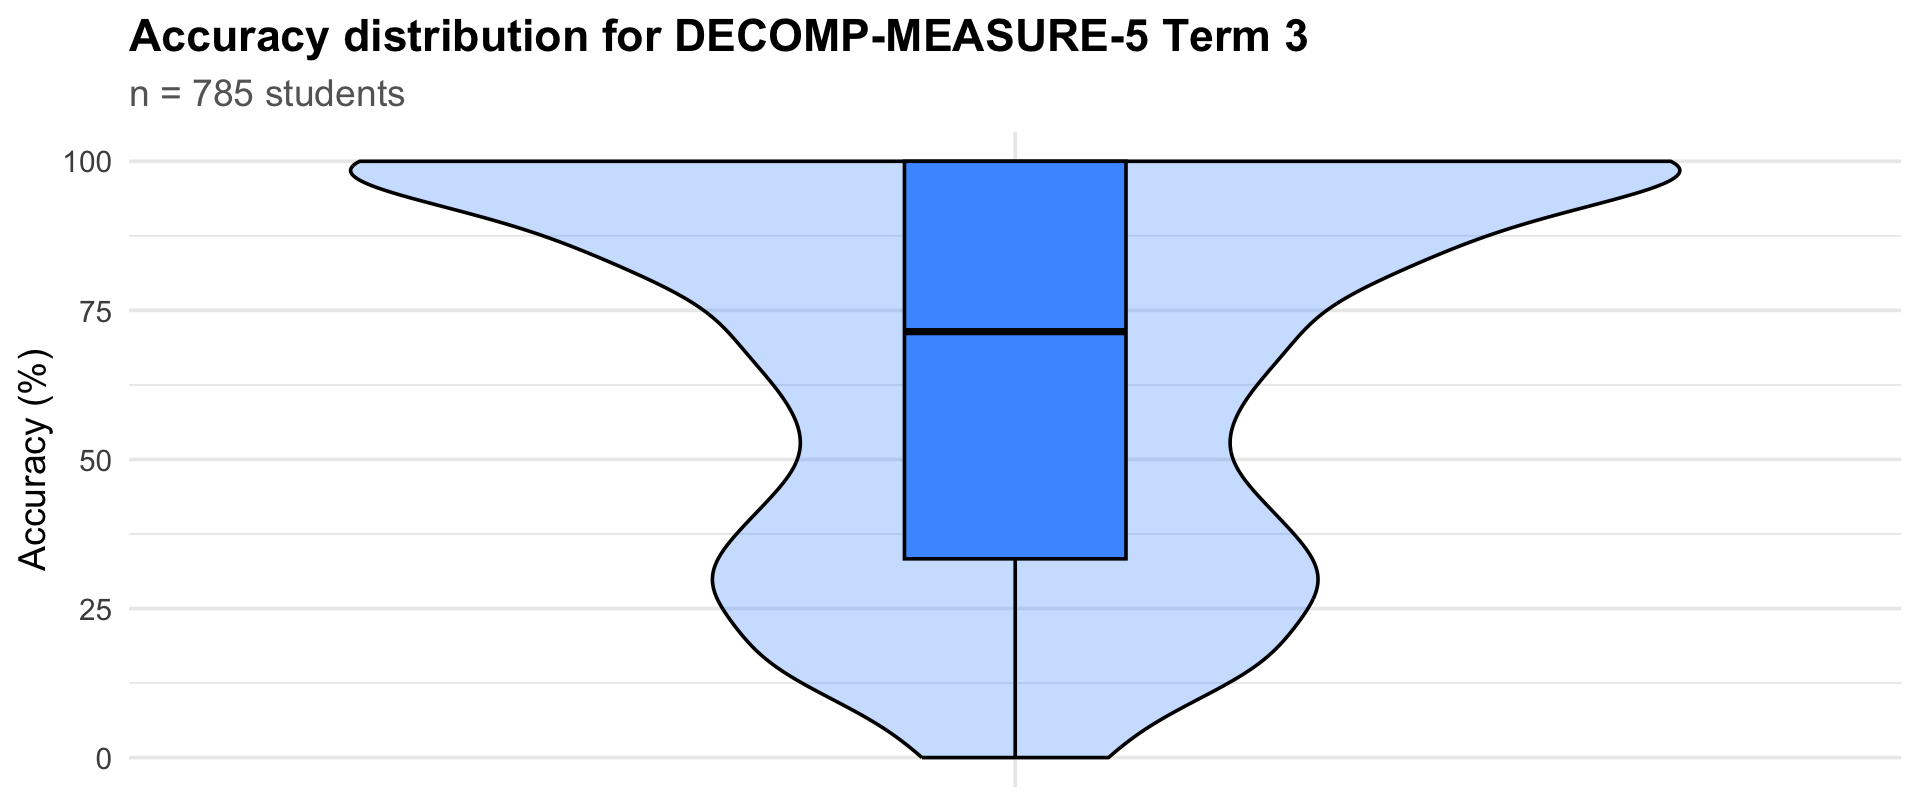
Accuracy distribution
|
Term
|
Students
|
25th percentile
|
Median
|
75th percentile
|
|
Term 3
|
785
|
33.3
|
71.4
|
100
|
Bottom quartile vs rest

|
Term
|
Group
|
Students
|
25th percentile
|
Median
|
75th percentile
|
|
Term 3
|
Bottom 25%
|
201
|
14.3
|
20.0
|
28.6
|
|
Term 3
|
Rest
|
584
|
66.7
|
85.7
|
100.0
|
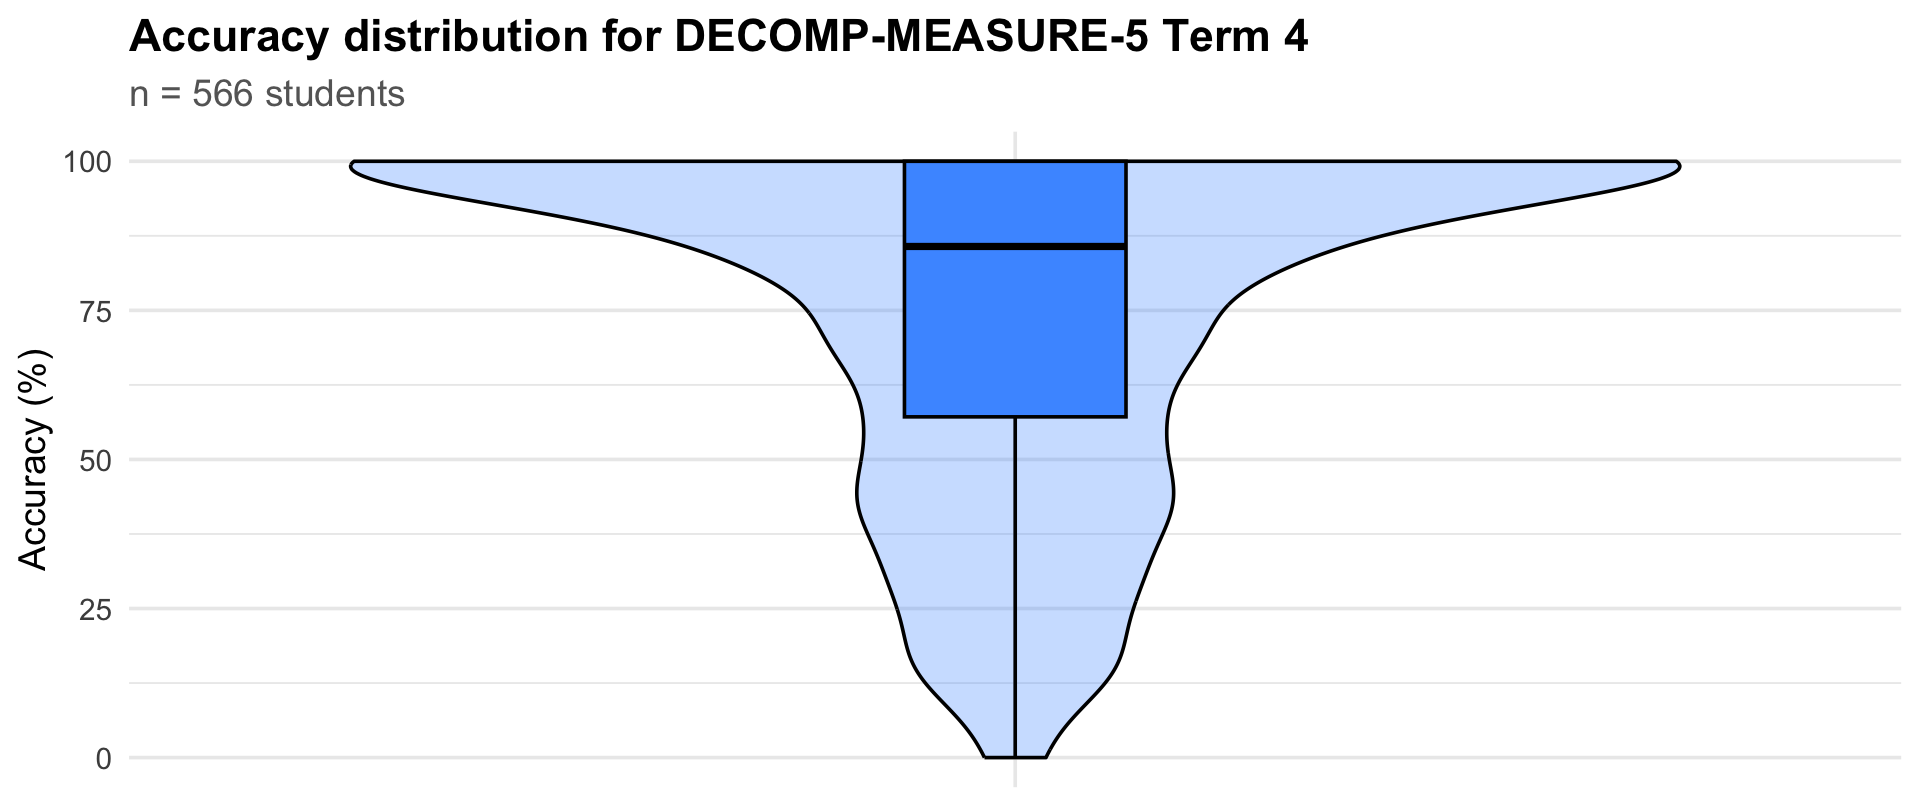
Accuracy distribution
|
Term
|
Students
|
25th percentile
|
Median
|
75th percentile
|
|
Term 4
|
566
|
57.1
|
85.7
|
100
|
Bottom quartile vs rest
|
Term
|
Group
|
Students
|
25th percentile
|
Median
|
75th percentile
|
|
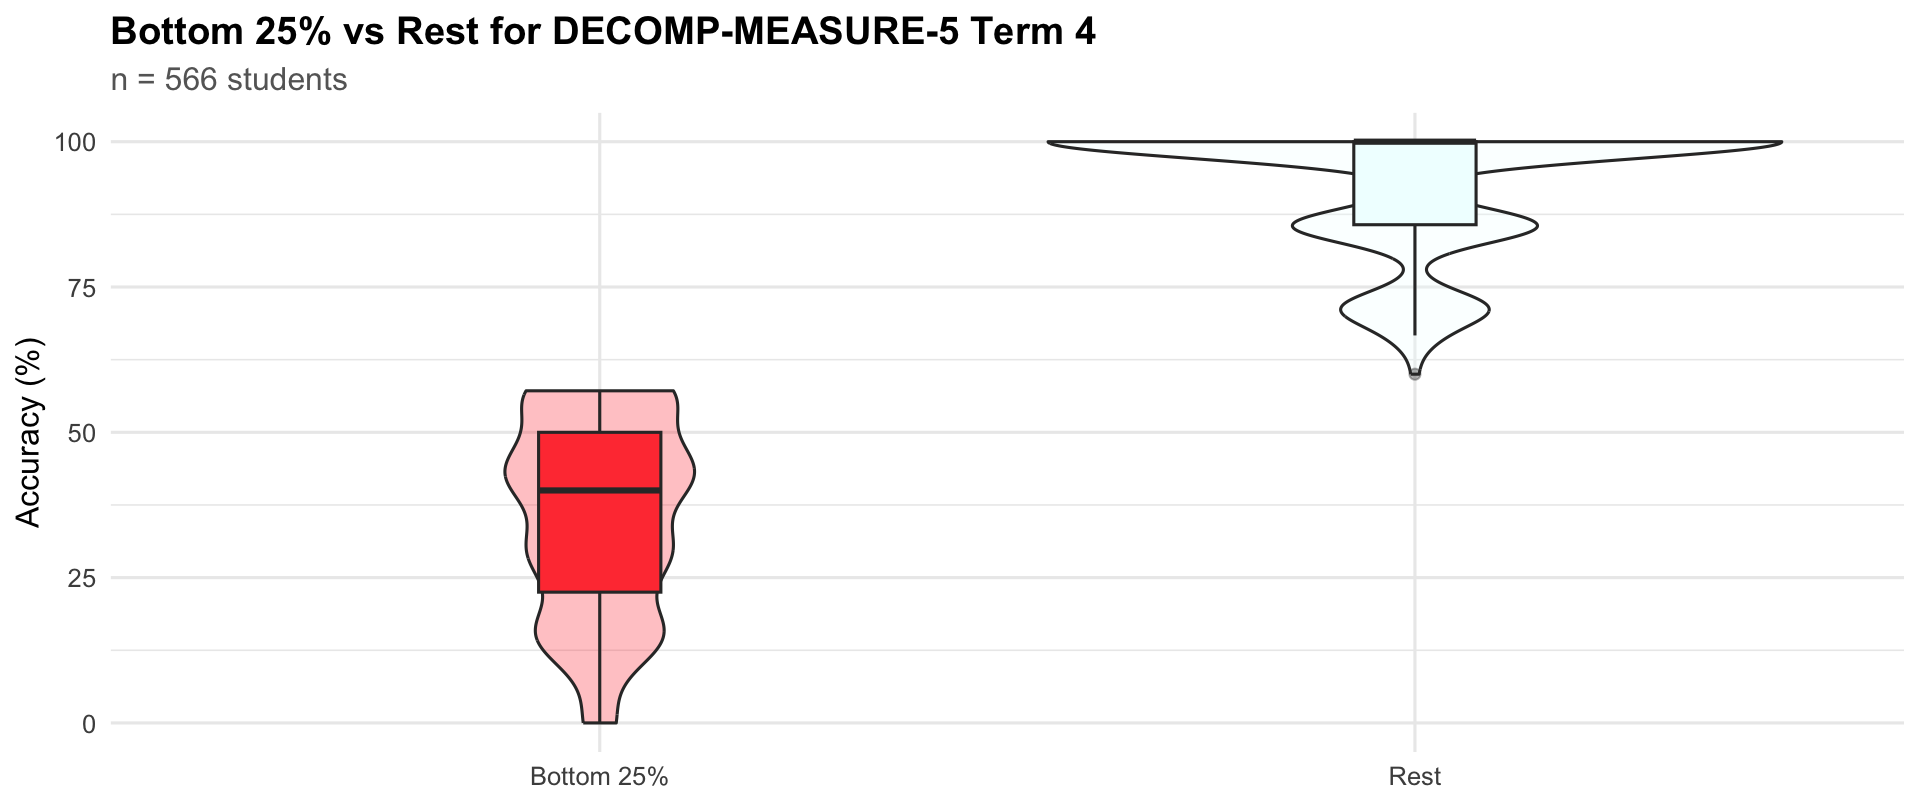
Term 4
|
Bottom 25%
|
167
|
22.5
|
40
|
50
|
|
Term 4
|
Rest
|
399
|
85.7
|
100
|
100
|
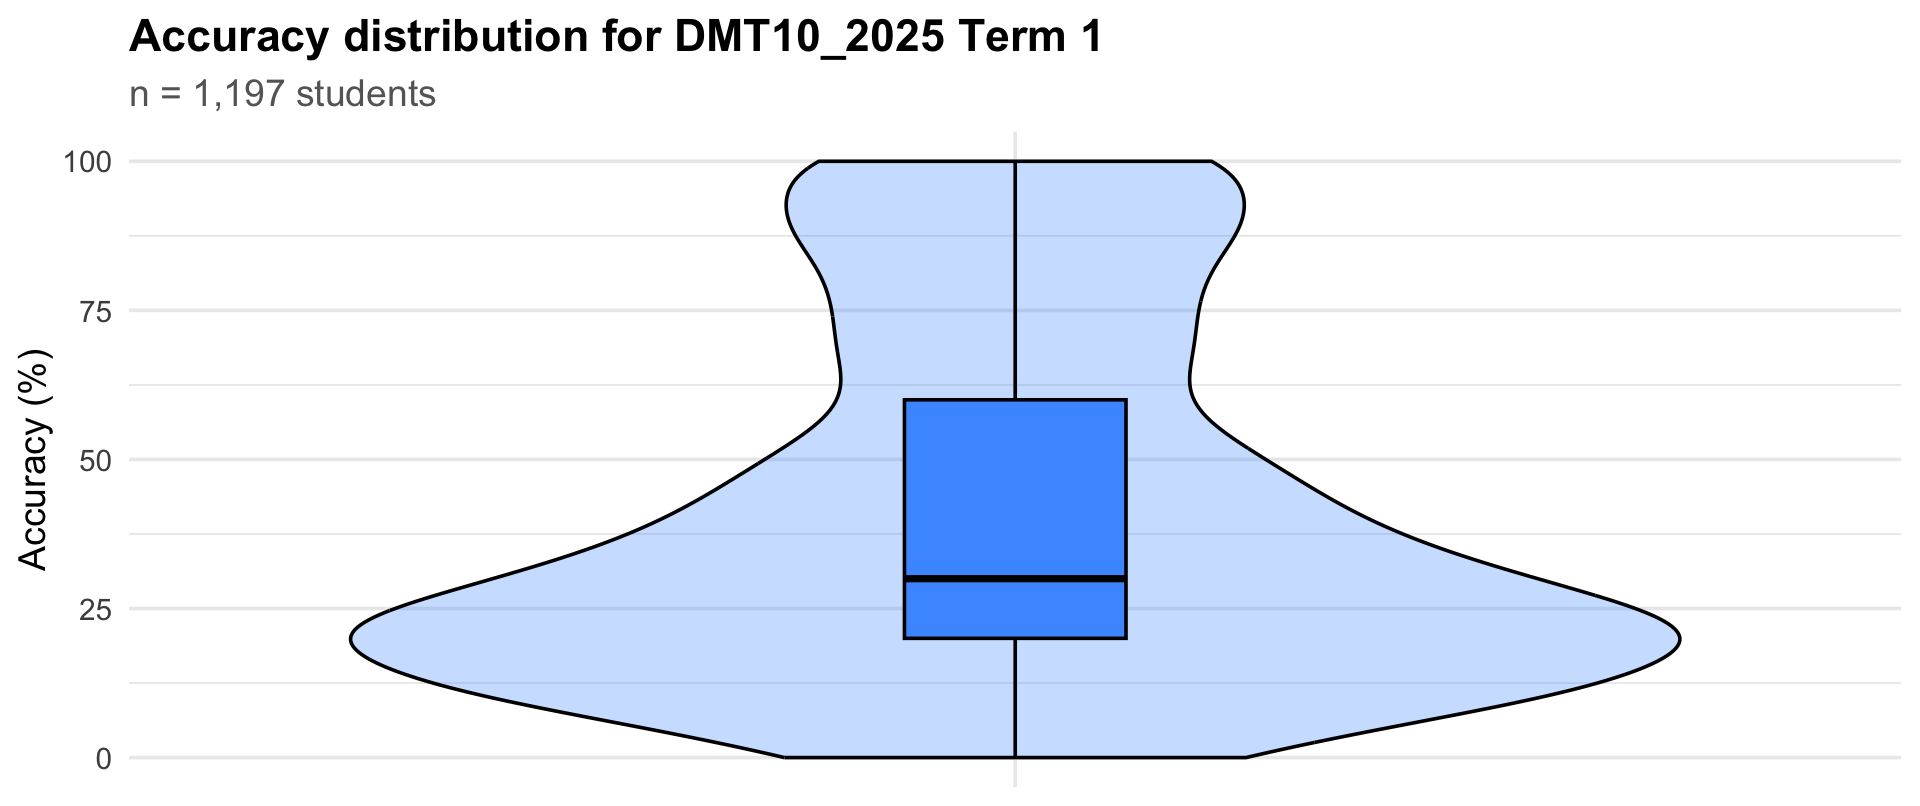
Accuracy distribution
|
Term
|
Students
|
25th percentile
|
Median
|
75th percentile
|
|
Term 1
|
1197
|
20
|
30
|
60
|
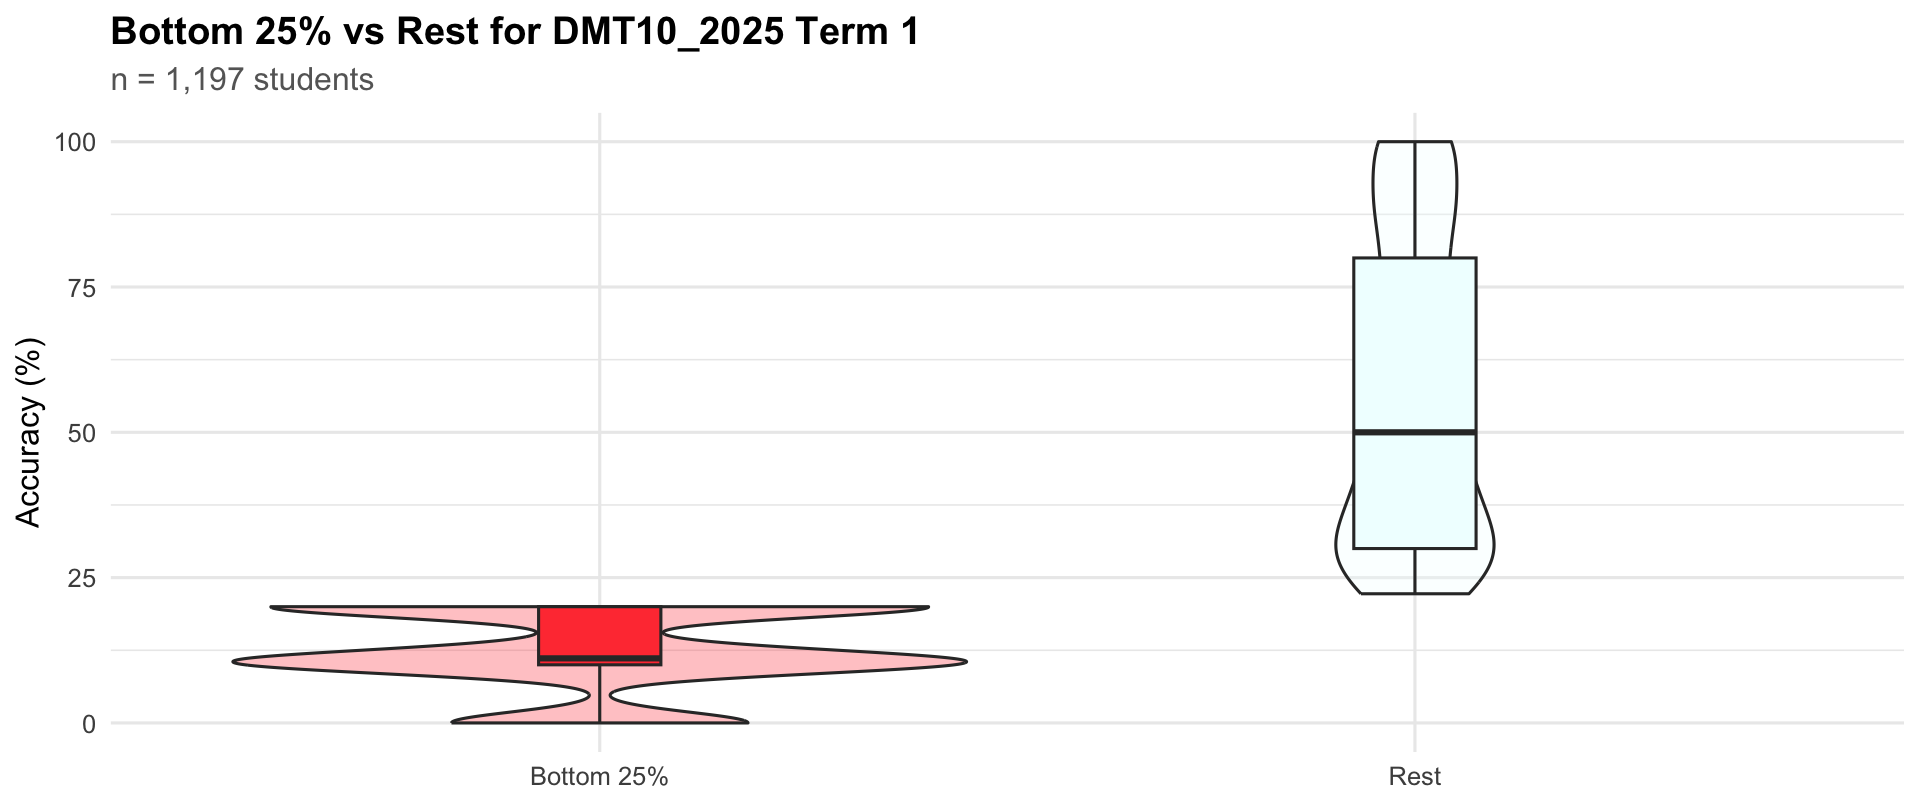
Bottom quartile vs rest
|
Term
|
Group
|
Students
|
25th percentile
|
Median
|
75th percentile
|
|
Term 1
|
Bottom 25%
|
432
|
10
|
11.1
|
20
|
|
Term 1
|
Rest
|
765
|
30
|
50.0
|
80
|
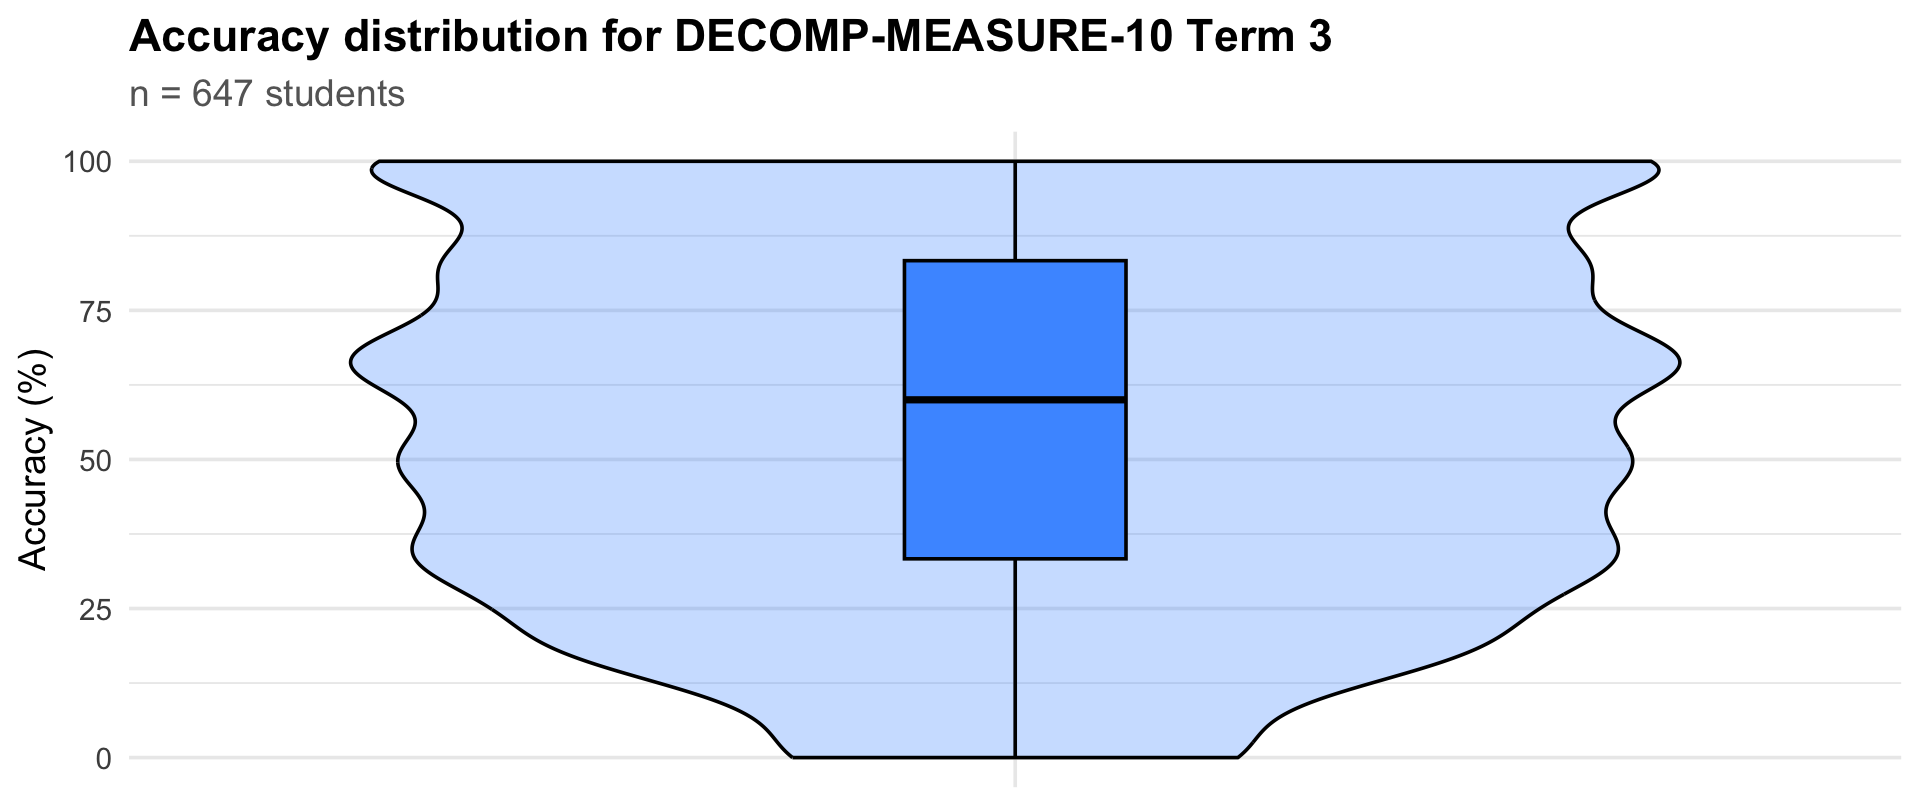
Accuracy distribution
|
Term
|
Students
|
25th percentile
|
Median
|
75th percentile
|
|
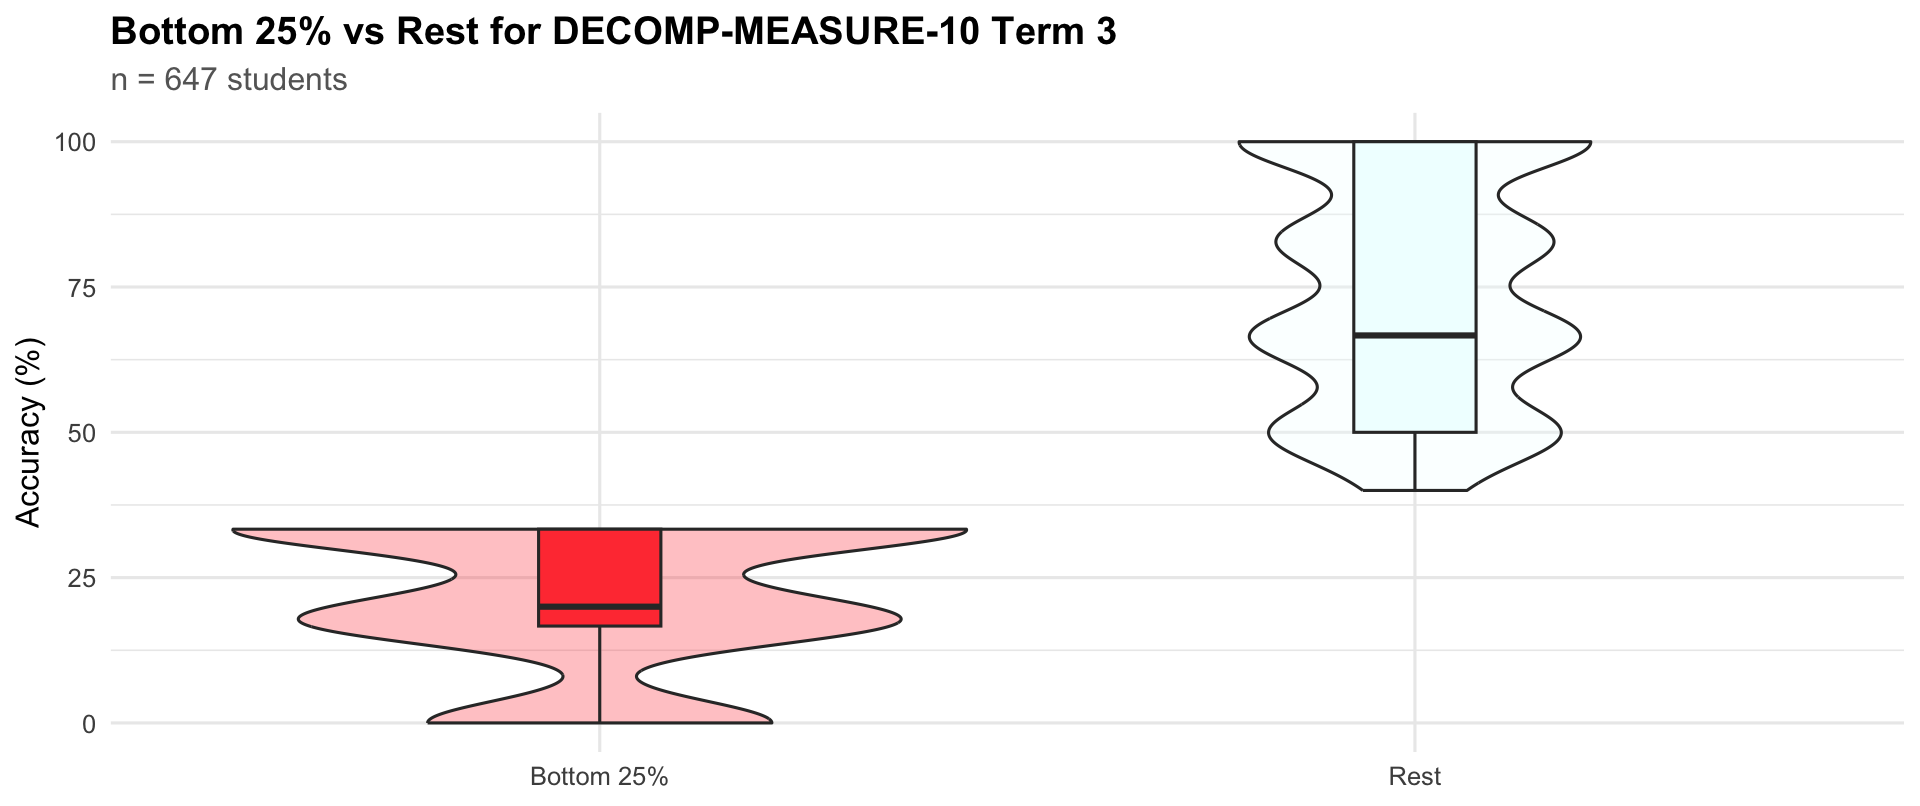
Term 3
|
647
|
33.3
|
60
|
83.3
|
Bottom quartile vs rest
|
Term
|
Group
|
Students
|
25th percentile
|
Median
|
75th percentile
|
|
Term 3
|
Bottom 25%
|
204
|
16.7
|
20.0
|
33.3
|
|
Term 3
|
Rest
|
443
|
50.0
|
66.7
|
100.0
|
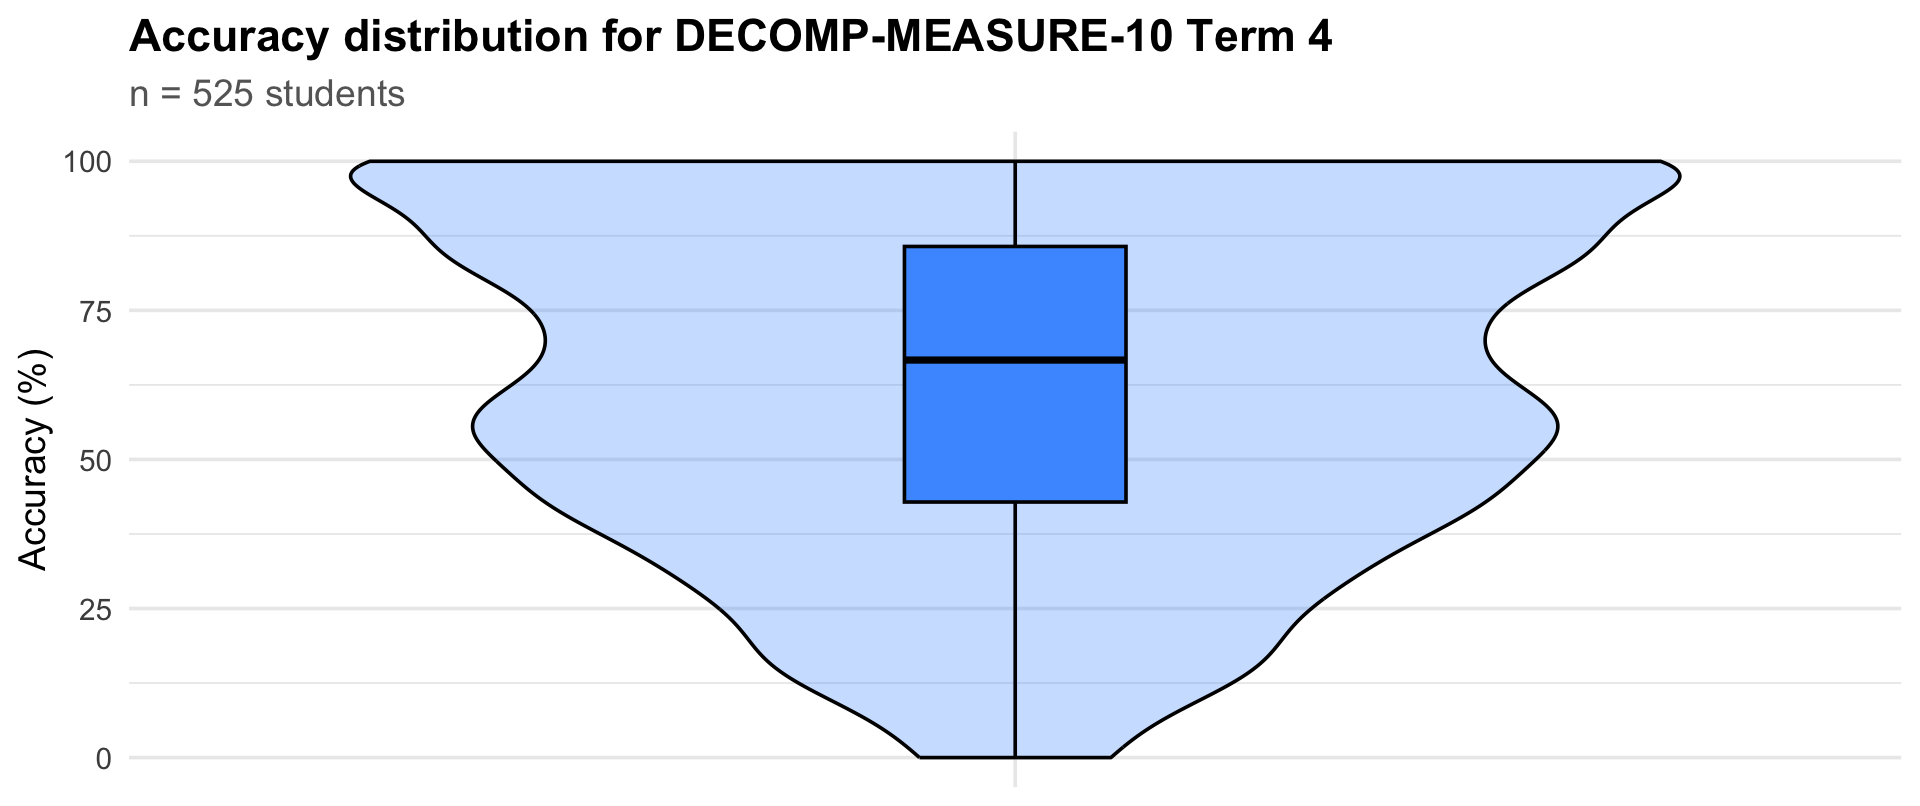
Accuracy distribution
|
Term
|
Students
|
25th percentile
|
Median
|
75th percentile
|
|
Term 4
|
525
|
42.9
|
66.7
|
85.7
|
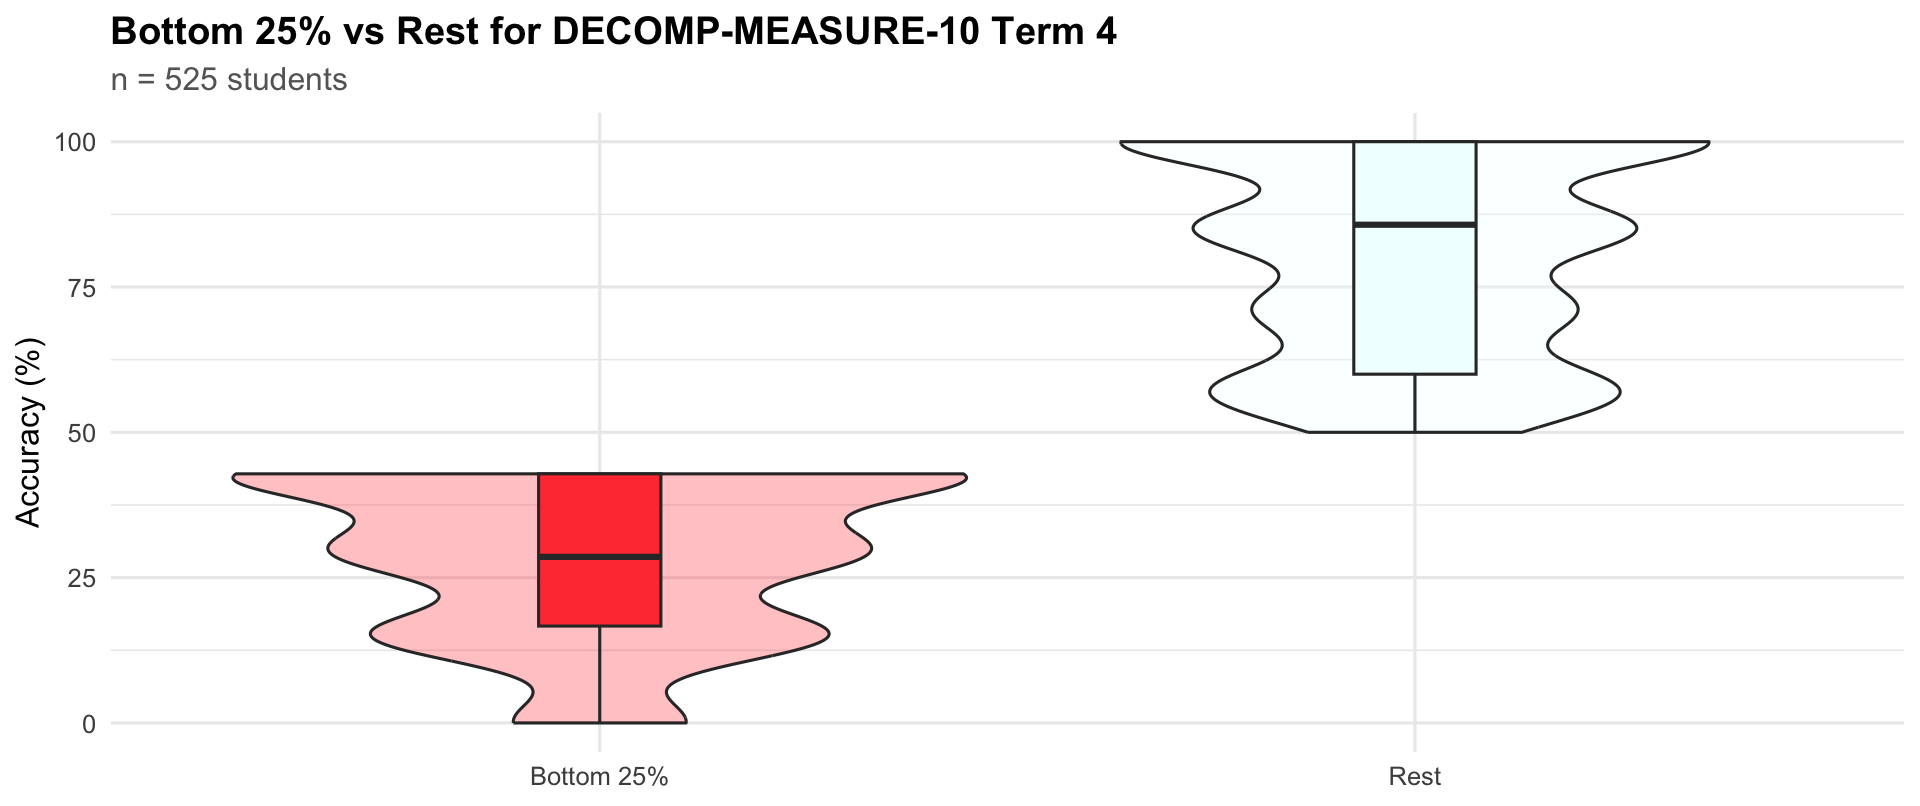
Bottom quartile vs rest
|
Term
|
Group
|
Students
|
25th percentile
|
Median
|
75th percentile
|
|
Term 4
|
Bottom 25%
|
161
|
16.7
|
28.6
|
42.9
|
|
Term 4
|
Rest
|
364
|
60.0
|
85.7
|
100.0
|
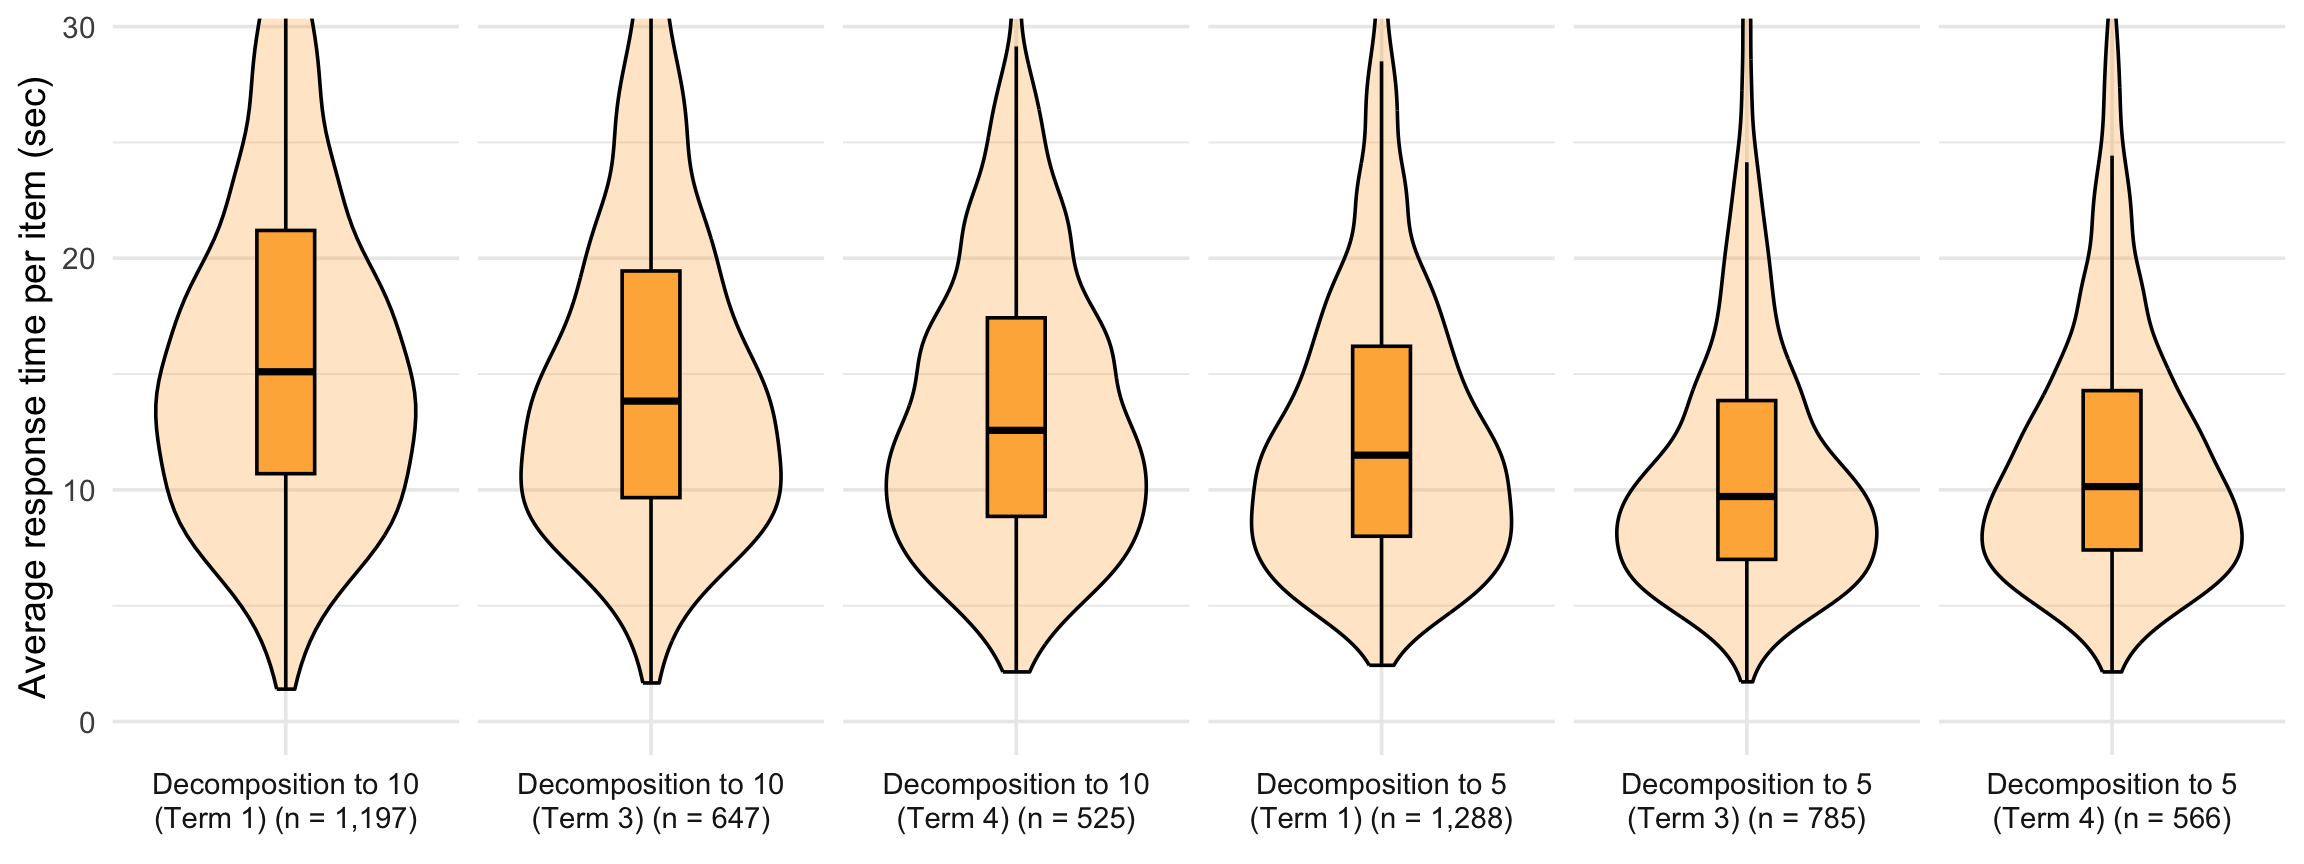
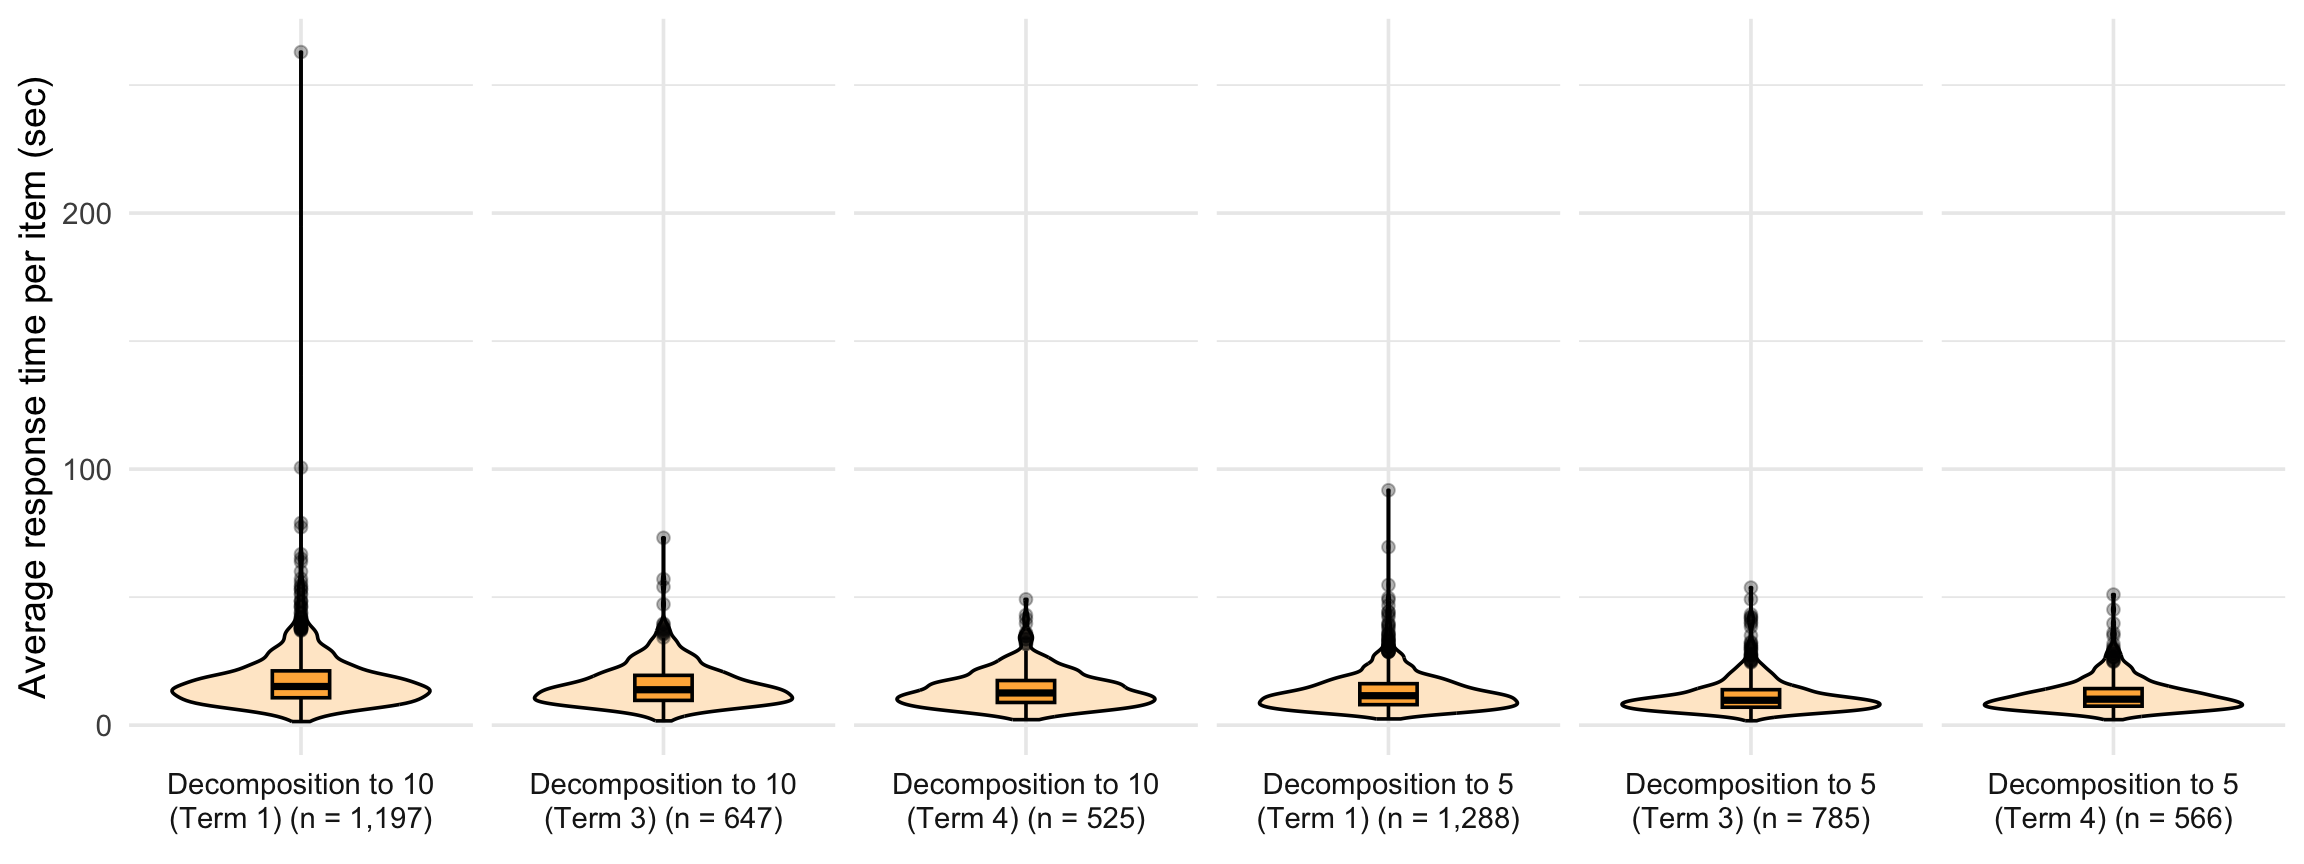
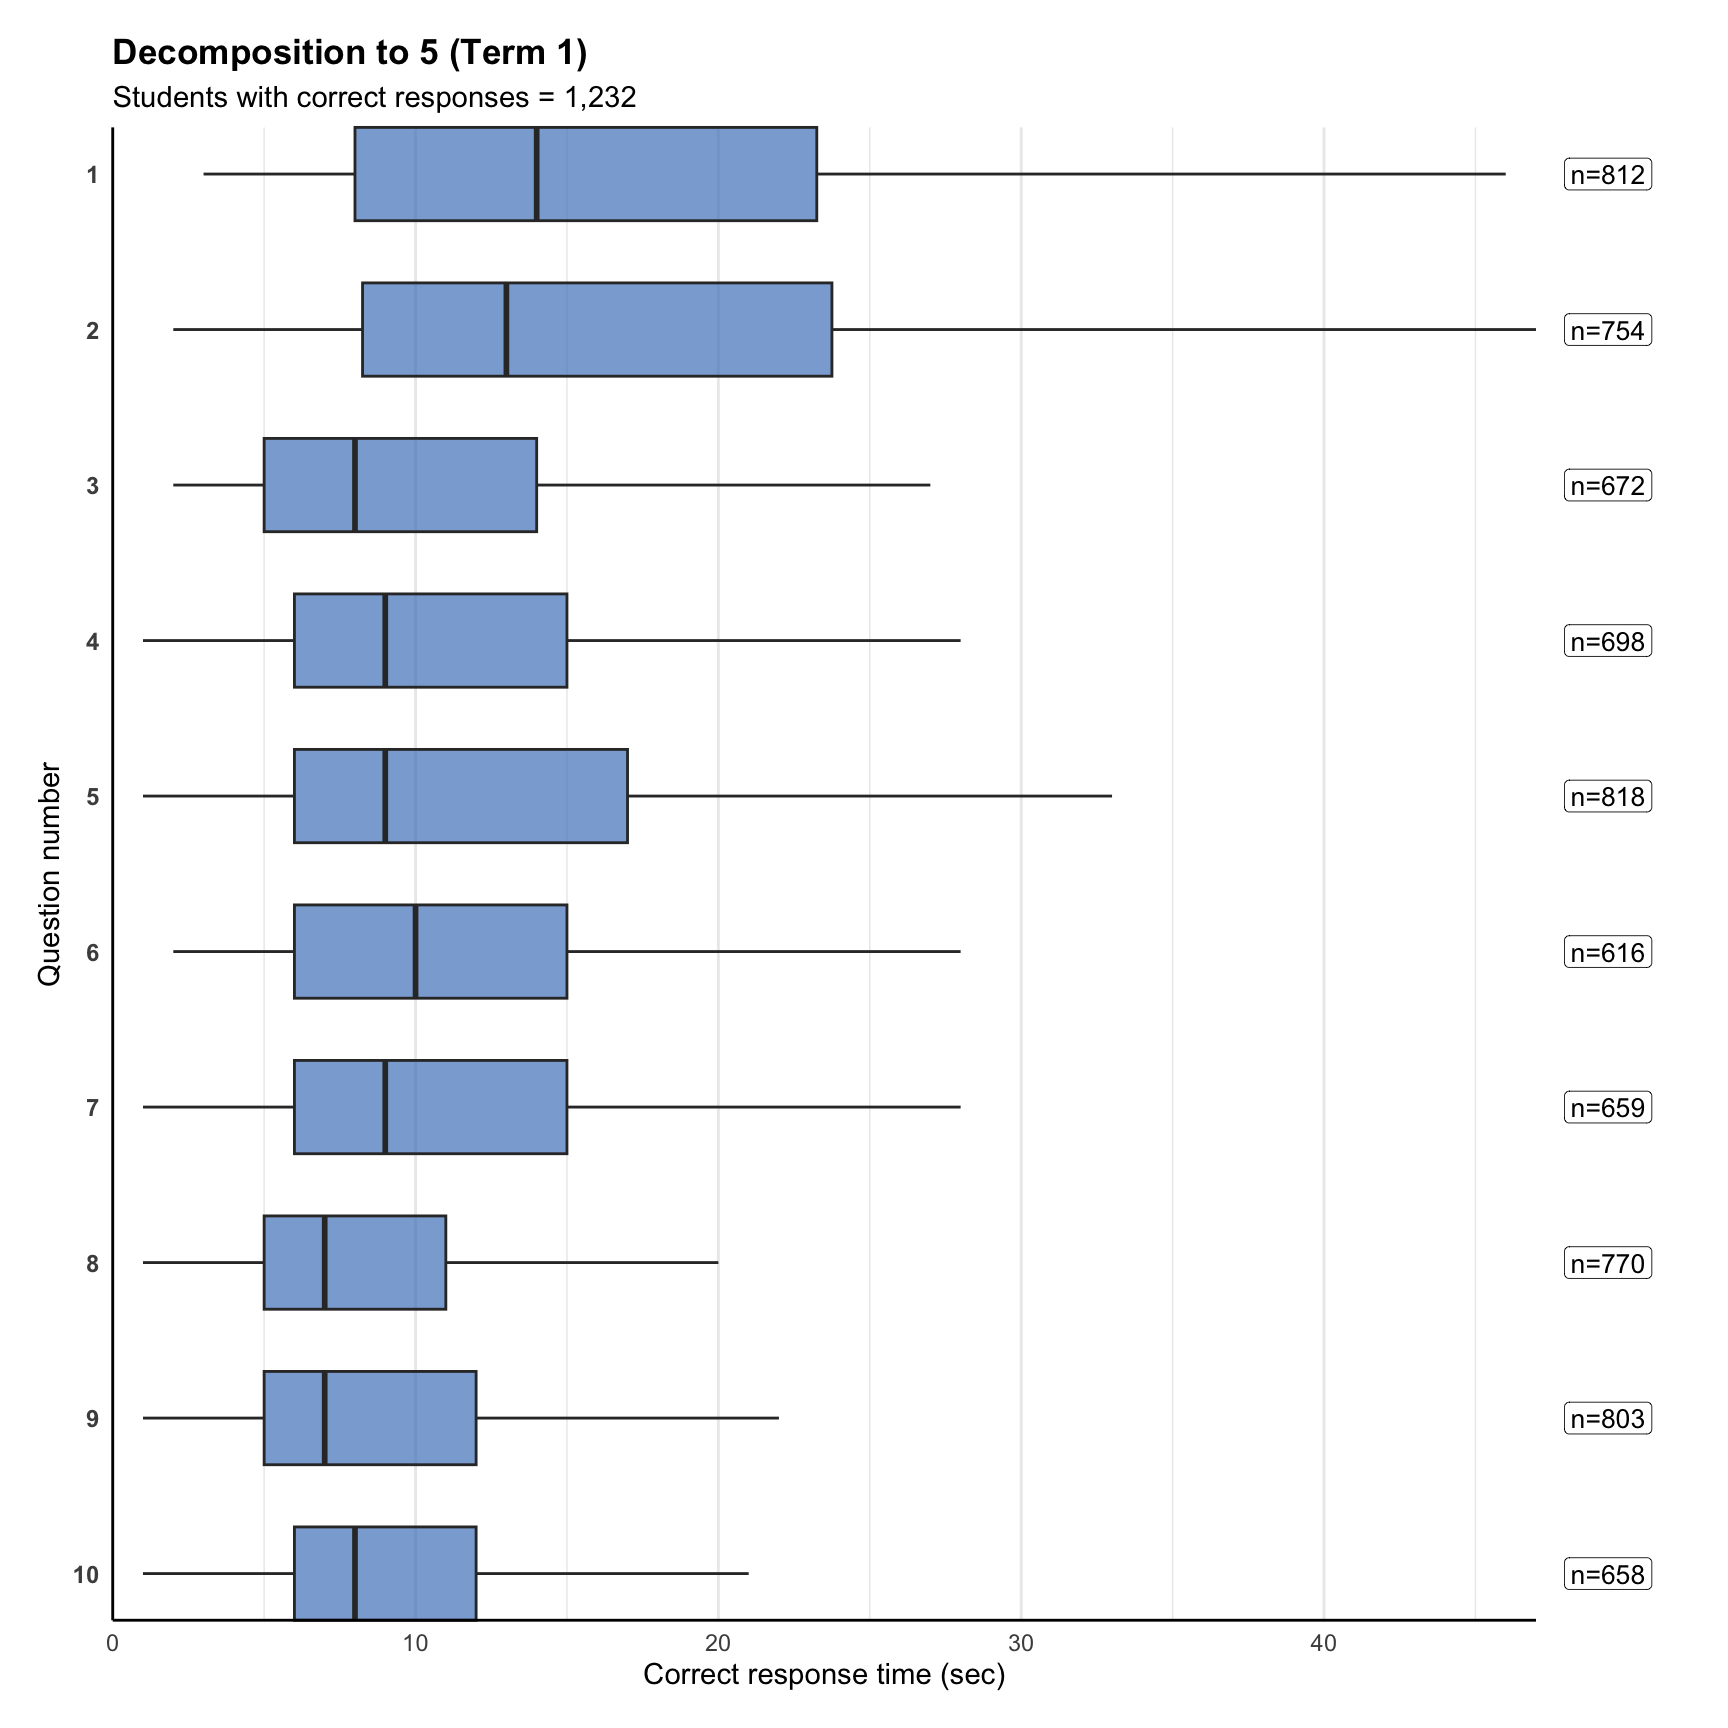
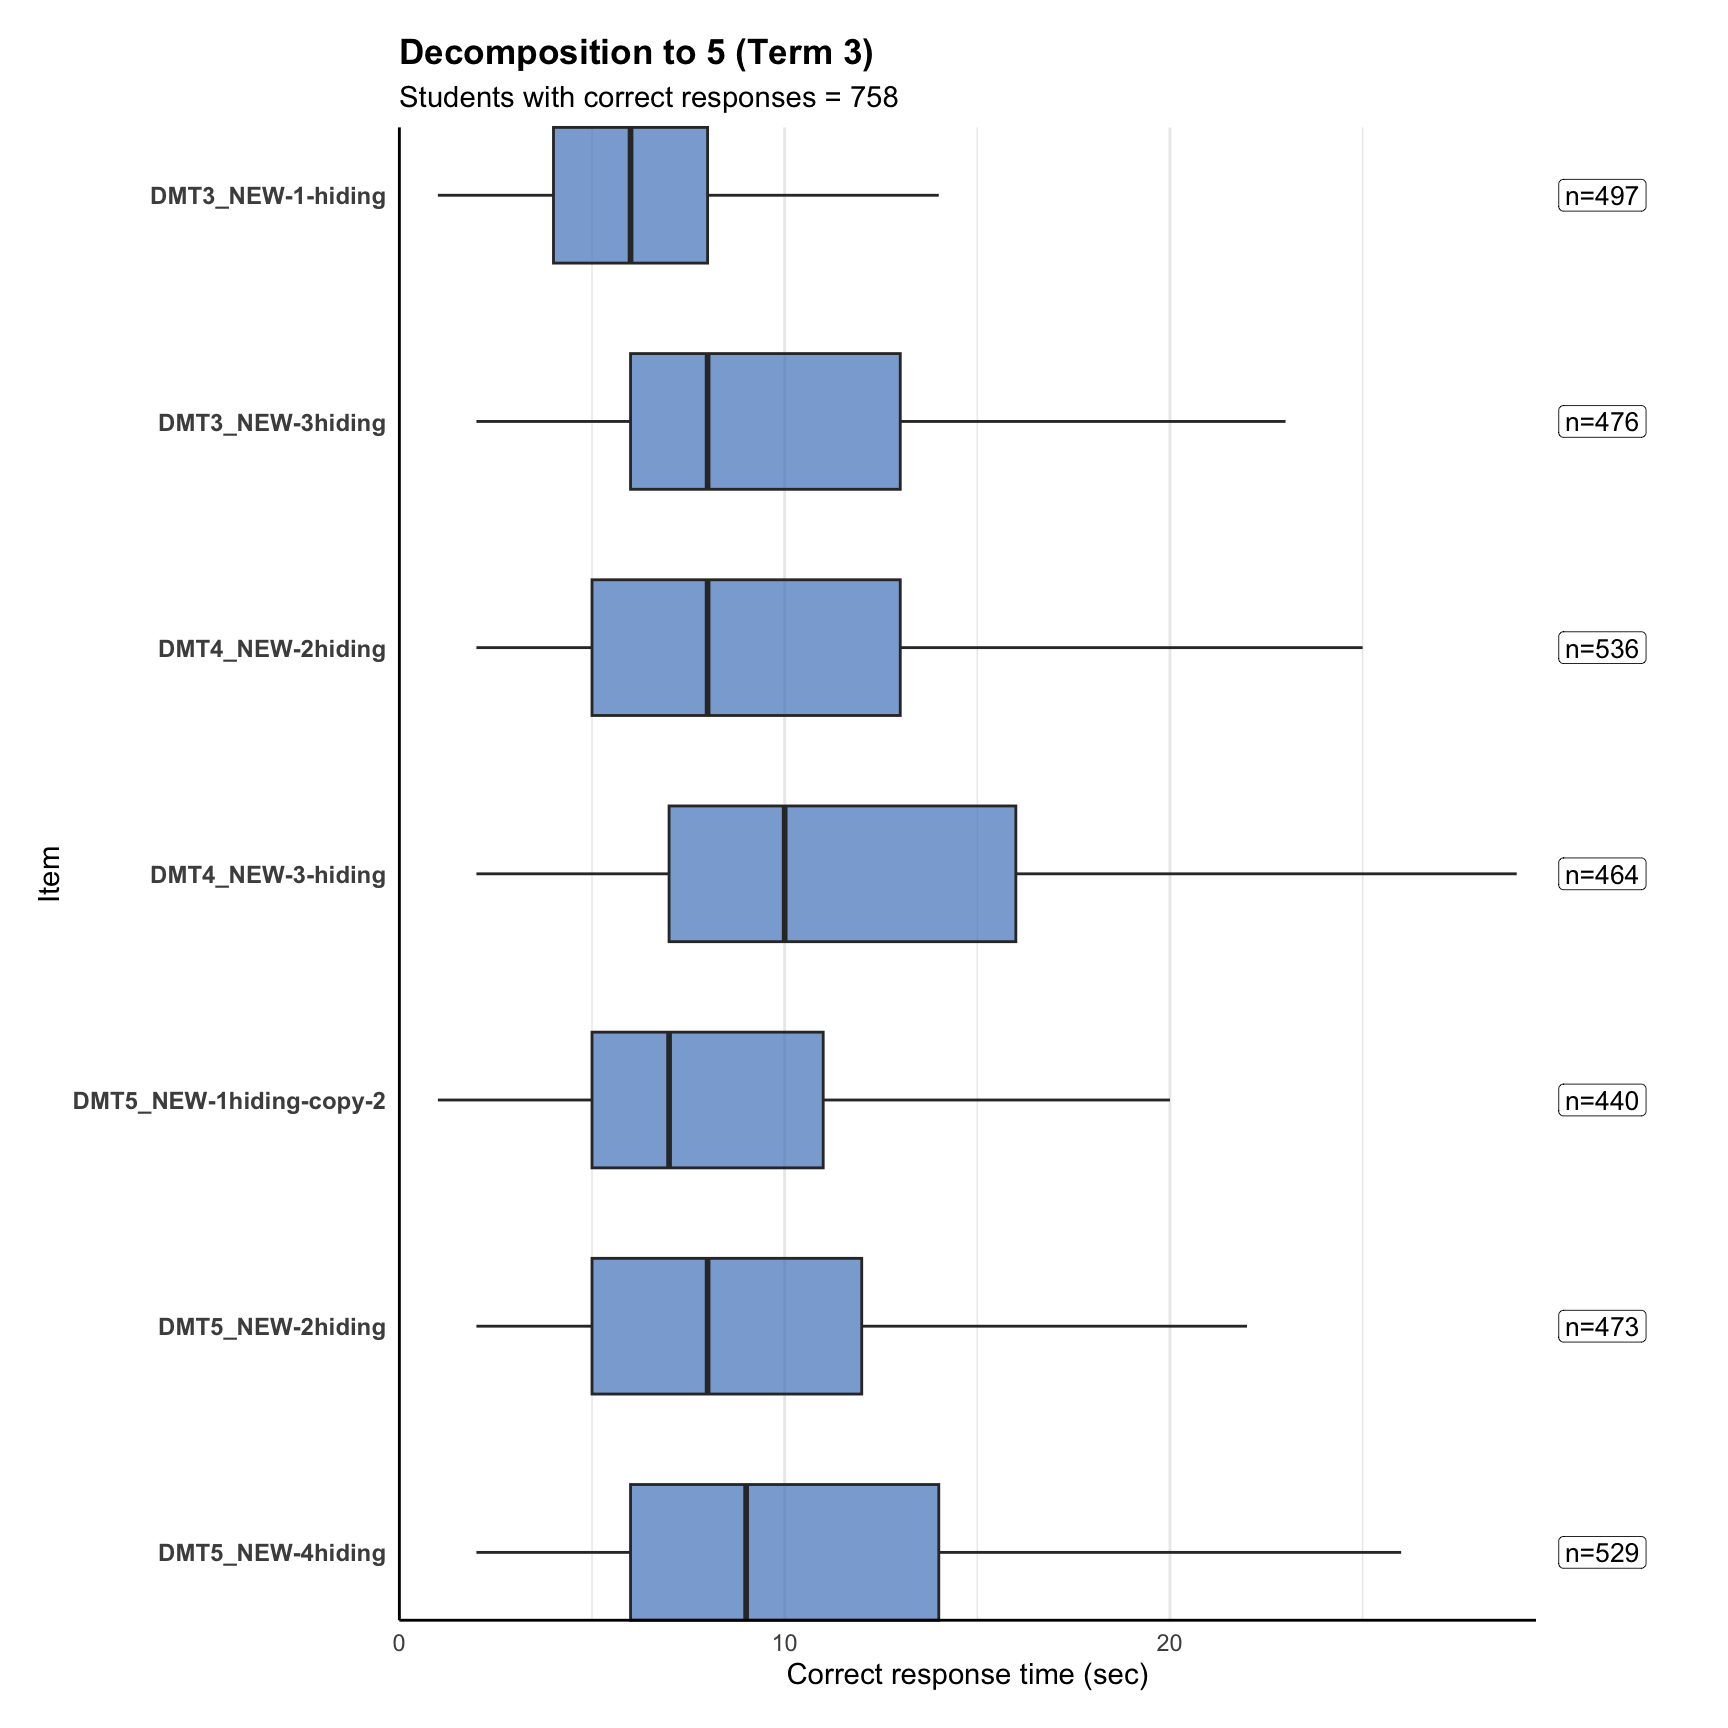
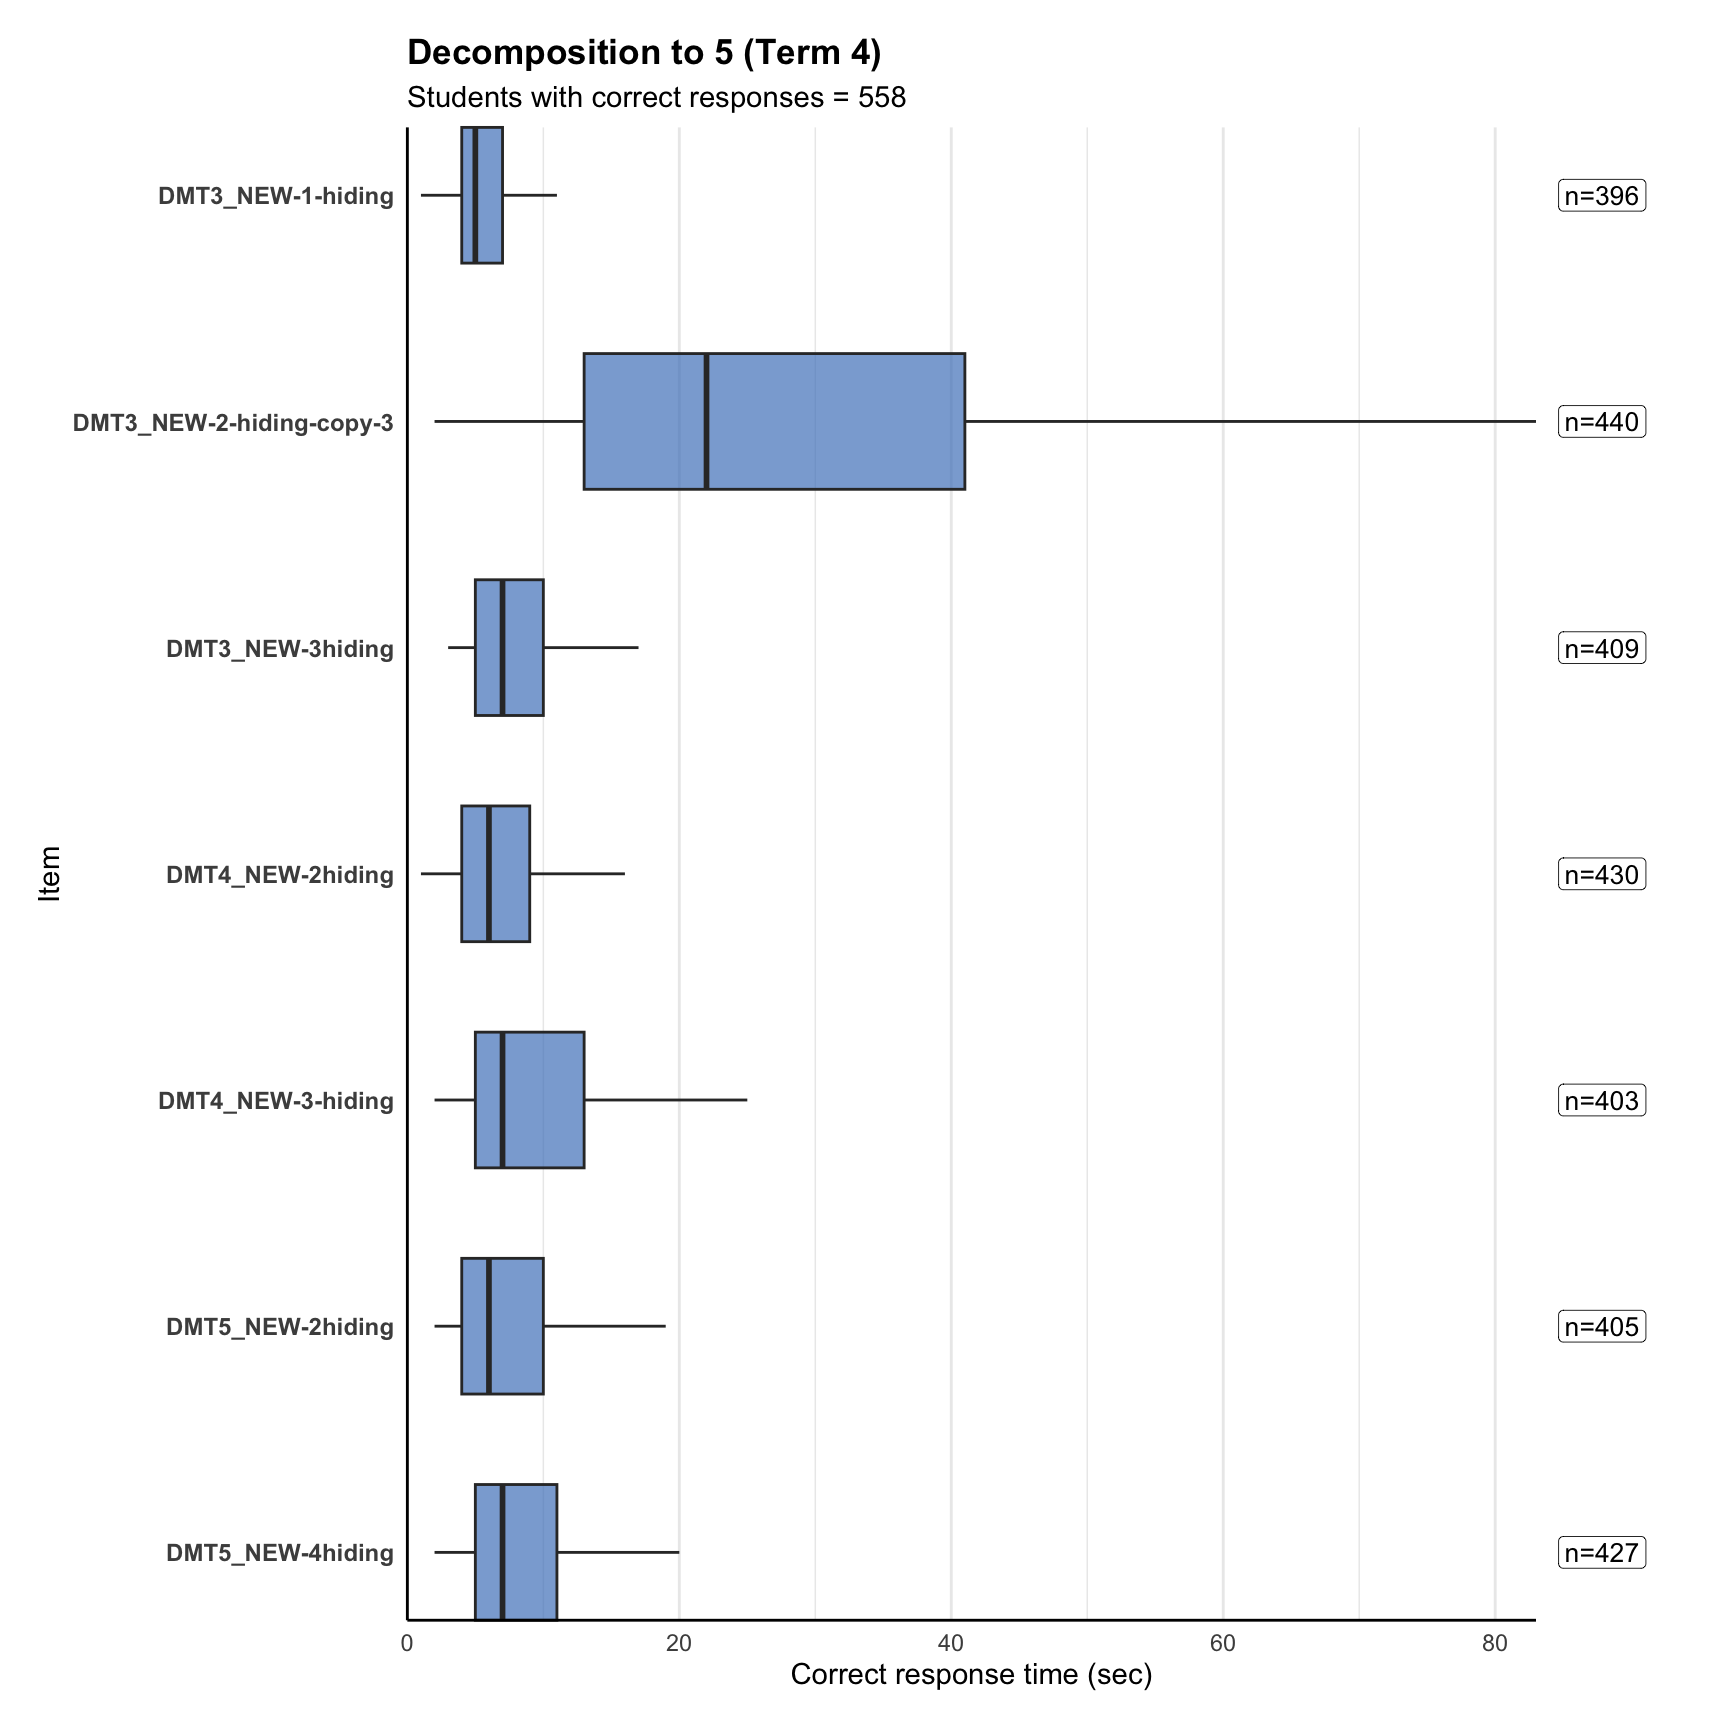
4. Response time distribution
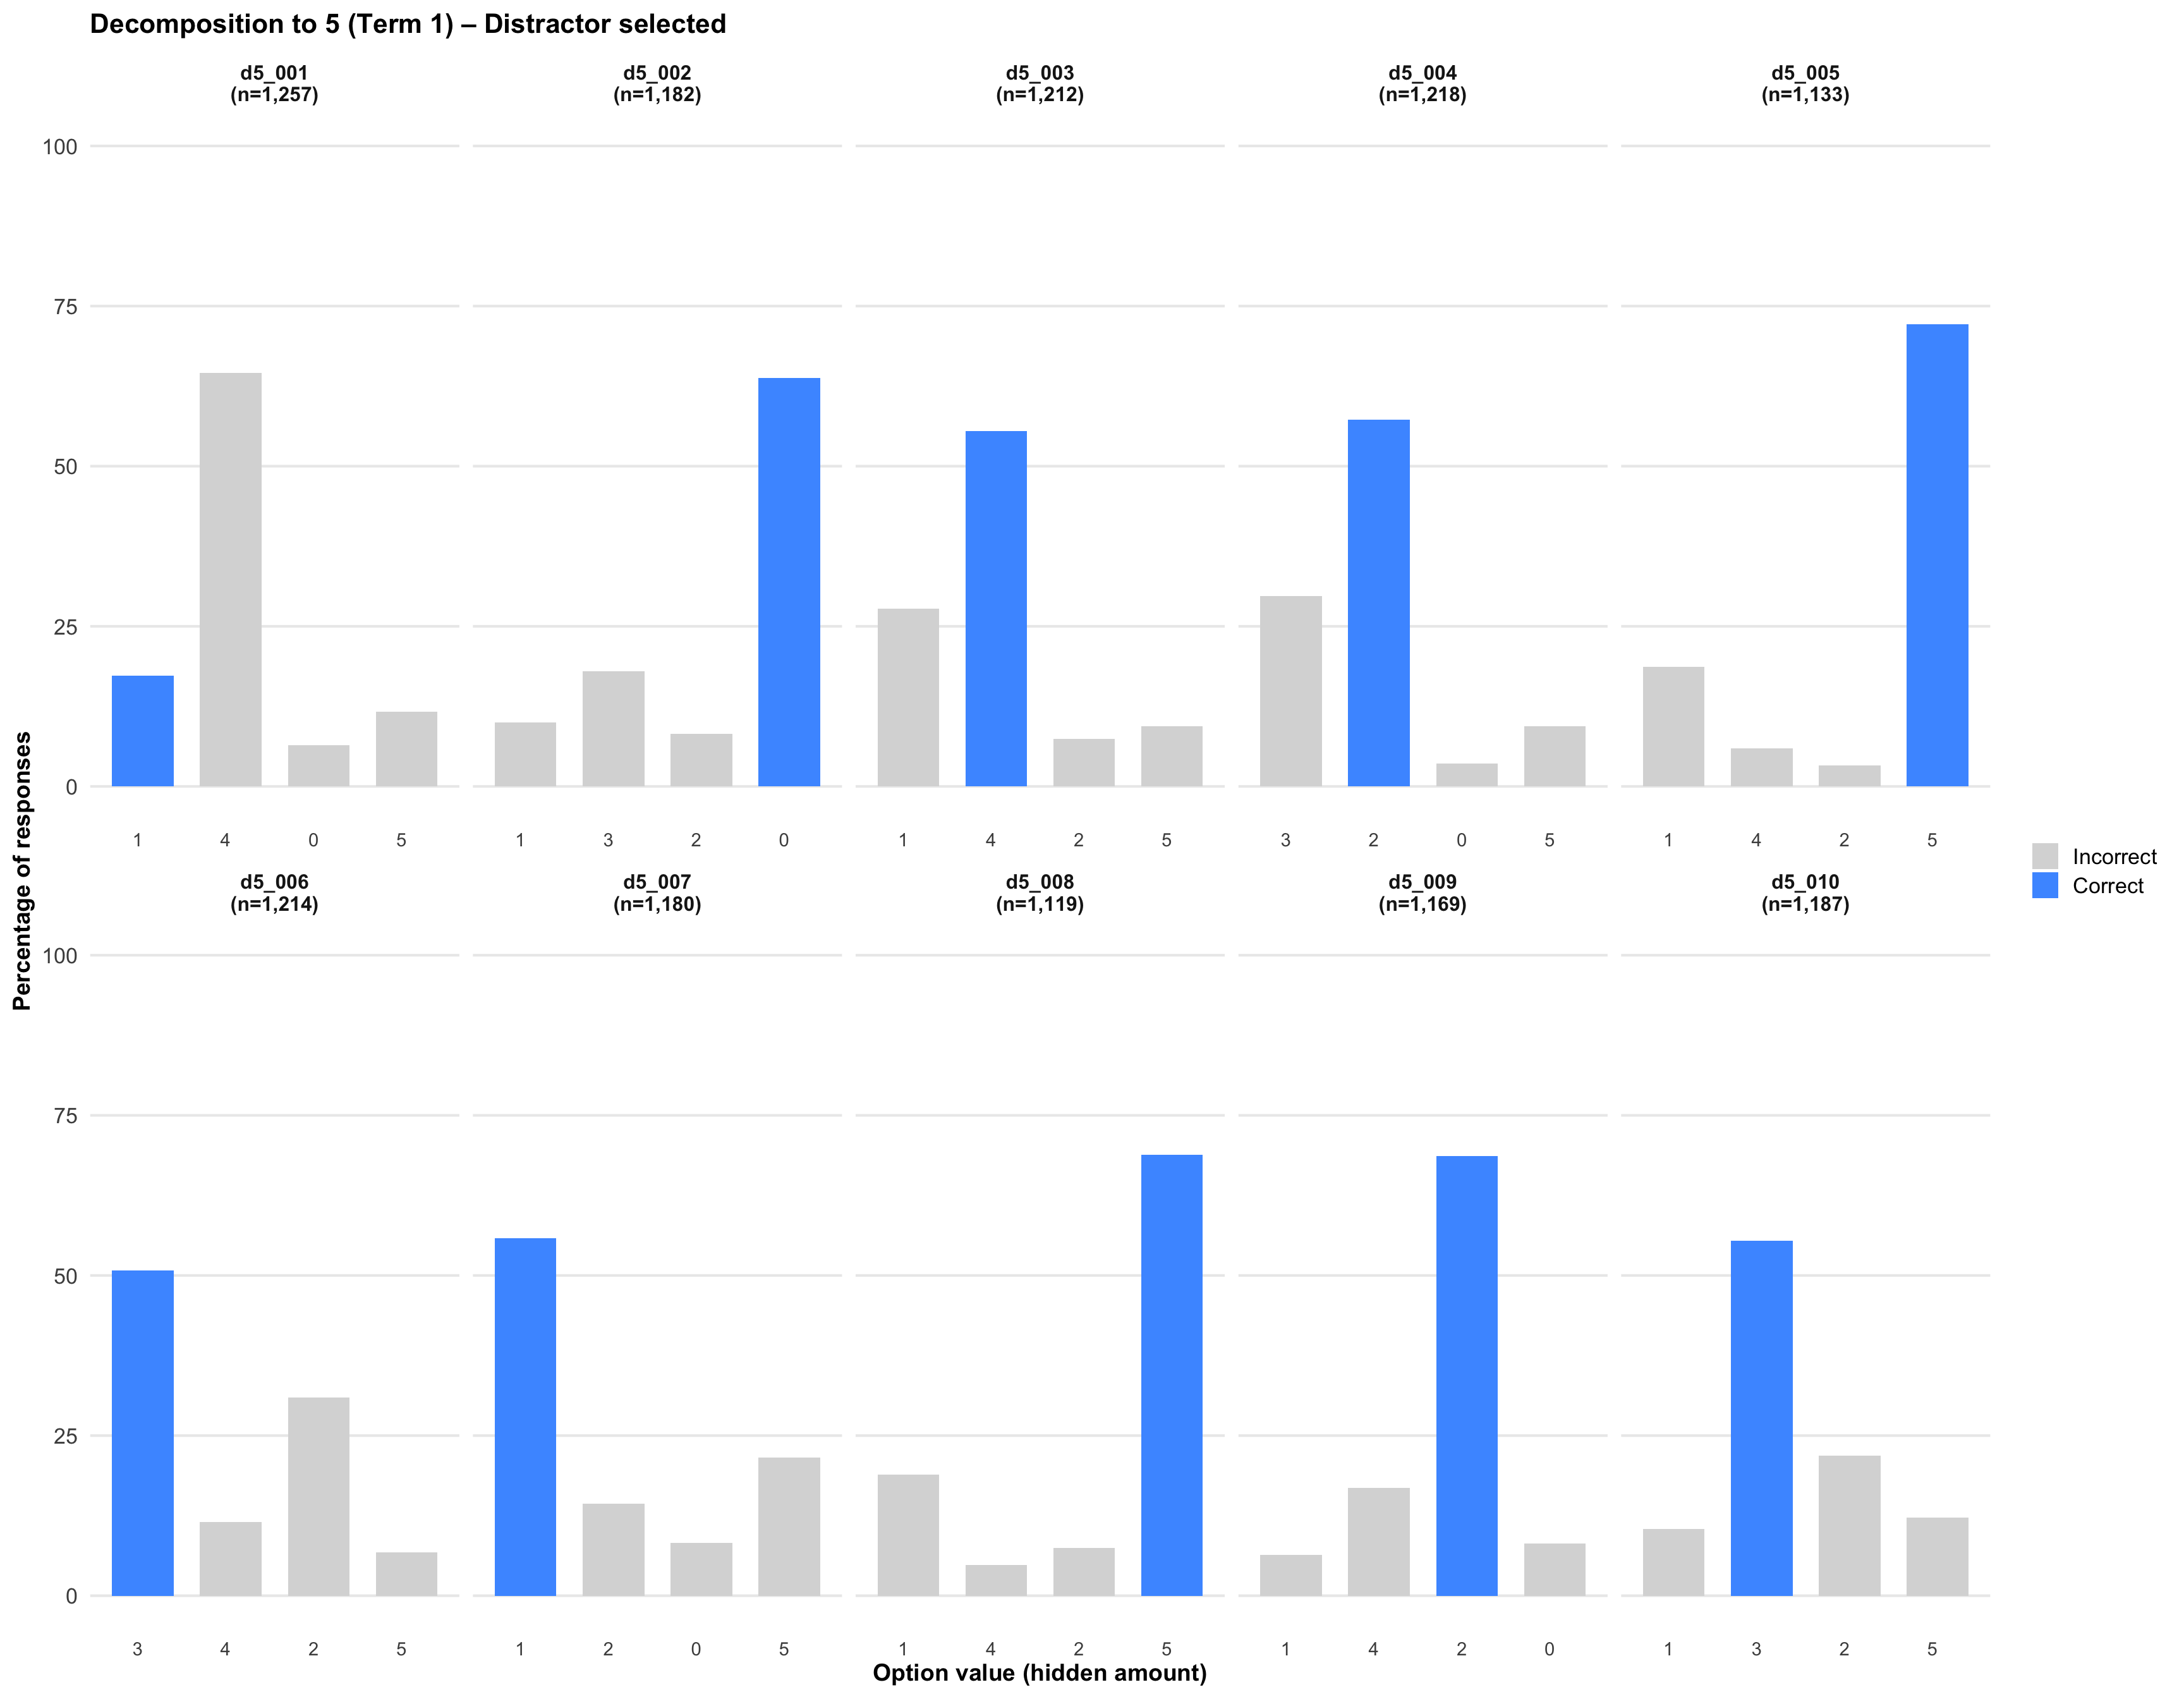
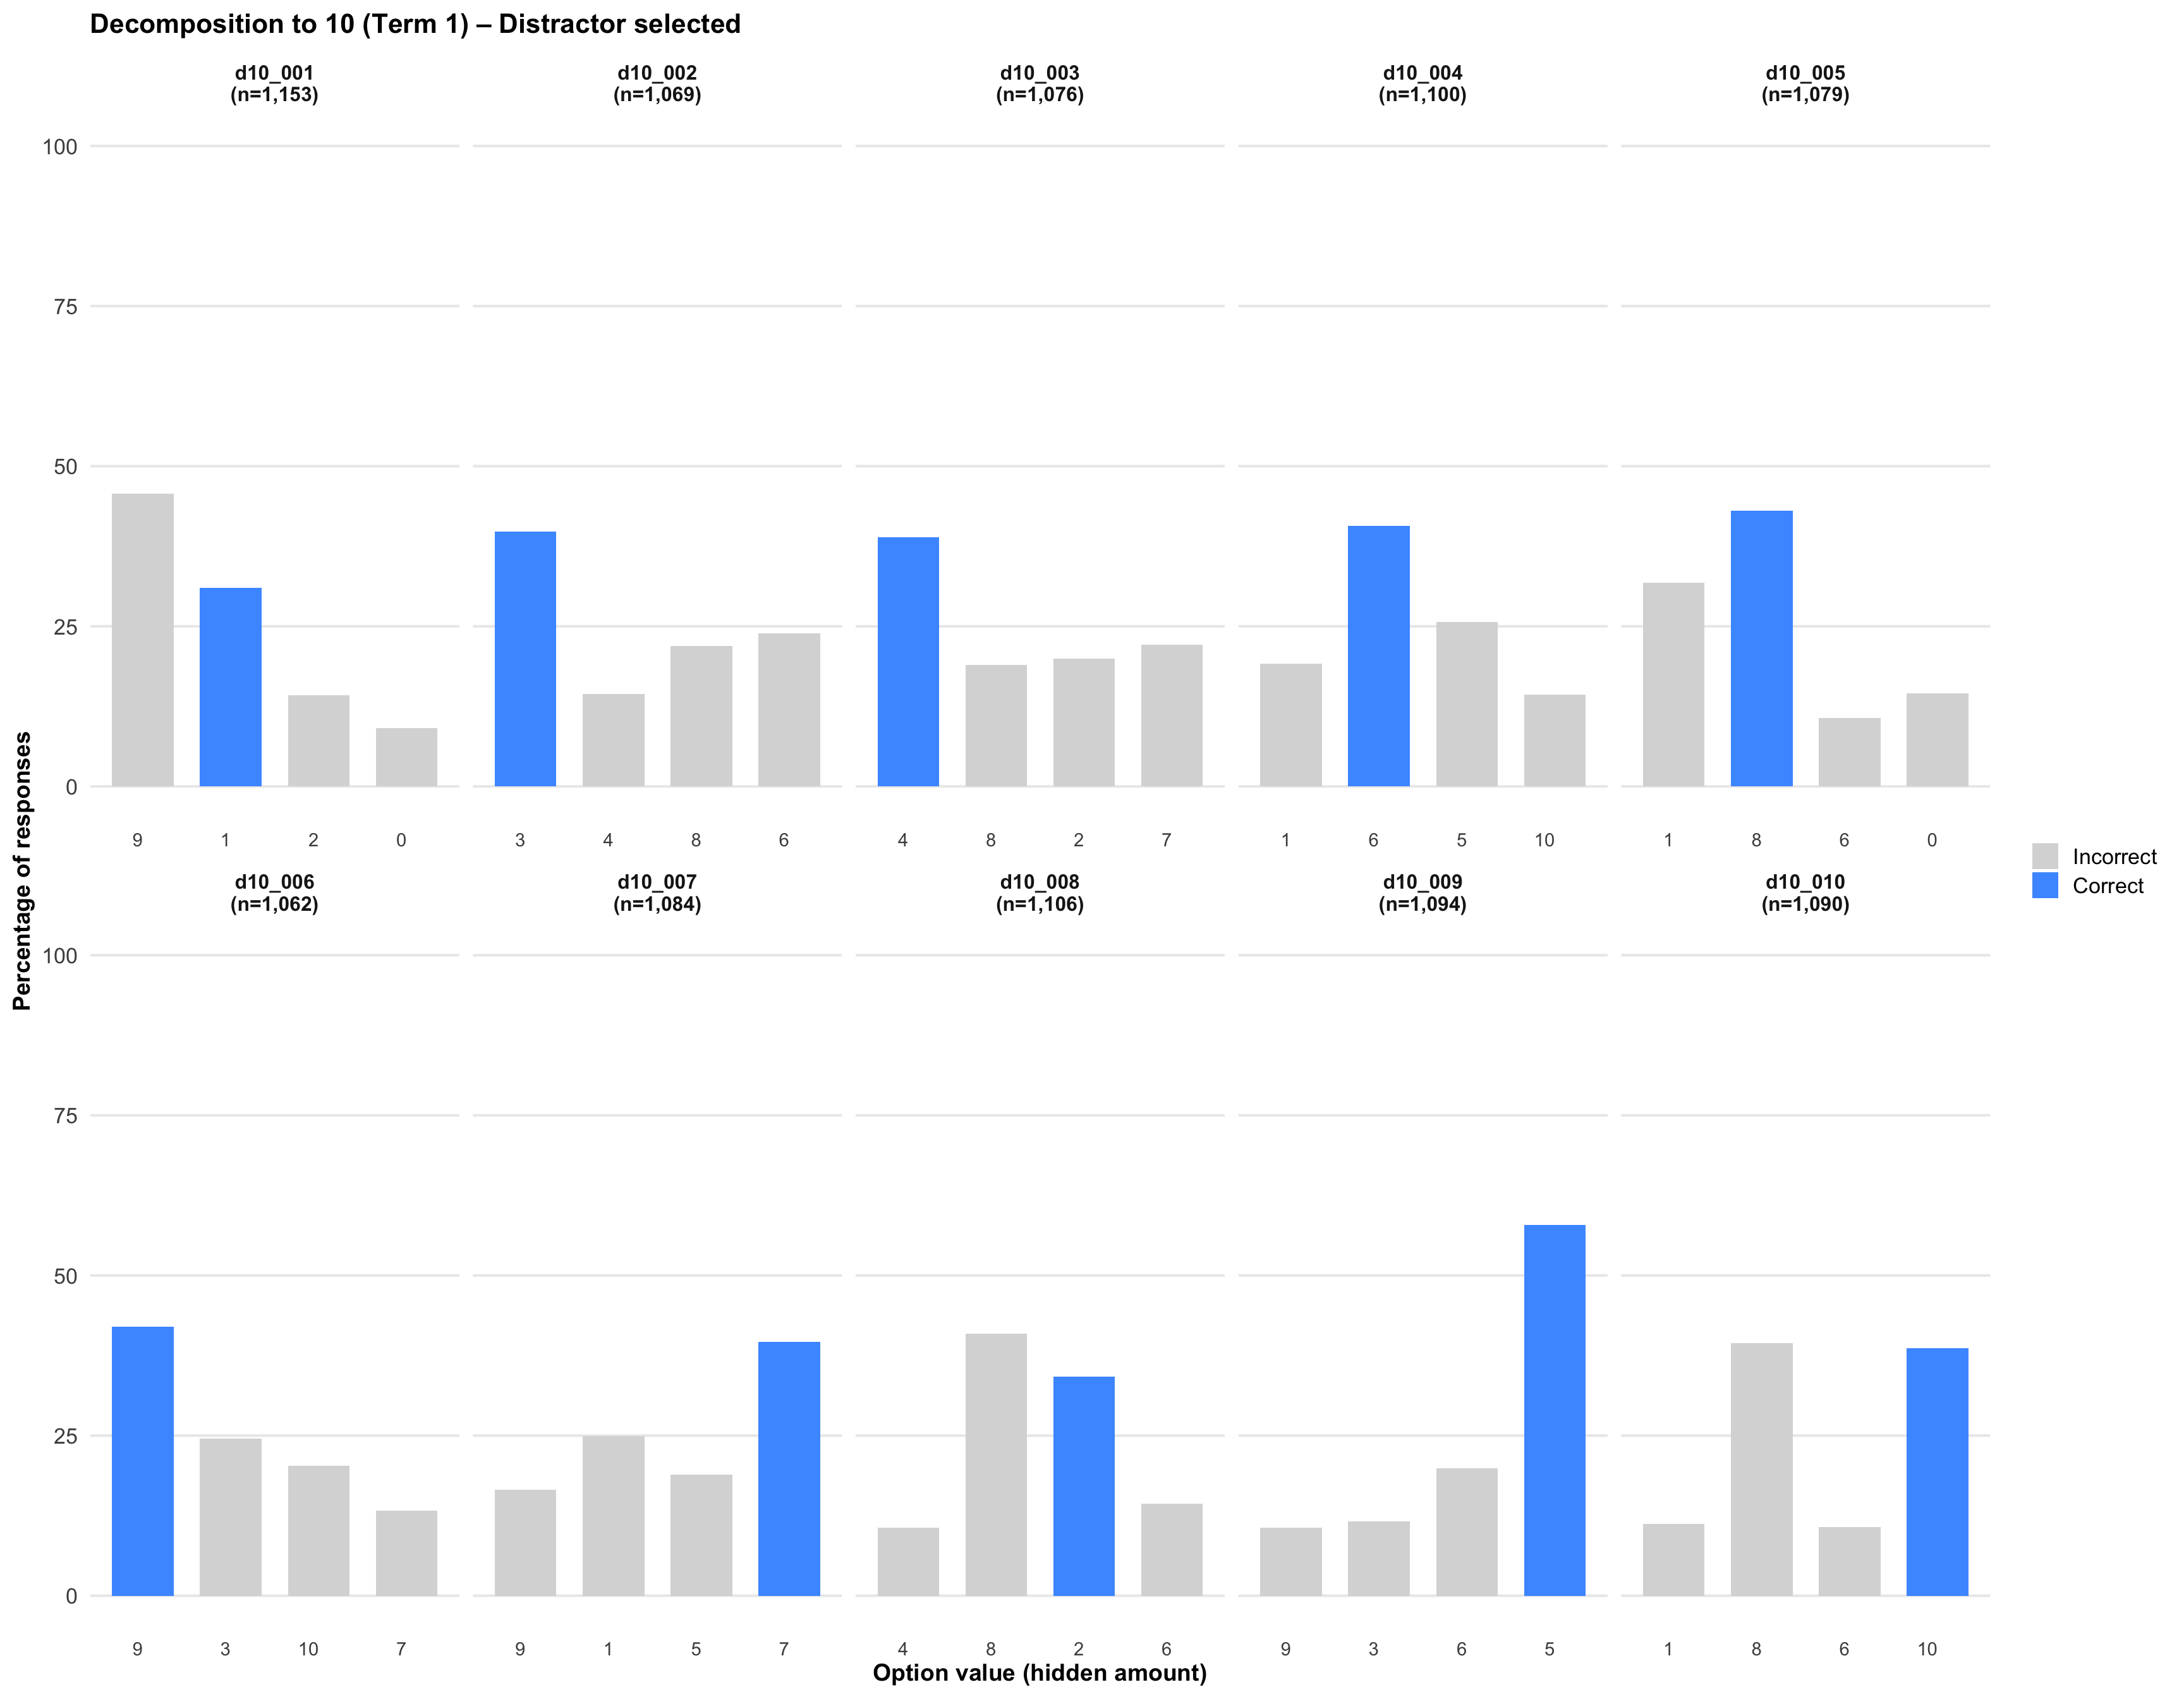
5. Distractor selected
Click on any plot to view an enlarged version in a lightbox popup.
No distractor data (dictionary coverage not available for these Term 3 items).
No distractor data (dictionary coverage not available for these Term 3 items).
No distractor data (dictionary coverage not available for these Term 3 items).
No distractor data (dictionary coverage not available for these Term 3 items).
6. Item statistics
Item discrimination (point-biserial) measures how well an item separates higher-ability from lower-ability students. Values above ~0.3 are typically “good”, below ~0.2 “weak”. In timed tests, late items can look artificially strong because only fast/able students reach them.
|
|
Correct response time (sec)
|
|
|
Question
|
Task
|
Target (btn)
|
No. response
|
% Correct
|
Most common error
|
Median RT
|
95th RT
|
Item discrim.
|
|
1
|
5-4
|
1 (btn-1)
|
1257
|
64.6
|
1 (btn-1)
|
14
|
46.00
|
0.58
|
|
2
|
5-5
|
0 (btn-3)
|
1182
|
63.8
|
3 (btn-2)
|
13
|
49.00
|
0.53
|
|
3
|
5-1
|
4 (btn-4)
|
1212
|
55.4
|
1 (btn-3)
|
8
|
31.00
|
0.68
|
|
4
|
5-3
|
2 (btn-2)
|
1218
|
57.3
|
3 (btn-4)
|
9
|
35.15
|
0.63
|
|
5
|
5-0
|
5 (btn-3)
|
1133
|
72.2
|
1 (btn-1)
|
9
|
40.00
|
0.42
|
|
6
|
5-2
|
3 (btn-1)
|
1214
|
50.7
|
2 (btn-3)
|
10
|
33.00
|
0.59
|
|
7
|
5-4
|
1 (btn-4)
|
1180
|
55.8
|
5 (btn-3)
|
9
|
32.10
|
0.63
|
|
8
|
5-0
|
5 (btn-2)
|
1119
|
68.8
|
1 (btn-1)
|
7
|
24.00
|
0.47
|
|
9
|
5-3
|
2 (btn-3)
|
1169
|
68.7
|
4 (btn-4)
|
7
|
26.90
|
0.48
|
|
10
|
5-2
|
3 (btn-4)
|
1187
|
55.4
|
2 (btn-1)
|
8
|
23.00
|
0.66
|
|
|
Correct response time (sec)
|
|
|
Item ID
|
Task
|
Target (btn)
|
No. response
|
% Correct
|
Most common error
|
Median RT
|
95th RT
|
Item discrim.
|
|
DMT5-1-hiding
|
–
|
–
|
722
|
60.9
|
–
|
7
|
22.00
|
0.59
|
|
DMT3-1-hiding
|
–
|
–
|
753
|
66.0
|
–
|
6
|
20.20
|
0.62
|
|
DMT3-3-hiding
|
–
|
–
|
704
|
67.6
|
–
|
8
|
29.25
|
0.49
|
|
DMT4-2-hiding
|
–
|
–
|
726
|
73.8
|
–
|
8
|
28.25
|
0.40
|
|
DMT4-3-hiding
|
–
|
–
|
752
|
61.7
|
–
|
10
|
37.00
|
0.50
|
|
DMT5-2-hiding
|
–
|
–
|
726
|
65.2
|
–
|
8
|
25.00
|
0.67
|
|
DMT5-4-hiding
|
–
|
–
|
739
|
71.6
|
–
|
9
|
30.60
|
0.40
|
|
|
Correct response time (sec)
|
|
|
Item ID
|
Task
|
Target (btn)
|
No. response
|
% Correct
|
Most common error
|
Median RT
|
95th RT
|
Item discrim.
|
|
DMT3-2-hiding
|
–
|
–
|
556
|
79.1
|
–
|
22
|
74.0
|
0.32
|
|
DMT3-1-hiding
|
–
|
–
|
539
|
73.5
|
–
|
5
|
16.0
|
0.67
|
|
DMT3-3-hiding
|
–
|
–
|
533
|
76.7
|
–
|
7
|
26.0
|
0.49
|
|
DMT4-2-hiding
|
–
|
–
|
542
|
79.3
|
–
|
6
|
19.0
|
0.44
|
|
DMT4-3-hiding
|
–
|
–
|
557
|
72.4
|
–
|
7
|
30.0
|
0.63
|
|
DMT5-2-hiding
|
–
|
–
|
545
|
74.3
|
–
|
6
|
19.0
|
0.65
|
|
DMT5-4-hiding
|
–
|
–
|
551
|
77.5
|
–
|
7
|
22.7
|
0.42
|
|
|
Correct response time (sec)
|
|
|
Question
|
Task
|
Target (btn)
|
No. response
|
% Correct
|
Most common error
|
Median RT
|
95th RT
|
Item discrim.
|
|
1
|
10-9
|
1 (btn-2)
|
1153
|
31.0
|
9 (btn-1)
|
24
|
64.40
|
0.44
|
|
2
|
10-7
|
3 (btn-3)
|
1069
|
39.8
|
6 (btn-2)
|
24
|
72.60
|
0.38
|
|
3
|
10-6
|
4 (btn-1)
|
1076
|
38.9
|
7 (btn-4)
|
17
|
57.00
|
0.48
|
|
4
|
10-4
|
6 (btn-3)
|
1100
|
40.7
|
5 (btn-1)
|
14
|
49.00
|
0.52
|
|
5
|
10-2
|
8 (btn-2)
|
1079
|
43.0
|
1 (btn-4)
|
11
|
42.00
|
0.56
|
|
6
|
10-1
|
9 (btn-1)
|
1062
|
42.0
|
3 (btn-2)
|
9
|
36.50
|
0.63
|
|
7
|
10-3
|
7 (btn-4)
|
1084
|
39.7
|
1 (btn-3)
|
11
|
40.00
|
0.57
|
|
8
|
10-8
|
2 (btn-1)
|
1106
|
34.2
|
8 (btn-3)
|
13
|
42.15
|
0.56
|
|
9
|
10-5
|
5 (btn-2)
|
1094
|
57.9
|
6 (btn-3)
|
8
|
28.00
|
0.18
|
|
10
|
10-0
|
10 (btn-4)
|
1090
|
38.6
|
8 (btn-1)
|
11
|
32.00
|
0.47
|
|
|
Correct response time (sec)
|
|
|
Item ID
|
Task
|
Target (btn)
|
No. response
|
% Correct
|
Most common error
|
Median RT
|
95th RT
|
Item discrim.
|
|
DMT5-2-hiding
|
–
|
–
|
604
|
55.8
|
–
|
6
|
19.0
|
0.47
|
|
DMT5-4-hiding
|
–
|
–
|
619
|
77.2
|
–
|
8
|
28.0
|
0.39
|
|
DMT10-3-hiding
|
–
|
–
|
596
|
46.1
|
–
|
13
|
32.0
|
0.40
|
|
DMT10-6-hiding
|
–
|
–
|
624
|
48.6
|
–
|
11
|
37.8
|
0.45
|
|
DMT8-5-hiding
|
–
|
–
|
619
|
48.9
|
–
|
24
|
65.9
|
0.34
|
|
DMT8-7-hiding
|
–
|
–
|
613
|
70.0
|
–
|
14
|
46.0
|
0.36
|
|
|
Correct response time (sec)
|
|
|
Item ID
|
Task
|
Target (btn)
|
No. response
|
% Correct
|
Most common error
|
Median RT
|
95th RT
|
Item discrim.
|
|
DMT5-2-hiding
|
–
|
–
|
473
|
66.8
|
–
|
6
|
20.0
|
0.53
|
|
DMT5-4-hiding
|
–
|
–
|
496
|
80.0
|
–
|
7
|
20.0
|
0.43
|
|
DMT3-2-hiding
|
–
|
–
|
510
|
76.3
|
–
|
15
|
52.6
|
0.17
|
|
DMT10-3-hiding
|
–
|
–
|
475
|
52.2
|
–
|
13
|
36.0
|
0.49
|
|
DMT10-6-hiding
|
–
|
–
|
498
|
52.2
|
–
|
10
|
36.0
|
0.53
|
|
DMT8-5-hiding
|
–
|
–
|
512
|
51.2
|
–
|
17
|
47.9
|
0.38
|
|
DMT8-7-hiding
|
–
|
–
|
503
|
73.8
|
–
|
11
|
41.0
|
0.46
|
7. Item correct response time
7. Age and Response Accuracy Analysis
This section examines how student age relates to response accuracy patterns on decomposition tasks. The analysis addresses two research questions:
- Are older children less likely to choose the visible quantity when it’s incorrect?
- Are older children more likely to give exact answers vs. being off by 1 or 2?
Data Processing
For each student response, we calculate:
- Age at testing: Student’s age in years and months at the time of their test (using
attempted_at timestamp)
- Response accuracy categories (mutually exclusive):
- Exact: Response matches correct answer (difference = 0)
- Off by 1: Response differs by exactly 1 from correct answer
- Off by 2: Response differs by exactly 2 from correct answer
- Off by 3+: Response differs by 3 or more from correct answer
- Chose visible flag: TRUE if student selected the visible quantity when it was incorrect
These metrics are aggregated to the student × term level, showing the percentage of items in each accuracy category.
Processing decomposition responses for age analysis...
       exact     off_by_1     off_by_2 off_by_3plus         <NA>
       34810         8663         5810         6833        10930
Student × term records with valid age data: 4943
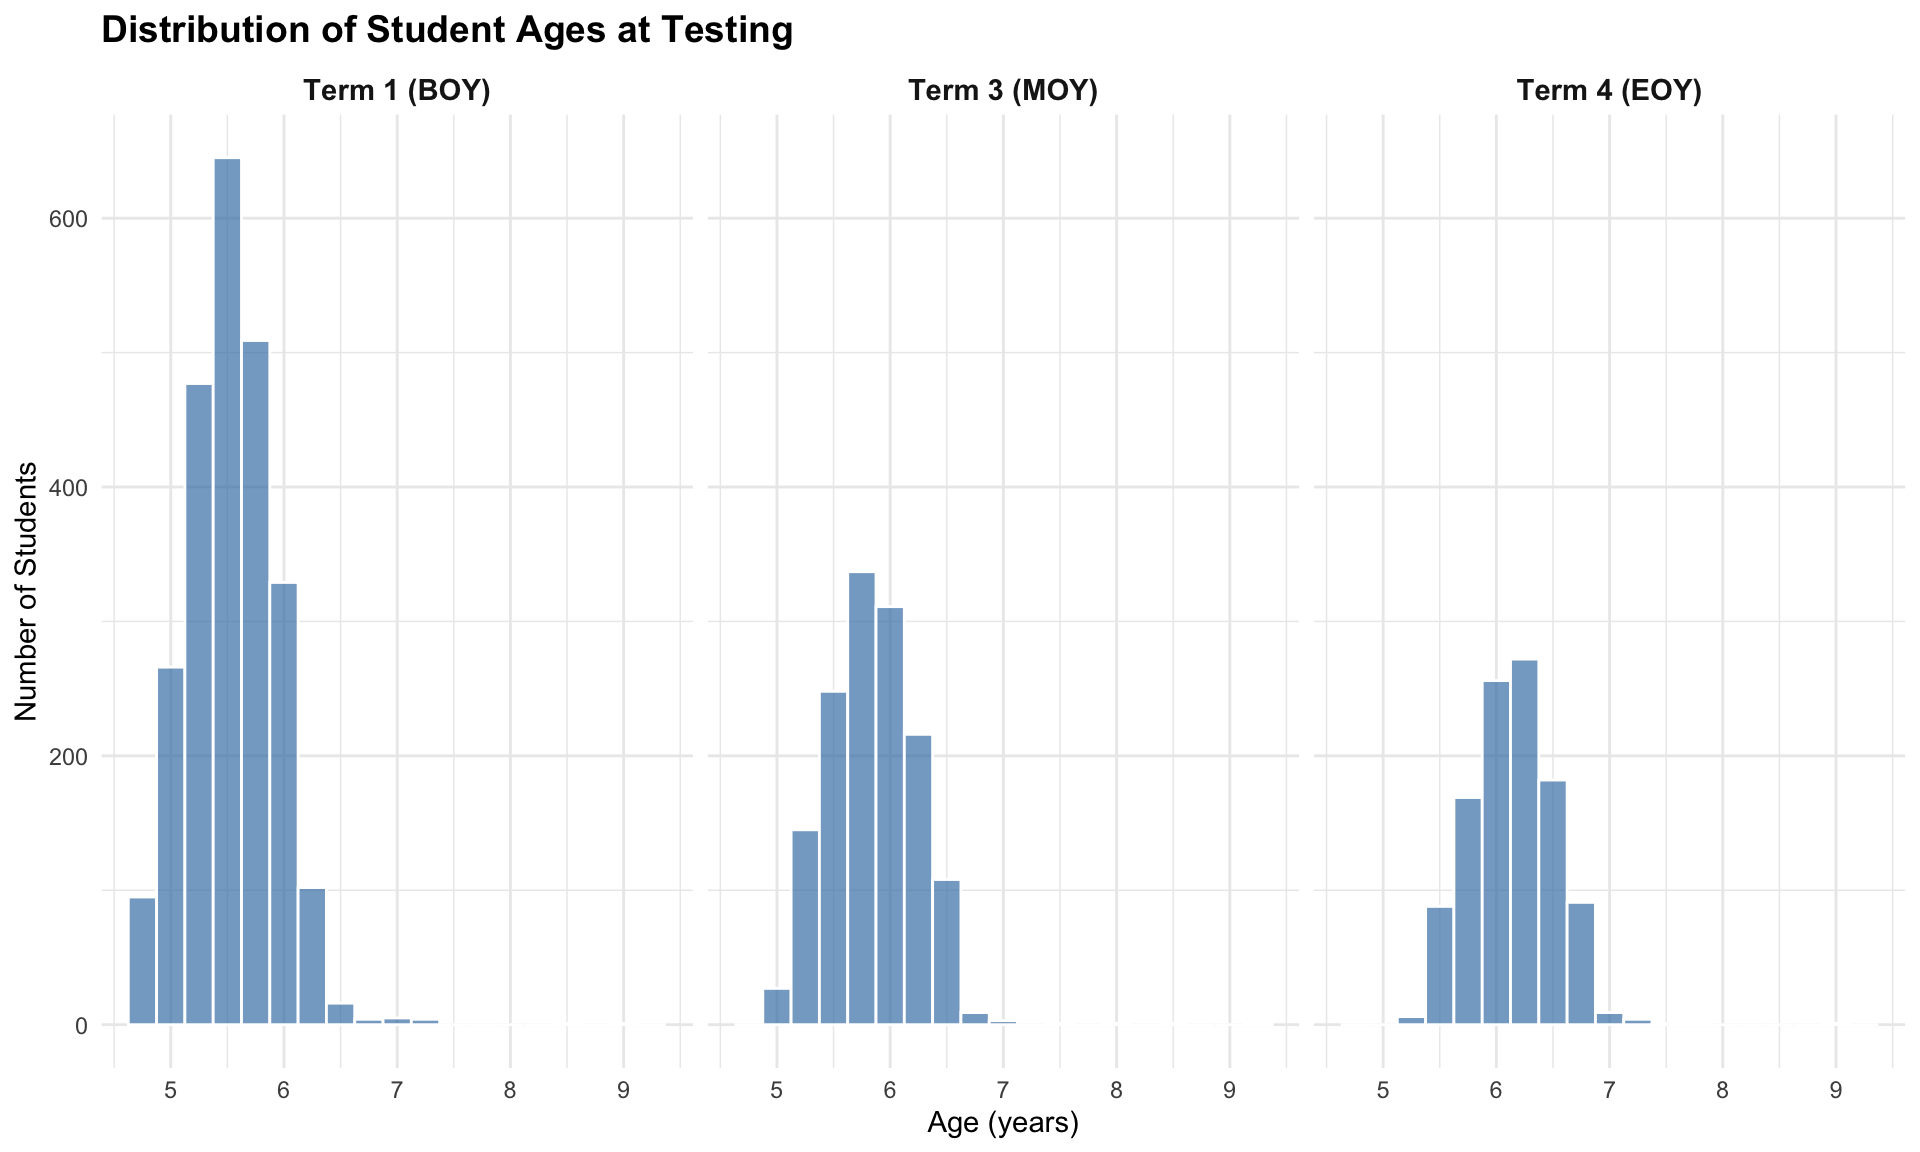
7.1 Age Distribution Overview
Age distribution by testing term
| Term 1 (BOY) |
2454 |
4 yrs 8 mo - 8 yrs 11 mo |
5 yrs 6 mo |
| Term 3 (MOY) |
1409 |
5 yrs 0 mo - 9 yrs 4 mo |
5 yrs 10 mo |
| Term 4 (EOY) |
1080 |
5 yrs 4 mo - 9 yrs 0 mo |
6 yrs 2 mo |
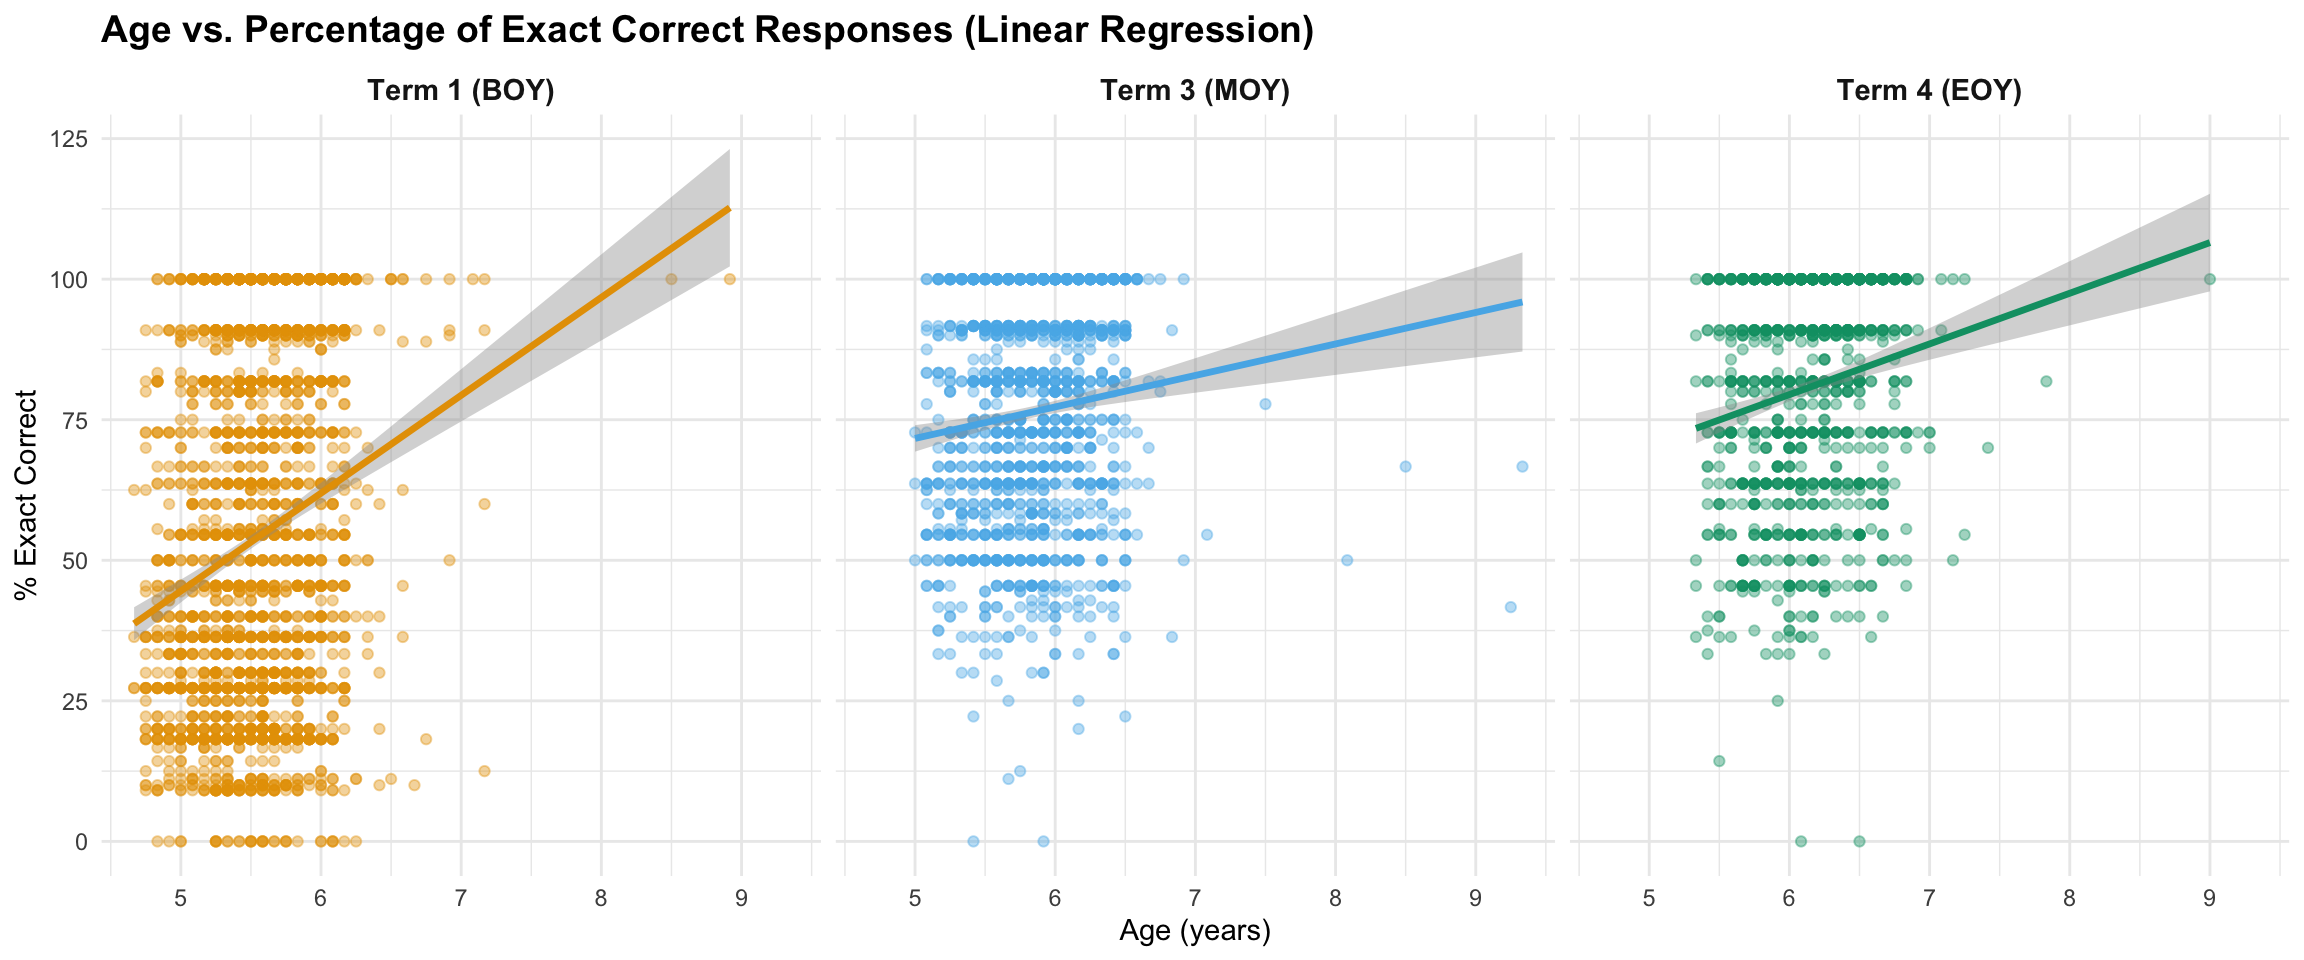
7.2 Age vs. Exact Accuracy
Research Question: Are older children more likely to give exact correct answers?
`geom_smooth()` using formula = 'y ~ x'
Effect Sizes and Practical Significance
Statistical significance (p-values) tells us whether an effect exists, but effect sizes tell us how large and meaningful that effect is. Below we report multiple effect size metrics to provide a comprehensive picture of the relationship between age and accuracy.
Effect Size Interpretation Guidelines:
- Correlation (r):
- Small: 0.10 - 0.29
- Medium: 0.30 - 0.49
- Large: 0.50+
- R² (Variance Explained):
- Small: 1% - 9%
- Medium: 9% - 25%
- Large: 25%+
Enhanced correlation: Age and % exact correct responses
| Term 1 (BOY) |
2454 |
0.219 |
[0.181, 0.256] |
0.048 |
Small |
0 |
*** |
| Term 3 (MOY) |
1409 |
0.116 |
[0.064, 0.167] |
0.013 |
Small |
0 |
*** |
| Term 4 (EOY) |
1080 |
0.176 |
[0.118, 0.233] |
0.031 |
Small |
0 |
*** |
| Note: |
|
|
|
|
|
|
|
| *** p < 0.001, ** p < 0.01, * p < 0.05 |
|
|
|
|
|
|
|
Linear regression: Change in % exact per year of age
| Term 1 (BOY) |
17.41 [14.34, 20.48] |
0.048 |
0.048 |
| Term 3 (MOY) |
5.60 [3.09, 8.11] |
0.013 |
0.013 |
| Term 4 (EOY) |
9.01 [6.00, 12.02] |
0.031 |
0.030 |
| Note: |
|
|
|
| Slope shows percentage point increase in exact accuracy per additional year of age. 95% confidence intervals in brackets. |
|
|
|
Interpretation: The correlation coefficients show the strength of the relationship between age and exact accuracy. R² indicates the proportion of variation in accuracy that is explained by age. The slope from linear regression shows the practical effect: for each additional year of age, exact accuracy increases by the indicated number of percentage points.
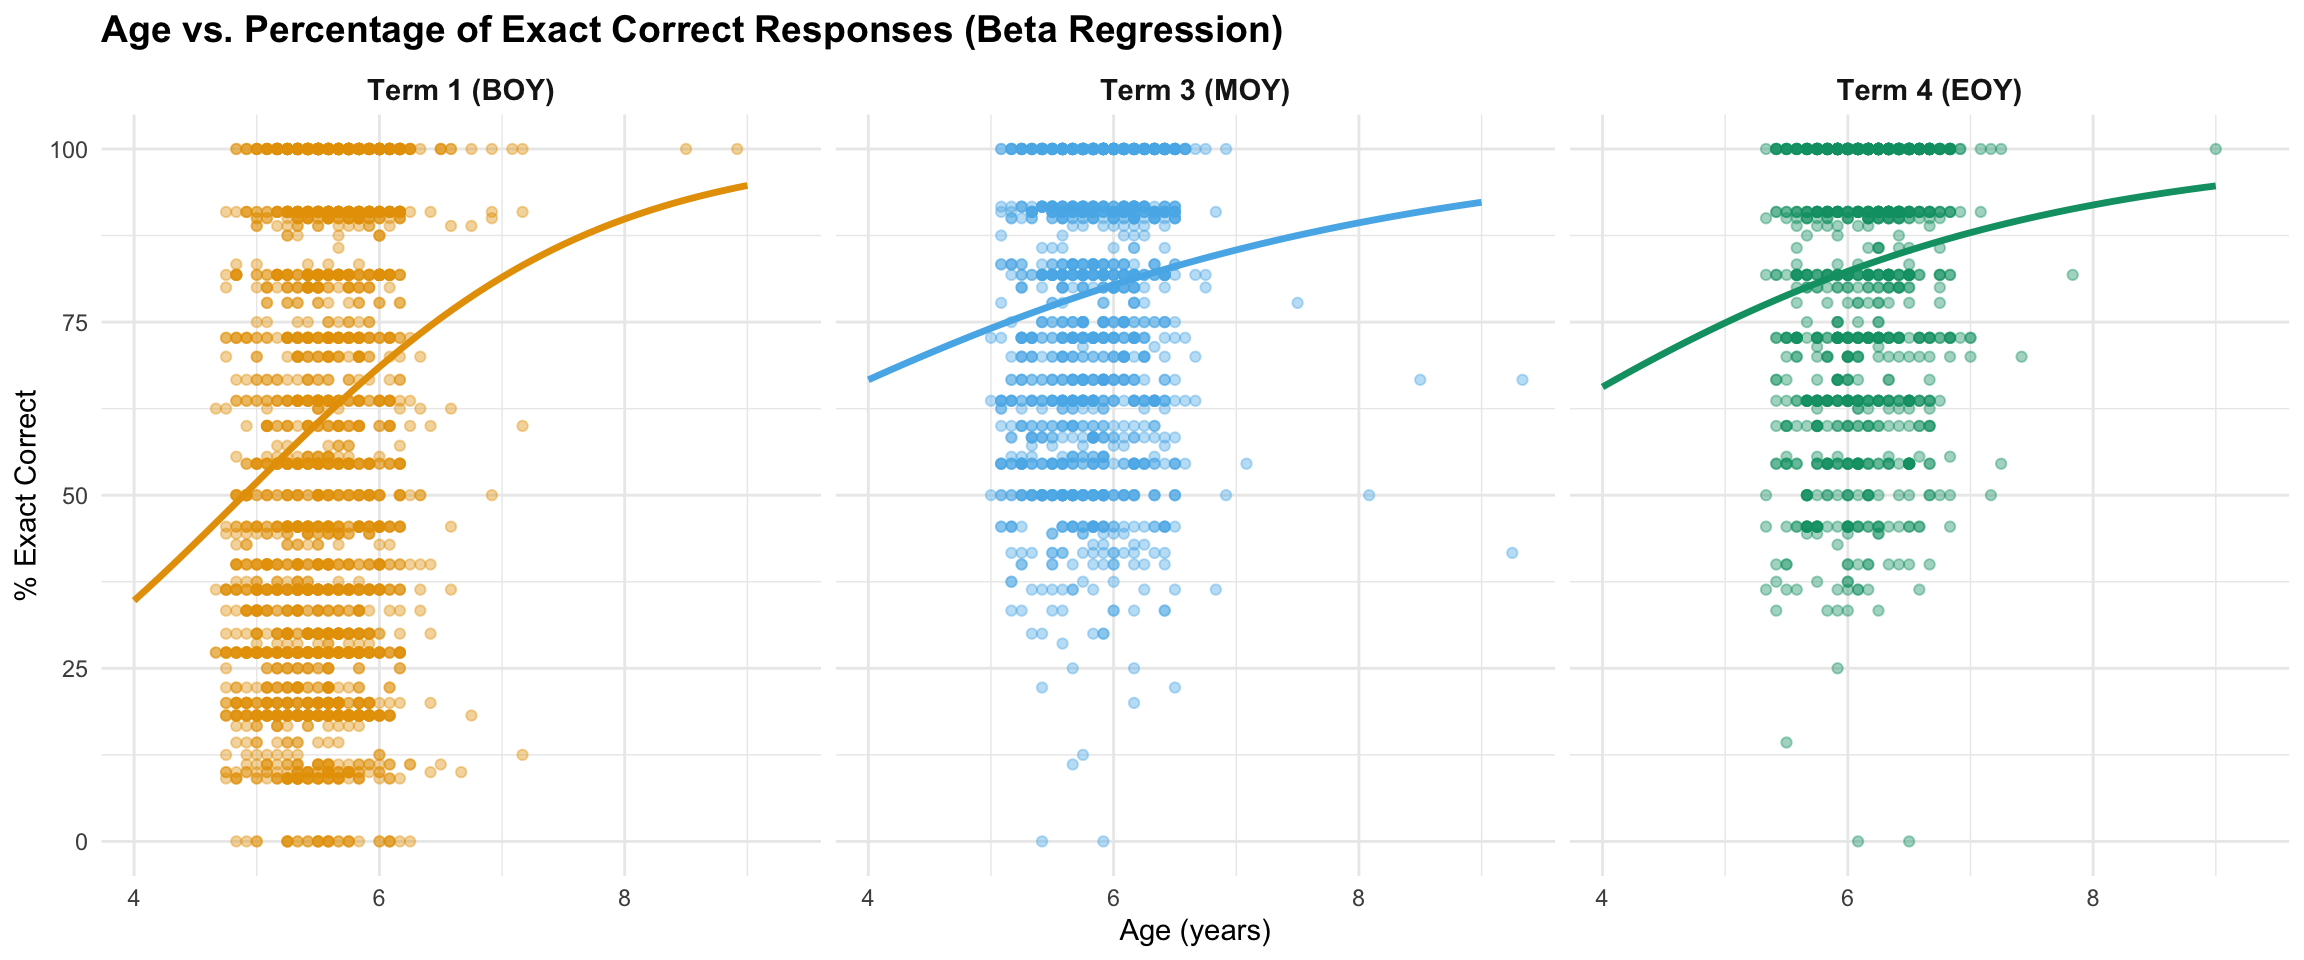
Beta Regression Analysis
Why use beta regression? Accuracy percentages are bounded between 0% and 100%, but standard linear regression assumes outcomes can range from negative infinity to positive infinity. Beta regression is specifically designed for percentage data and provides more accurate estimates when many students score at or near 100% (ceiling effects).
How to read the table below:
- Estimate: The effect of age on the log-odds scale (technical detail for statisticians)
- Marginal Effect: For every additional year of age, accuracy increases by this many percentage points on average
- 95% CI: We’re 95% confident the true effect falls within this range
- Pseudo-R²: Proportion of variation in accuracy explained by age (similar to R² in linear regression)
Beta regression: Age predicting % exact correct responses
| Term 1 (BOY) |
0.704 [0.578, 0.830] |
14.94 |
0.039 |
0 |
*** |
| Term 3 (MOY) |
0.358 [0.216, 0.501] |
5.23 |
0.010 |
0 |
*** |
| Term 4 (EOY) |
0.446 [0.270, 0.622] |
5.34 |
0.022 |
0 |
*** |
| Note: |
|
|
|
|
|
| *** p < 0.001, ** p < 0.01, * p < 0.05. Marginal effect calculated at mean age. |
|
|
|
|
|
Key Finding: Beta regression confirms the correlation results - older children have significantly higher exact accuracy rates. The marginal effects show the practical significance: each additional year of age is associated with a meaningful increase in exact accuracy across all terms.
Comparing Linear and Beta Regression
Both approaches confirm that age positively predicts accuracy, but beta regression provides more appropriate estimates for bounded percentage data.
Comparison of Linear and Beta Regression Results
| Term |
Linear Slope (pp/year) |
Linear R² |
Beta Marginal Effect (pp/year) |
Beta Pseudo-R² |
| Term 1 (BOY) |
17.41 [14.34, 20.48] |
0.048 |
14.94 |
0.039 |
| Term 3 (MOY) |
5.60 [3.09, 8.11] |
0.013 |
5.23 |
0.010 |
| Term 4 (EOY) |
9.01 [6.00, 12.02] |
0.031 |
5.34 |
0.022 |
| Note: |
|
|
|
|
| Both methods show similar effect sizes and lead to the same conclusion: older children perform better. |
|
|
|
|
Key Differences:
- Beta regression typically shows slightly different marginal effects because it better handles the bounded nature of percentage data
- Confidence intervals from beta regression are more reliable for percentage outcomes with ceiling effects
- Both methods lead to the same substantive conclusion: older children have higher exact accuracy rates
- The pseudo-R² from beta regression is comparable to R² from linear regression
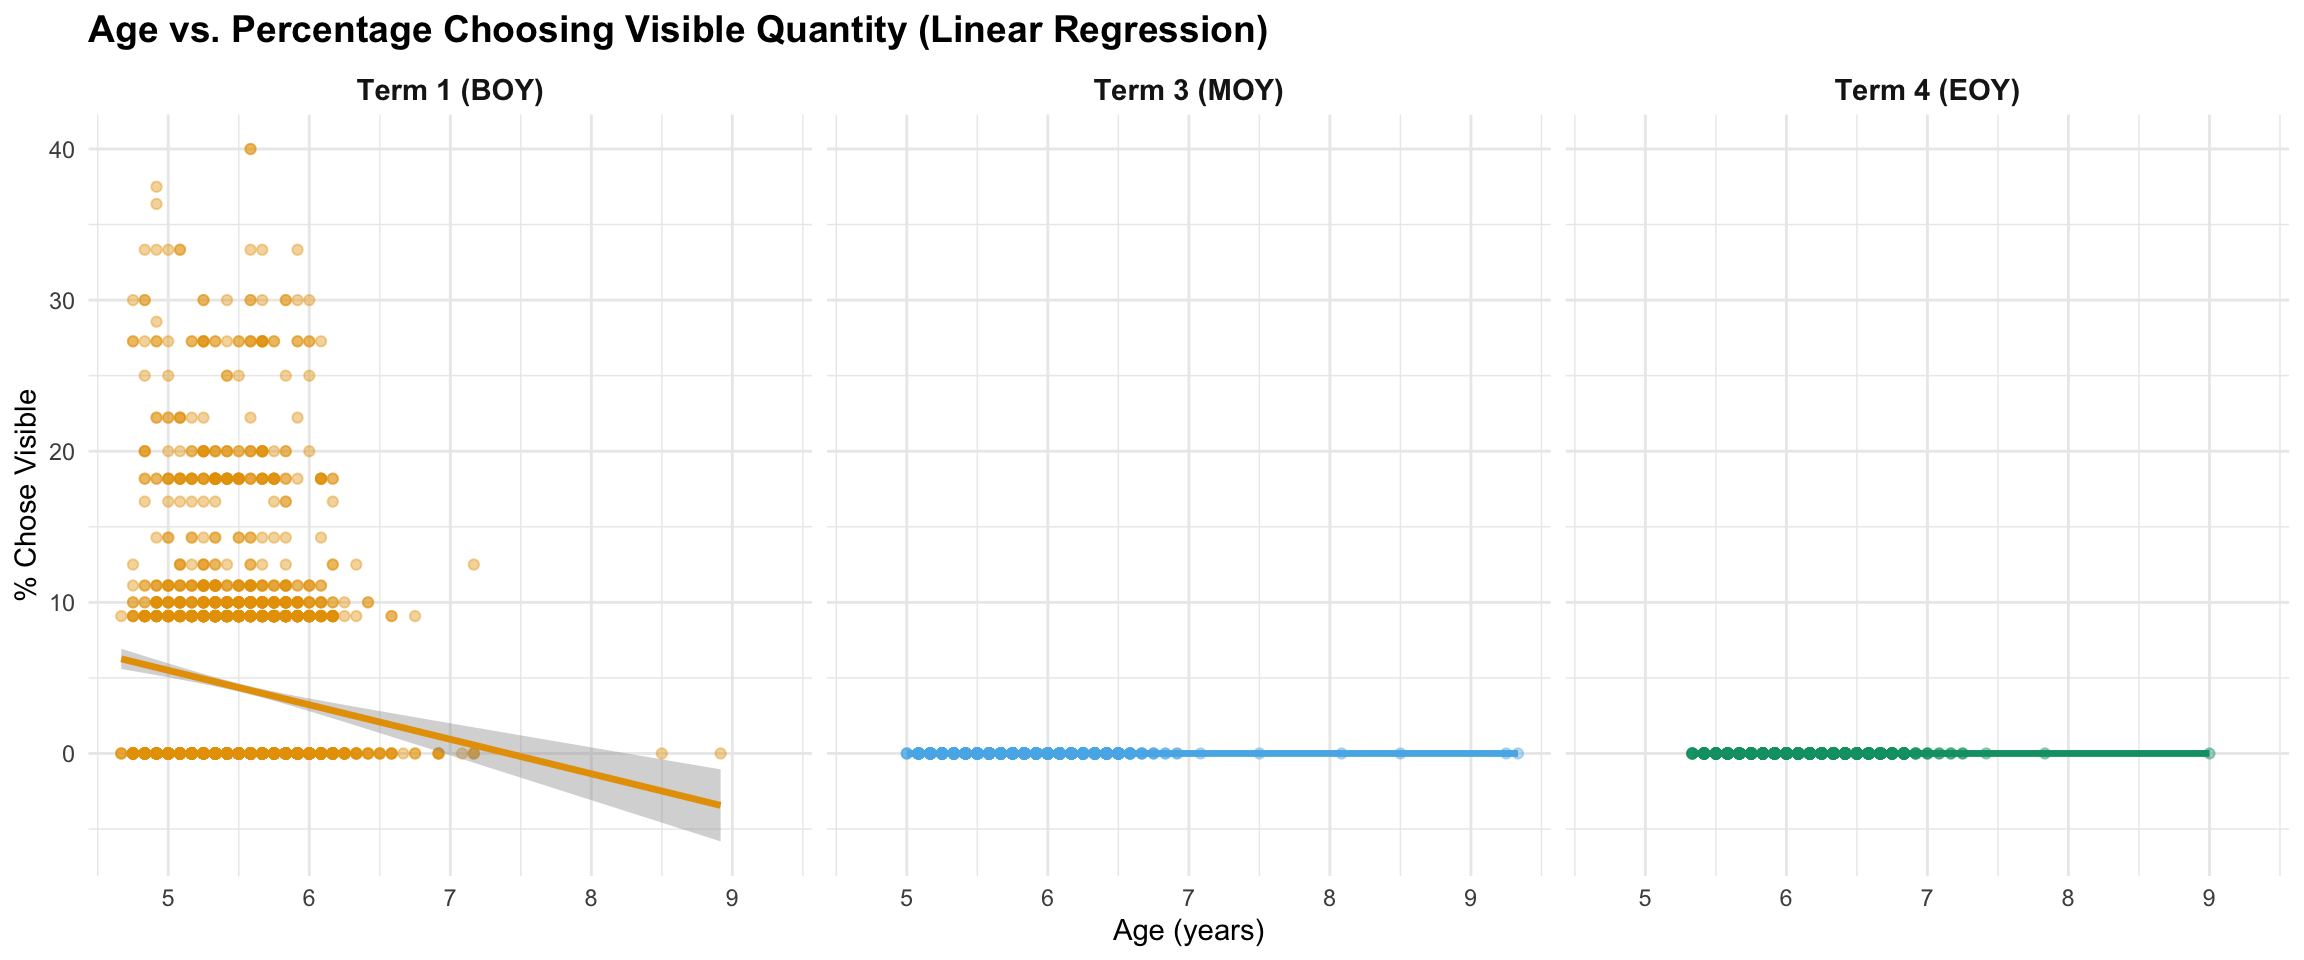
7.3 Age vs. Choosing Visible Quantity
Research Question: Are older children less likely to choose the visible quantity when it’s incorrect?
`geom_smooth()` using formula = 'y ~ x'
Effect Sizes and Practical Significance
Warning: There were 2 warnings in `summarise()`.
The first warning was:
ℹ In argument: `r = cor(age_decimal, pct_chose_visible, use = "complete.obs")`.
ℹ In group 2: `term_label = "Term 3 (MOY)"`.
Caused by warning in `cor()`:
! the standard deviation is zero
ℹ Run `dplyr::last_dplyr_warnings()` to see the 1 remaining warning.
Warning: There were 2 warnings in `summarise()`.
The first warning was:
ℹ In argument: `p_value = cor.test(age_decimal, pct_chose_visible)$p.value`.
ℹ In group 2: `term_label = "Term 3 (MOY)"`.
Caused by warning in `cor()`:
! the standard deviation is zero
ℹ Run `dplyr::last_dplyr_warnings()` to see the 1 remaining warning.
Enhanced correlation: Age and % choosing visible quantity
| Term 1 (BOY) |
2454 |
-0.128 |
[-0.167, -0.089] |
0.016 |
Small |
0 |
*** |
| Term 3 (MOY) |
1409 |
NA |
[NA, NA] |
NA |
Large |
NA |
|
| Term 4 (EOY) |
1080 |
NA |
[NA, NA] |
NA |
Large |
NA |
|
| Note: |
|
|
|
|
|
|
|
| *** p < 0.001, ** p < 0.01, * p < 0.05 |
|
|
|
|
|
|
|
Linear regression: Change in % choosing visible per year of age
| Term 1 (BOY) |
-2.28 [-2.98, -1.58] |
0.016 |
0.016 |
| Term 3 (MOY) |
0.00 [0.00, 0.00] |
NaN |
NaN |
| Term 4 (EOY) |
-0.00 [0.00, 0.00] |
NaN |
NaN |
| Note: |
|
|
|
| Negative slopes indicate older children are less likely to choose visible quantity. 95% confidence intervals in brackets. |
|
|
|
Interpretation: The correlations show that age is negatively associated with choosing the visible quantity - older children are less likely to make this error. However, note the floor effects at MOY and EOY (nearly all students avoid this error regardless of age), making BOY the most informative timepoint for this analysis.
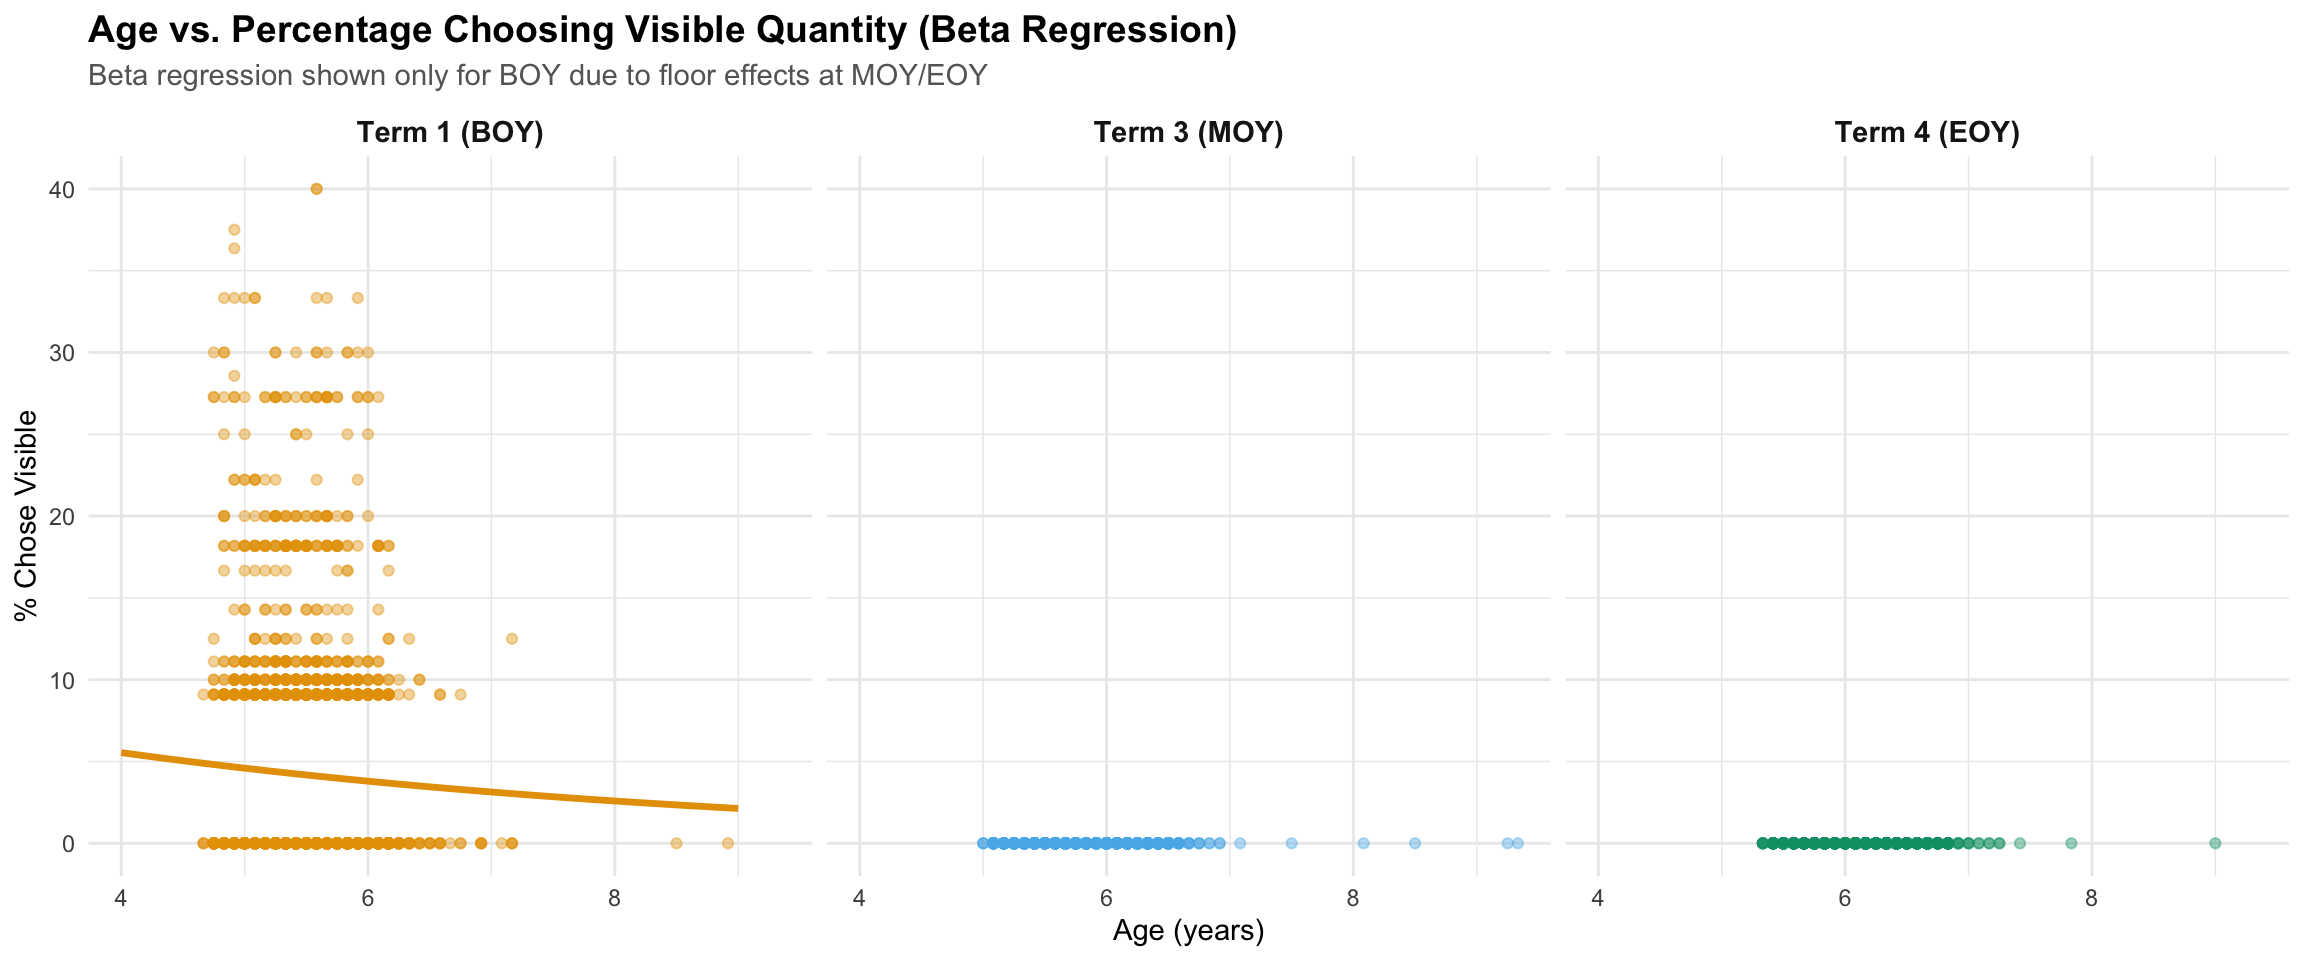
Beta Regression Analysis (BOY Only)
Beta regression for choosing visible quantity is only meaningful at BOY, where students show variation in this behaviour. At MOY and EOY, nearly all students (regardless of age) have learnt not to choose the visible quantity distractor, resulting in a “floor effect” with insufficient variation to model reliably.
Beta regression: Age predicting % choosing visible quantity (BOY only)
| Term 1 (BOY) |
-0.198 [-0.301, -0.095] |
-0.72 |
0.013 |
2e-04 |
*** |
| Note: |
|
|
|
|
|
| *** p < 0.001, ** p < 0.01, * p < 0.05. Negative marginal effect indicates older children are less likely to choose visible quantity. MOY and EOY not modelled due to floor effects. |
|
|
|
|
|
Key Finding: At BOY, each additional year of age is associated with a decrease in choosing the visible quantity when incorrect. This confirms that older children are less susceptible to this misconception at the start of the school year. By MOY and EOY, this error has largely been eliminated across all age groups through instruction.
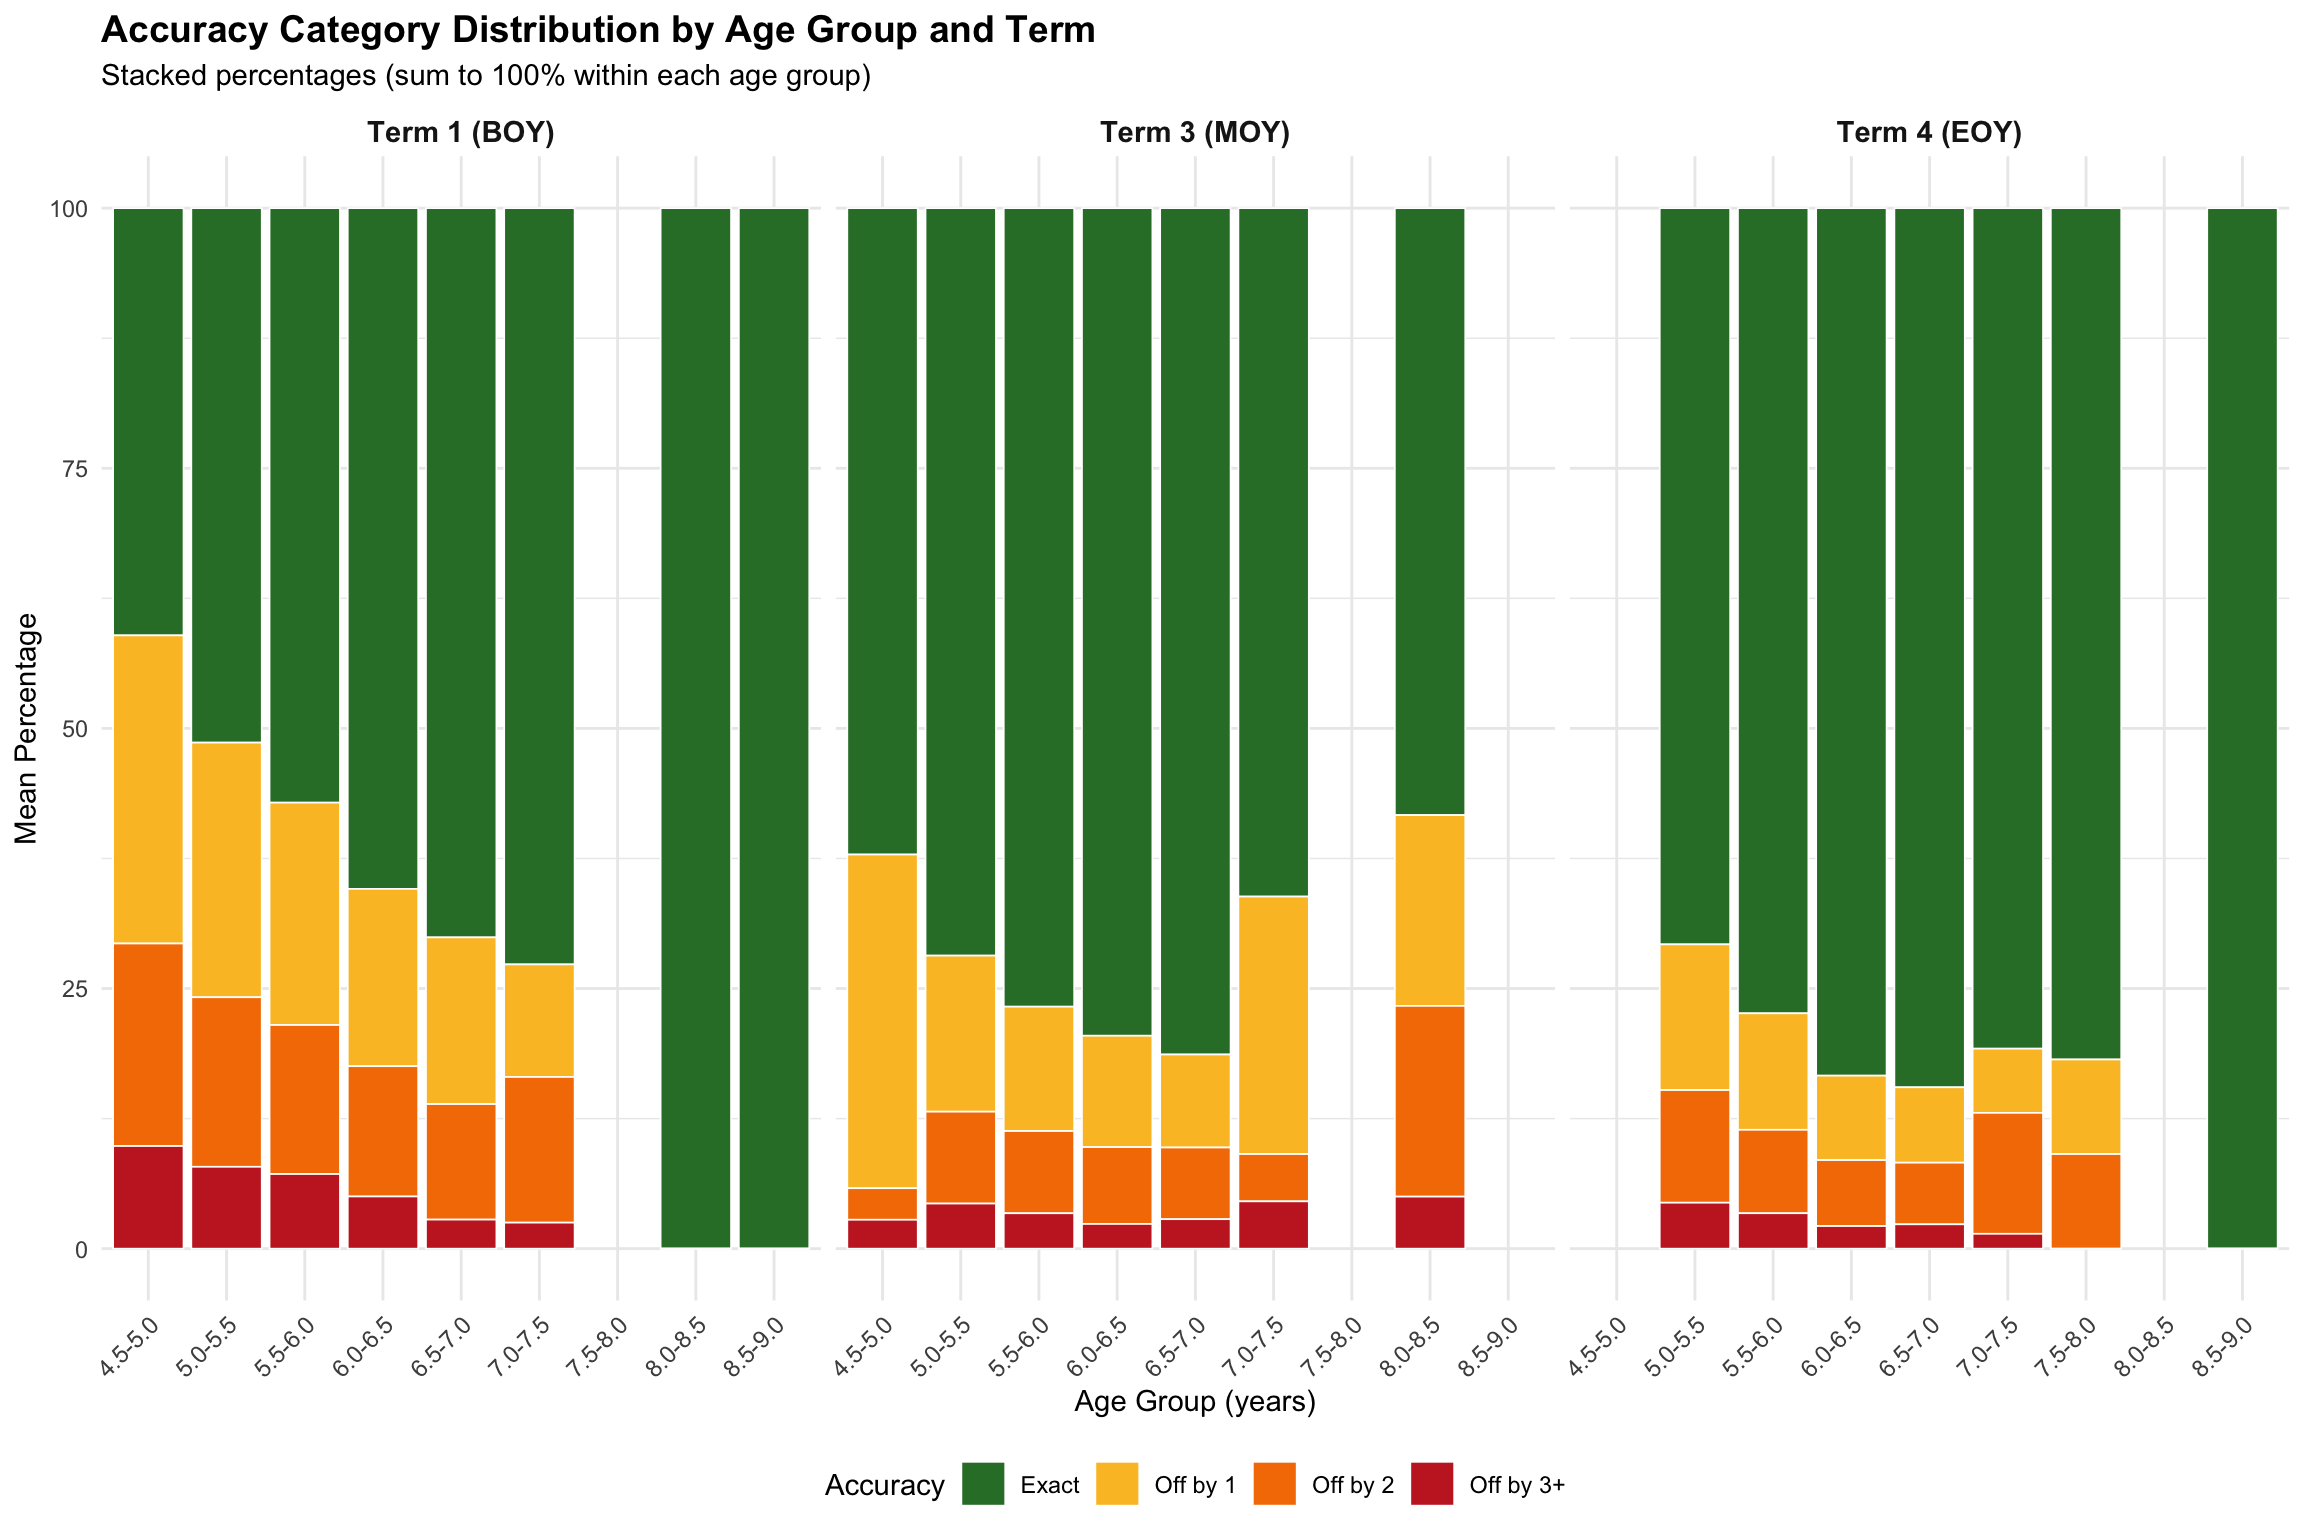
7.4 Accuracy Category Distribution by Age Group
This analysis shows how the distribution of accuracy categories changes across age groups.
Mean accuracy percentages by age group and term
| Term 1 (BOY) |
4.5-5.0 |
264 |
41.1 |
29.6 |
19.5 |
9.9 |
| Term 1 (BOY) |
5.0-5.5 |
997 |
51.4 |
24.5 |
16.3 |
7.9 |
| Term 1 (BOY) |
5.5-6.0 |
974 |
57.1 |
21.4 |
14.3 |
7.2 |
| Term 1 (BOY) |
6.0-6.5 |
198 |
65.4 |
17.0 |
12.5 |
5.0 |
| Term 1 (BOY) |
6.5-7.0 |
14 |
70.1 |
16.0 |
11.1 |
2.8 |
| Term 1 (BOY) |
7.0-7.5 |
5 |
72.7 |
10.8 |
14.0 |
2.5 |
| Term 1 (BOY) |
8.0-8.5 |
1 |
100.0 |
0.0 |
0.0 |
0.0 |
| Term 1 (BOY) |
8.5-9.0 |
1 |
100.0 |
0.0 |
0.0 |
0.0 |
| Term 3 (MOY) |
4.5-5.0 |
3 |
62.1 |
32.1 |
3.0 |
2.8 |
| Term 3 (MOY) |
5.0-5.5 |
309 |
71.8 |
15.0 |
8.8 |
4.3 |
| Term 3 (MOY) |
5.5-6.0 |
674 |
76.7 |
12.0 |
7.9 |
3.4 |
| Term 3 (MOY) |
6.0-6.5 |
398 |
79.5 |
10.7 |
7.4 |
2.4 |
| Term 3 (MOY) |
6.5-7.0 |
19 |
81.3 |
8.9 |
6.9 |
2.8 |
| Term 3 (MOY) |
7.0-7.5 |
2 |
66.2 |
24.7 |
4.5 |
4.5 |
| Term 3 (MOY) |
8.0-8.5 |
2 |
58.3 |
18.3 |
18.3 |
5.0 |
| Term 4 (EOY) |
5.0-5.5 |
55 |
70.8 |
14.0 |
10.8 |
4.4 |
| Term 4 (EOY) |
5.5-6.0 |
380 |
77.4 |
11.2 |
8.0 |
3.4 |
| Term 4 (EOY) |
6.0-6.5 |
497 |
83.4 |
8.1 |
6.3 |
2.2 |
| Term 4 (EOY) |
6.5-7.0 |
139 |
84.5 |
7.2 |
5.9 |
2.3 |
| Term 4 (EOY) |
7.0-7.5 |
7 |
80.8 |
6.2 |
11.6 |
1.4 |
| Term 4 (EOY) |
7.5-8.0 |
1 |
81.8 |
9.1 |
9.1 |
0.0 |
| Term 4 (EOY) |
8.5-9.0 |
1 |
100.0 |
0.0 |
0.0 |
0.0 |
7.5 Downloadable Student-Level Data
The table below contains student-level aggregated statistics for age and response accuracy. Each row represents one student in one term.
Note: Accuracy percentages (Exact + Off by 1 + Off by 2 + Off by 3+) sum to 100%. The “Chose Visible” percentage is independent and may overlap with the accuracy categories.
Student-level age and accuracy data (first 20 rows)
| 00107783-010a-f011-bcb9-8fb474f3e22e |
1 |
Foundation A 2025 |
5 |
4 |
11 |
18.2 |
36.4 |
36.4 |
9.1 |
27.3 |
| 007a8bfd-a207-f011-bcb9-dcac624517bd |
1 |
Foundation A 2025 |
5 |
6 |
11 |
72.7 |
0.0 |
18.2 |
9.1 |
0.0 |
| 0095b32f-d60f-f011-a972-9ebec6053e0e |
1 |
Foundation B 2025 |
5 |
2 |
11 |
18.2 |
36.4 |
36.4 |
9.1 |
0.0 |
| 00b14cb6-a10a-f011-bcbb-d1bac03748a2 |
1 |
Foundation A 2025 |
5 |
8 |
11 |
27.3 |
54.5 |
18.2 |
0.0 |
18.2 |
| 00b44cb6-a10a-f011-bcbb-d1bac03748a2 |
1 |
Foundation B 2025 |
5 |
1 |
2 |
50.0 |
50.0 |
0.0 |
0.0 |
0.0 |
| 00bc4cb6-a10a-f011-bcbb-d1bac03748a2 |
1 |
Foundation B 2025 |
5 |
4 |
11 |
27.3 |
54.5 |
18.2 |
0.0 |
9.1 |
| 00c3afda-f00e-f011-a972-97d85066398c |
1 |
Foundation B 2025 |
5 |
3 |
10 |
20.0 |
10.0 |
40.0 |
30.0 |
0.0 |
| 00c42e4a-a007-f011-bcbb-e211f1a75204 |
1 |
Foundation B 2025 |
5 |
1 |
3 |
66.7 |
0.0 |
33.3 |
0.0 |
0.0 |
| 01231dd9-f213-f011-a972-c3fdec2d1746 |
1 |
Foundation A 2025 |
5 |
6 |
10 |
100.0 |
0.0 |
0.0 |
0.0 |
0.0 |
| 01233a51-a007-f011-bcbb-e211f1a75204 |
1 |
Foundation A 2025 |
5 |
0 |
11 |
81.8 |
9.1 |
0.0 |
9.1 |
0.0 |
| 012e3a51-a007-f011-bcbb-e211f1a75204 |
1 |
Foundation A 2025 |
5 |
9 |
11 |
54.5 |
27.3 |
0.0 |
18.2 |
18.2 |
| 014993f7-a207-f011-bcb9-dcac624517bd |
1 |
Foundation B 2025 |
5 |
10 |
10 |
80.0 |
0.0 |
10.0 |
10.0 |
0.0 |
| 01597283-110c-f011-a972-a0475d3d08ed |
1 |
Foundation B 2025 |
6 |
1 |
3 |
100.0 |
0.0 |
0.0 |
0.0 |
0.0 |
| 015b00f3-a50e-f011-a973-c418bf5f696c |
1 |
Foundation A 2025 |
5 |
6 |
10 |
20.0 |
60.0 |
10.0 |
10.0 |
0.0 |
| 0181e1ee-b90a-f011-bcb9-8b81c0530db1 |
1 |
Foundation B 2025 |
5 |
8 |
11 |
72.7 |
0.0 |
27.3 |
0.0 |
0.0 |
| 01b00da4-650f-f011-a972-bc284488ed1c |
1 |
Foundation A 2025 |
5 |
7 |
9 |
100.0 |
0.0 |
0.0 |
0.0 |
0.0 |
| 01b84cb6-a10a-f011-bcbb-d1bac03748a2 |
1 |
Foundation B 2025 |
5 |
10 |
11 |
81.8 |
9.1 |
9.1 |
0.0 |
0.0 |
| 021c4d4f-1c14-f011-a972-b33d457dfc0c |
1 |
Foundation A 2025 |
5 |
6 |
11 |
100.0 |
0.0 |
0.0 |
0.0 |
0.0 |
| 025d7283-110c-f011-a972-a0475d3d08ed |
1 |
Foundation B 2025 |
4 |
11 |
10 |
60.0 |
0.0 |
30.0 |
10.0 |
0.0 |
| 0265be5b-5f0c-f011-a973-ed10459e87e9 |
1 |
Foundation A 2025 |
5 |
6 |
11 |
100.0 |
0.0 |
0.0 |
0.0 |
0.0 |