1. Probe description
The Number Line probes assess students’ understanding of numerical magnitude by having them place numbers on a line. There are two main variants:
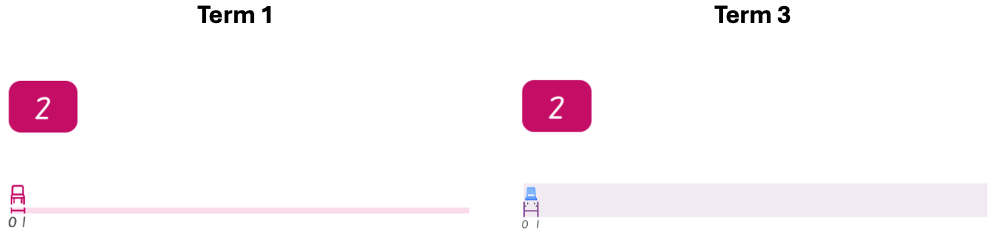
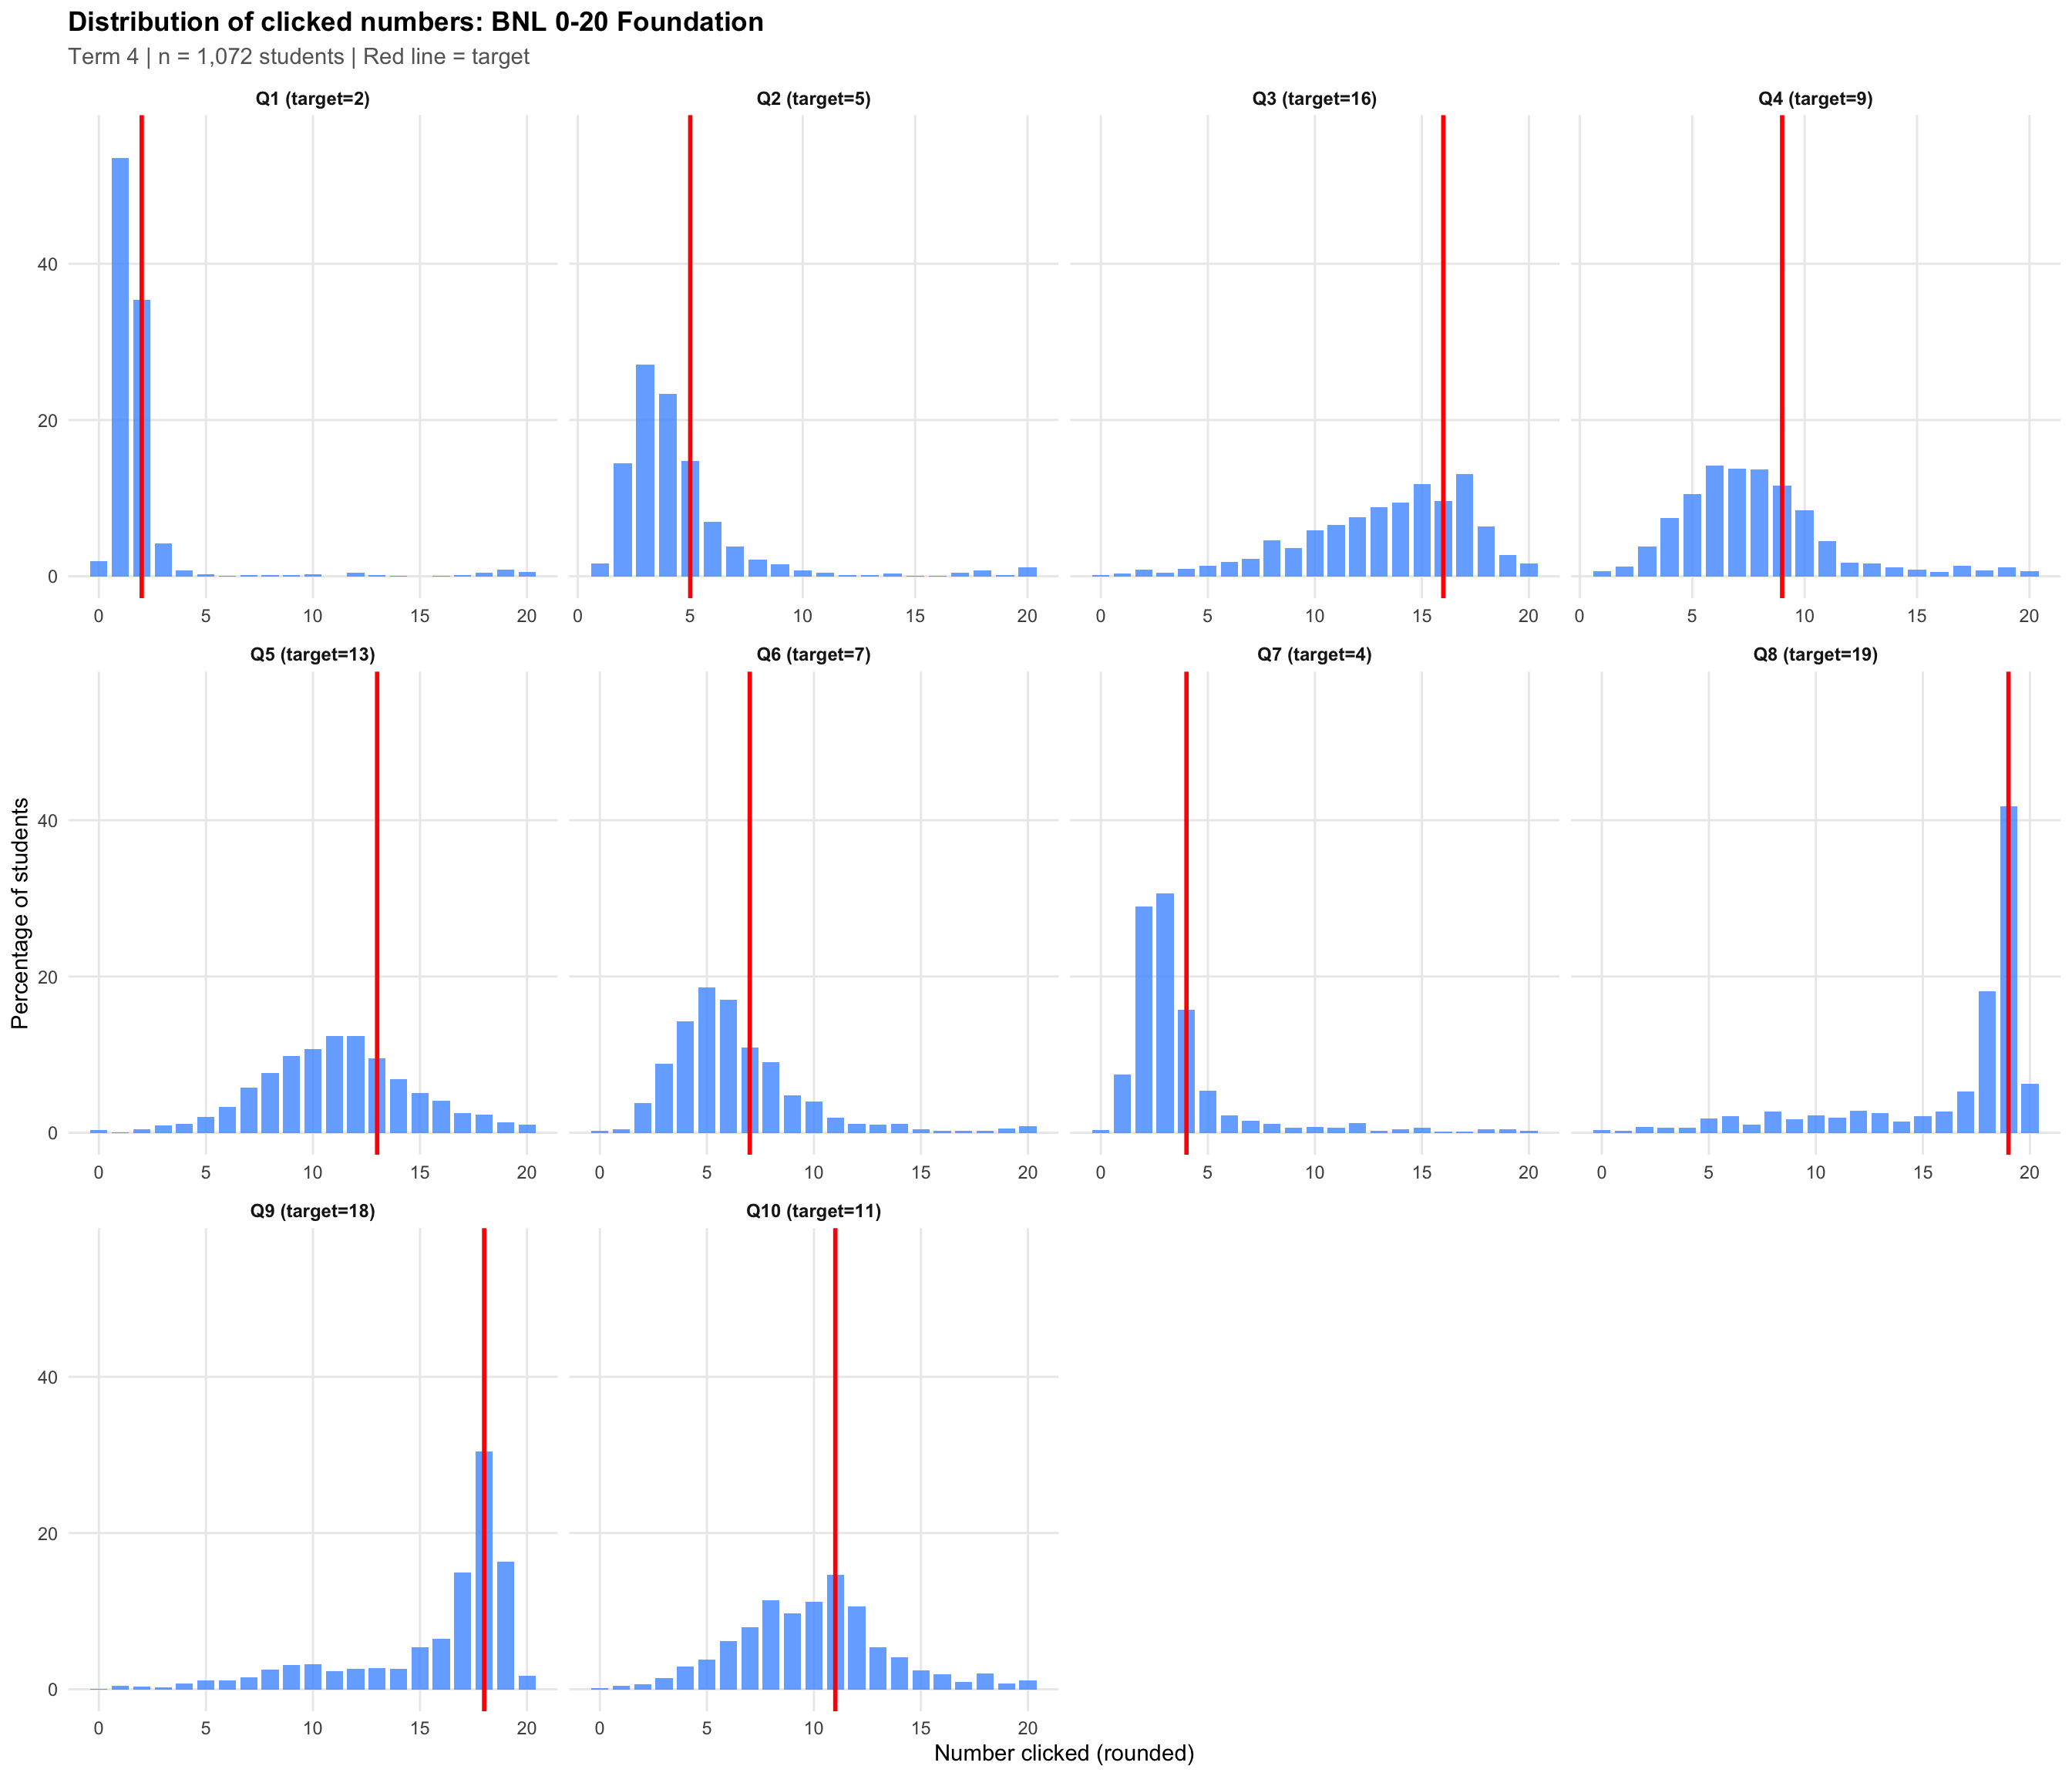
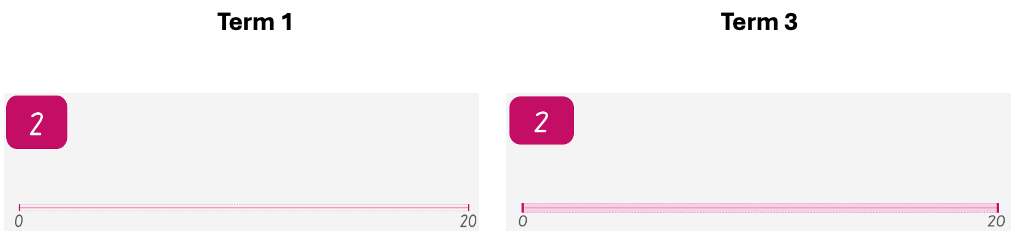
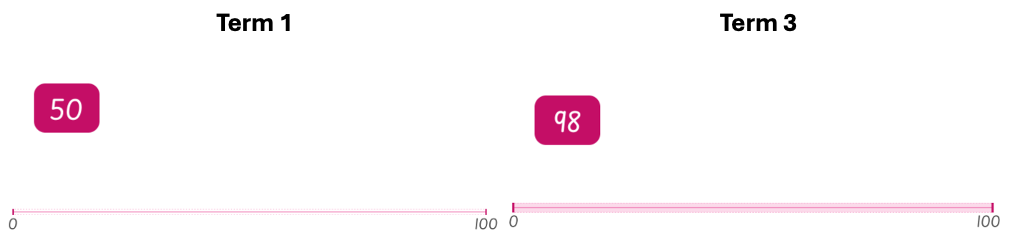
- Bounded Number Line (BNL): The line shows both endpoints (e.g., 0 and 20, or 0 and 100). Students click where a target number should be placed.
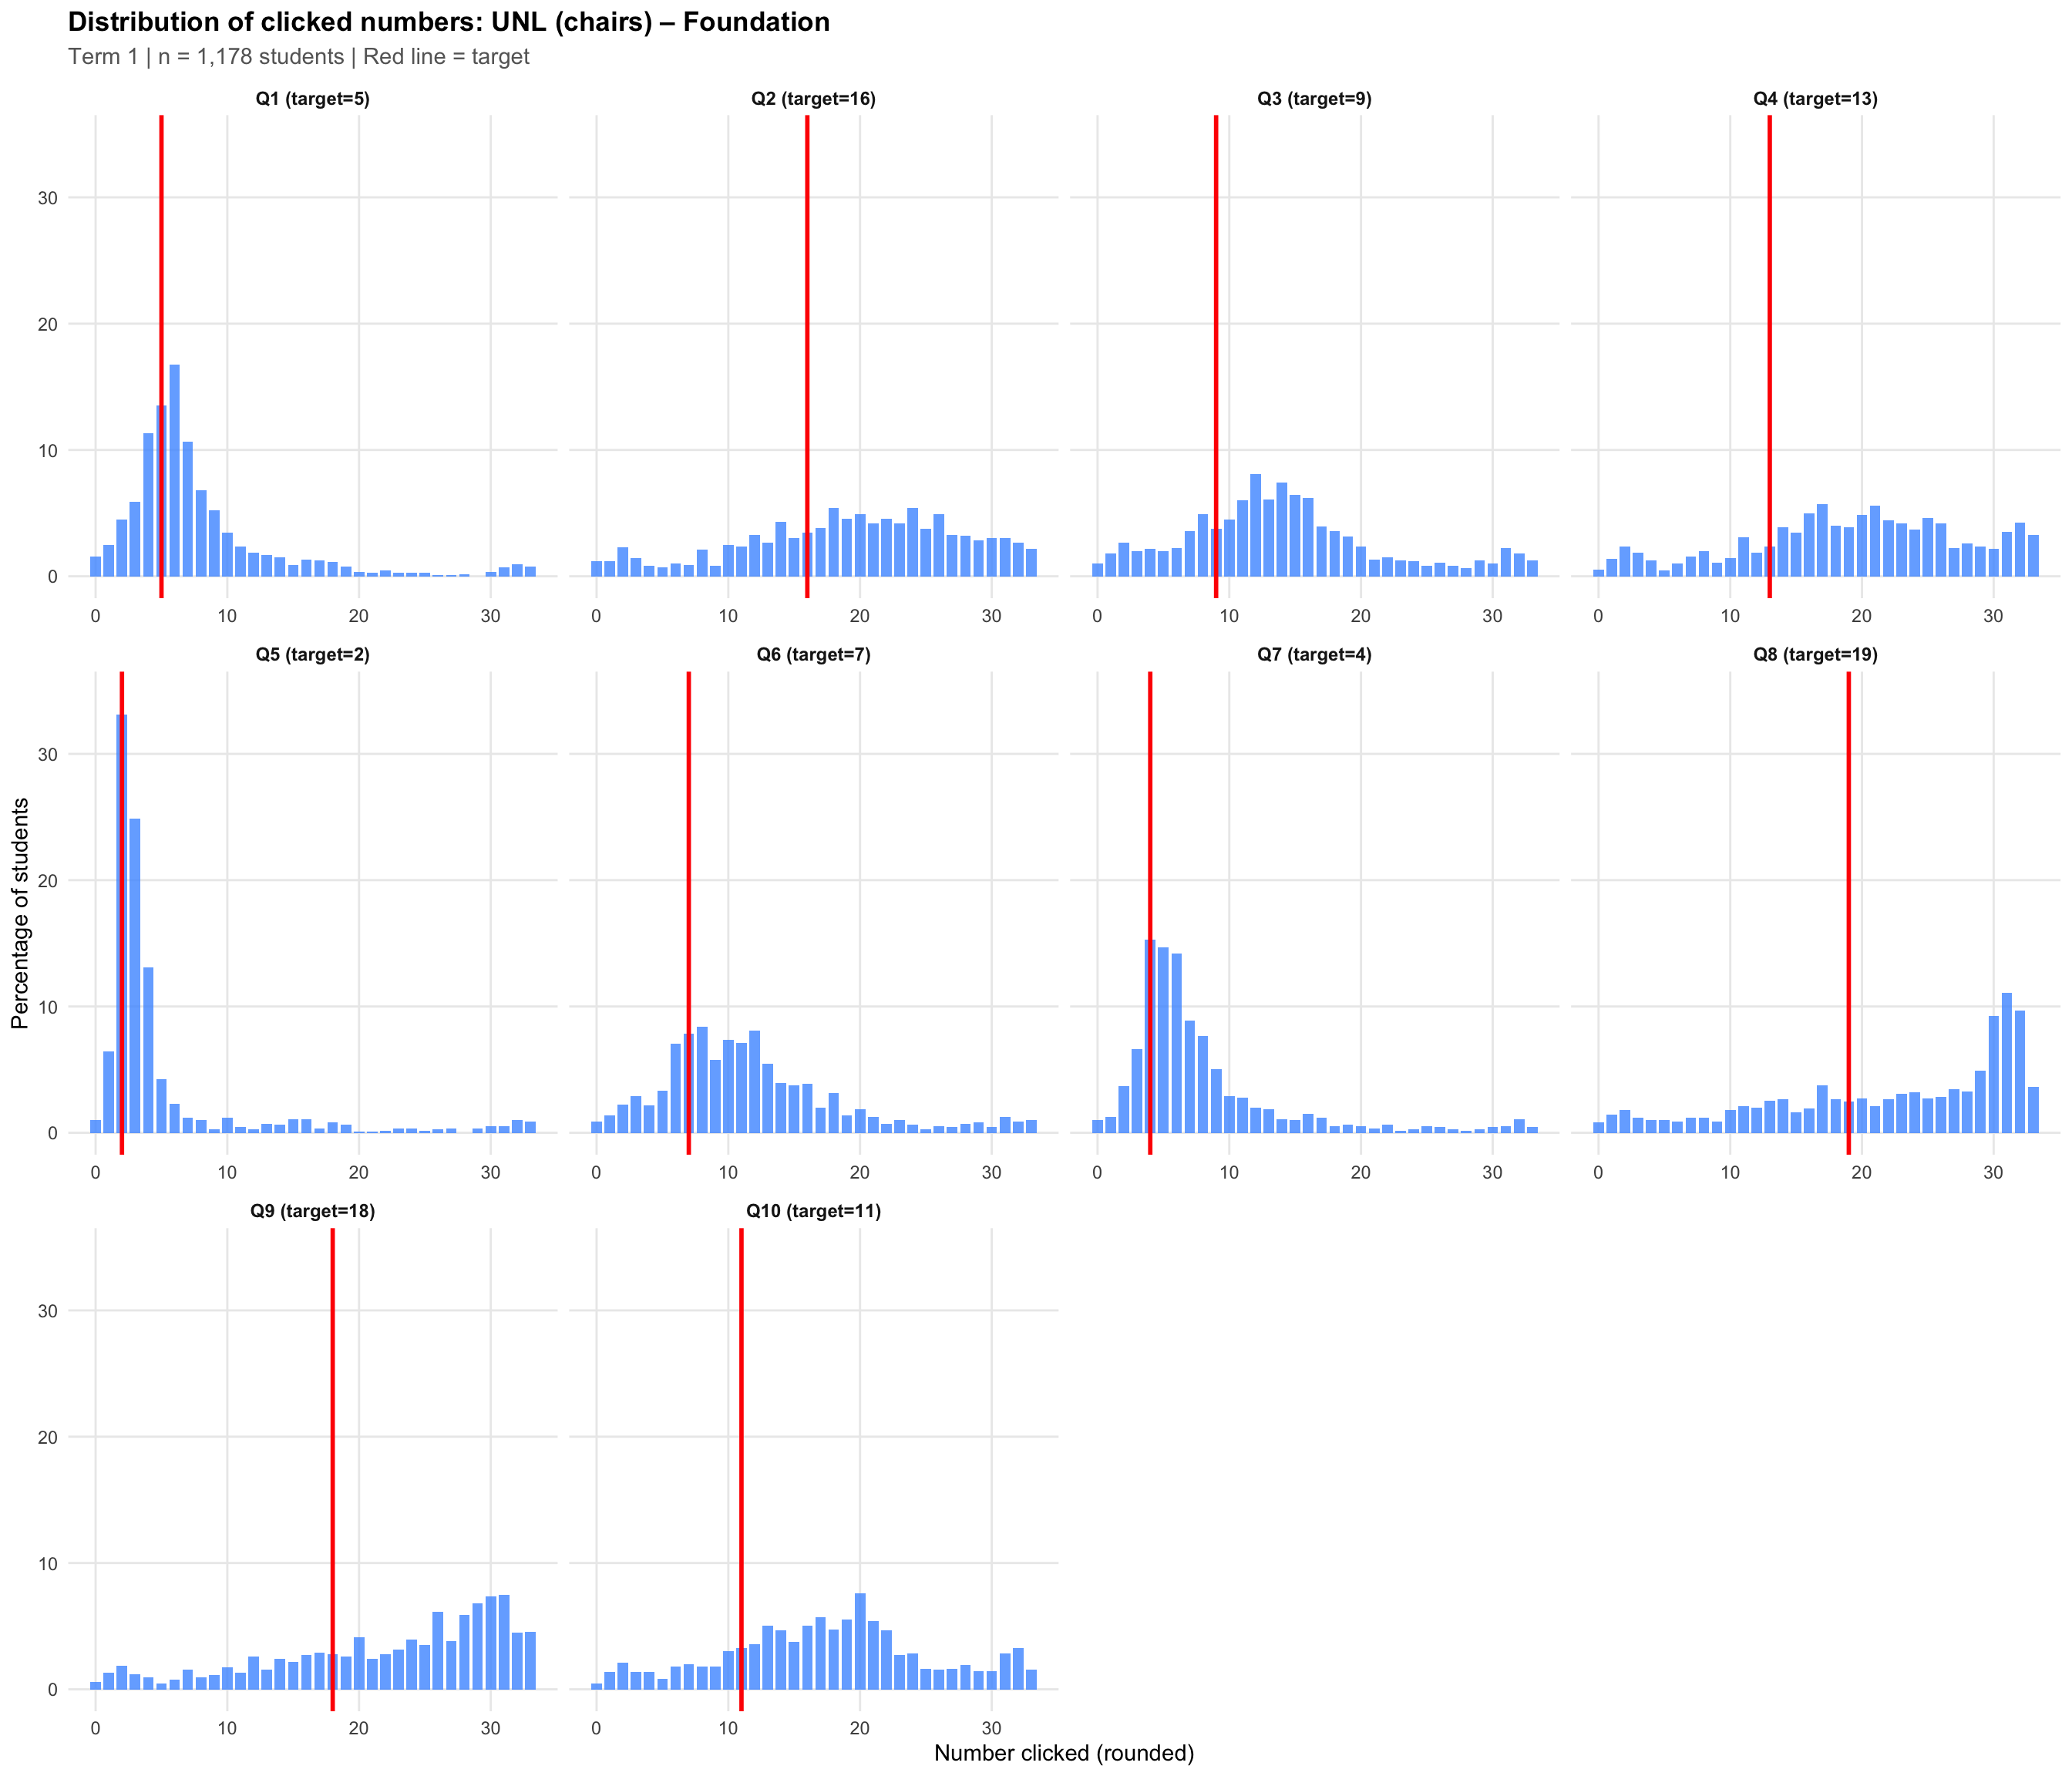
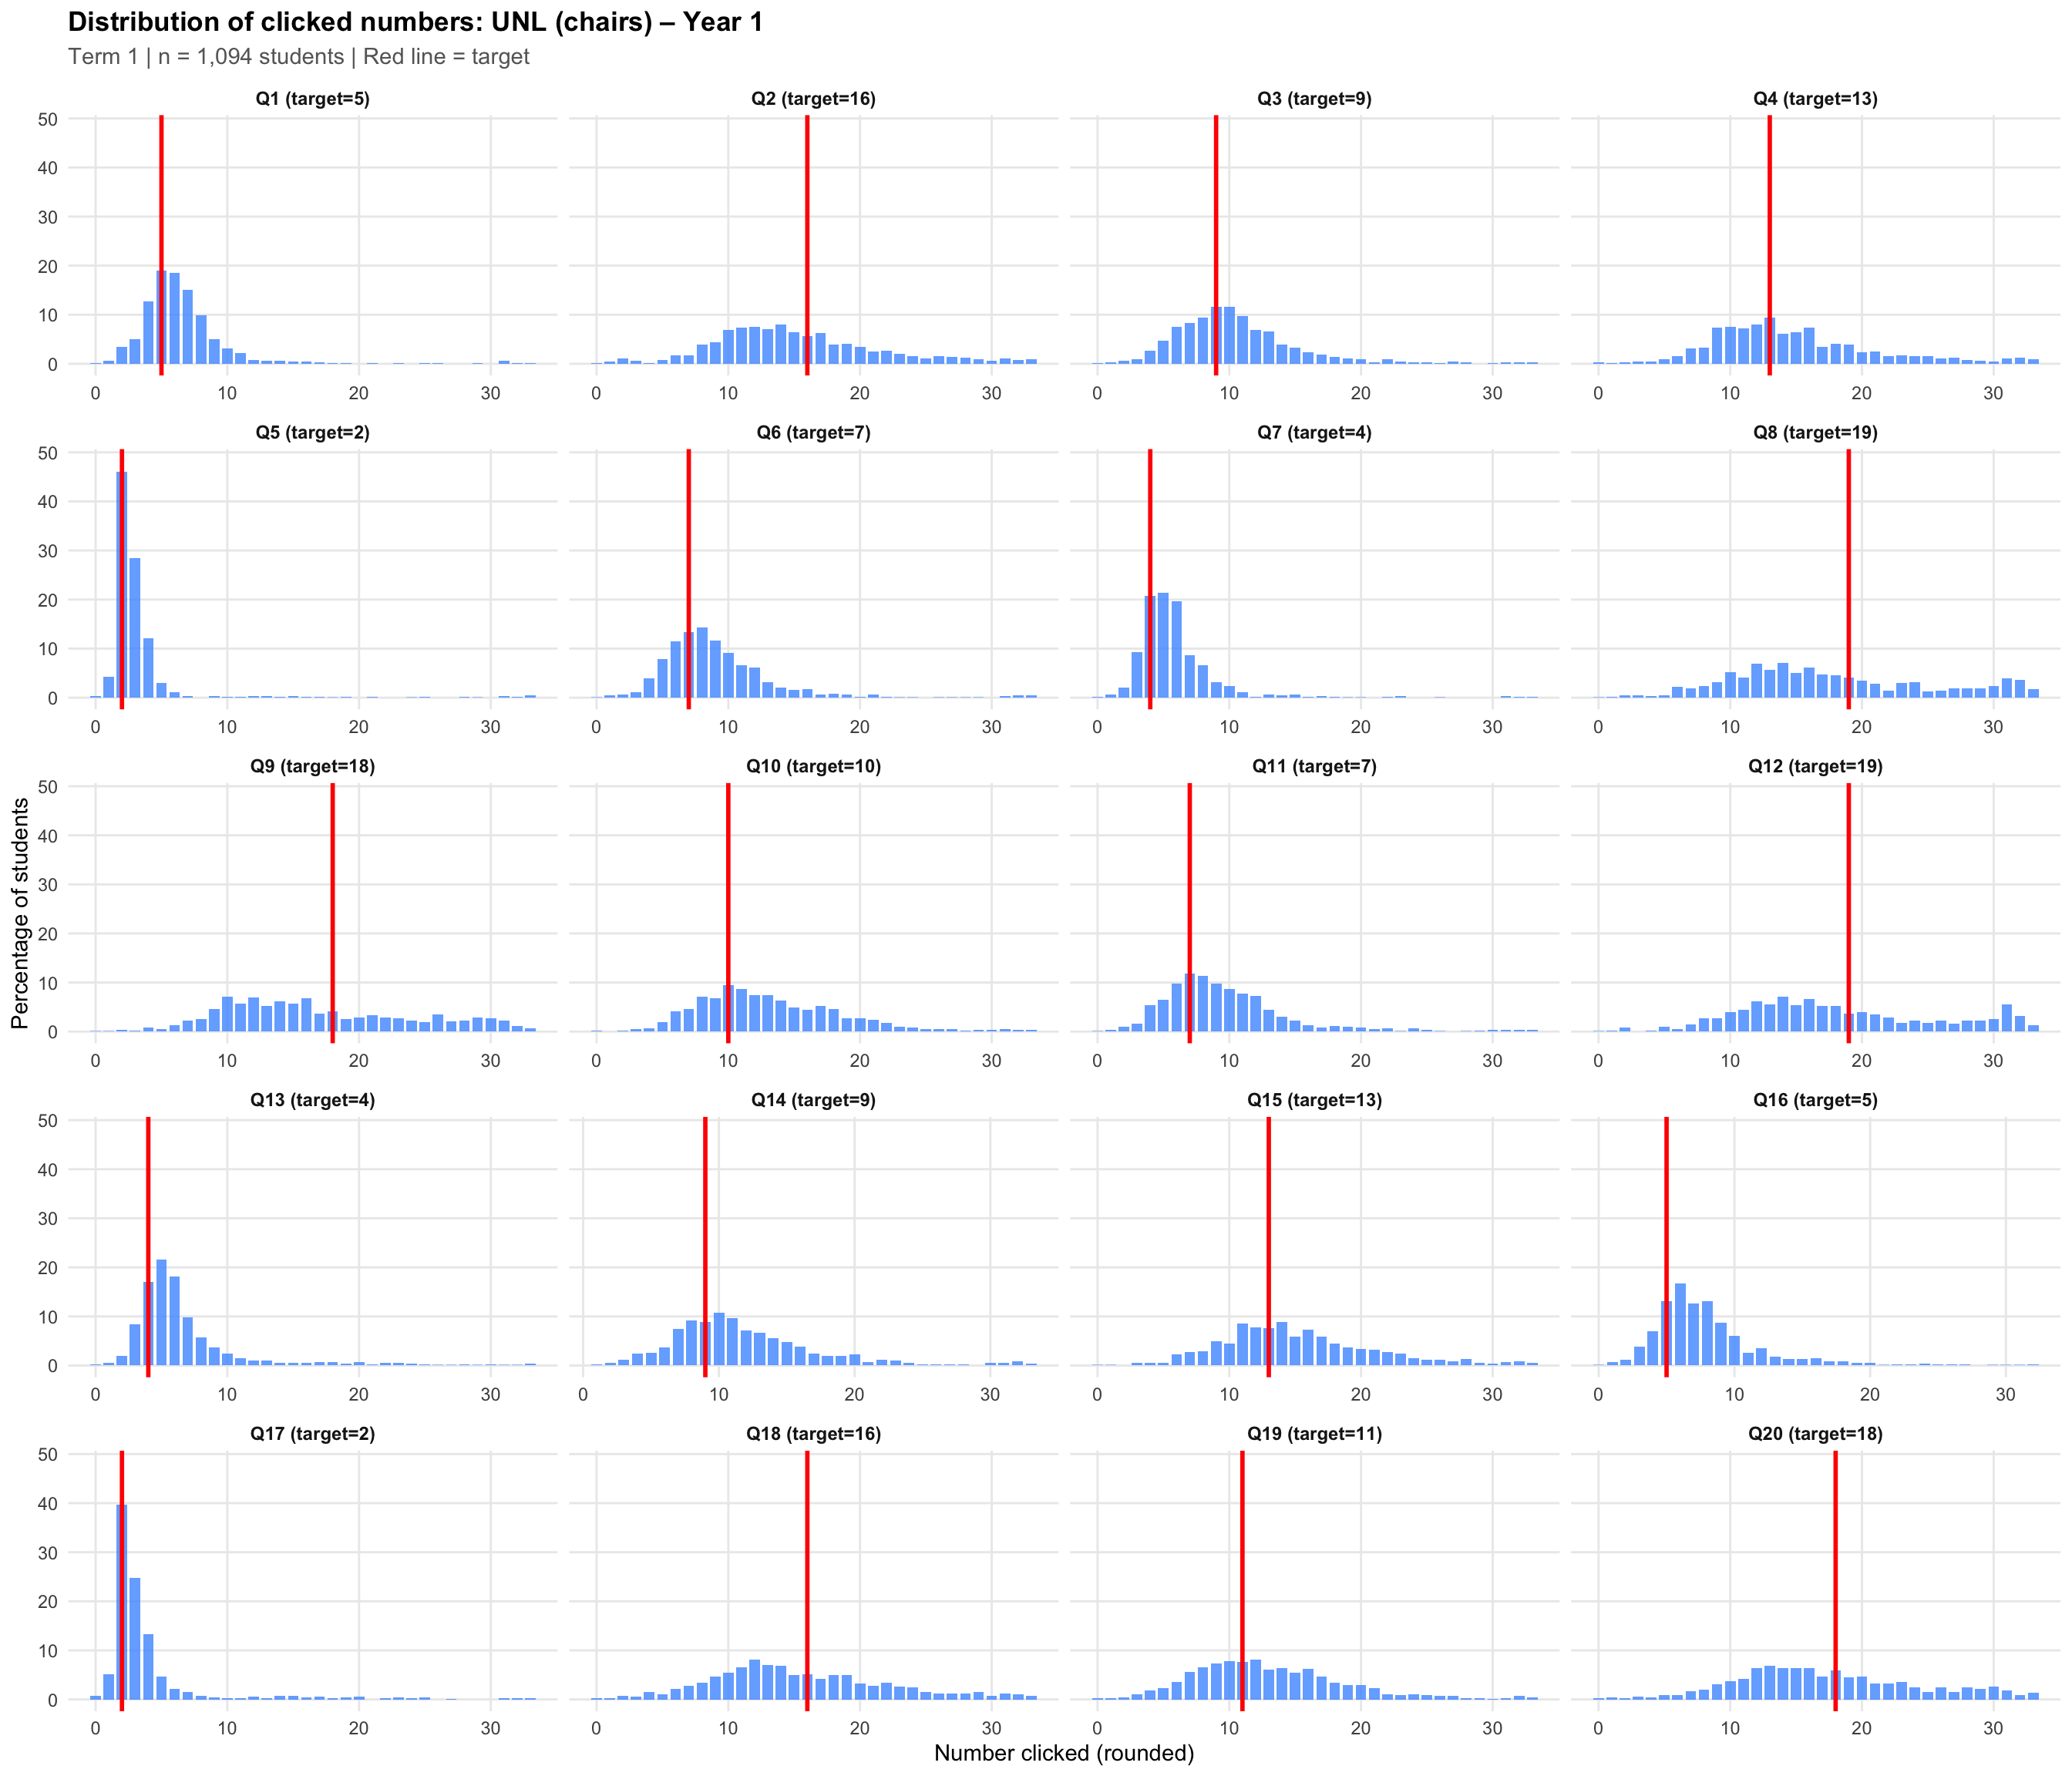
- Unbounded Number Line (UNL): The line shows only 0 and a unit marker (representing “1”). Students must use proportional reasoning to estimate larger targets.
Changes from Term 1 (BOY) to Term 3 (MOY) / Term 4 (EOY)
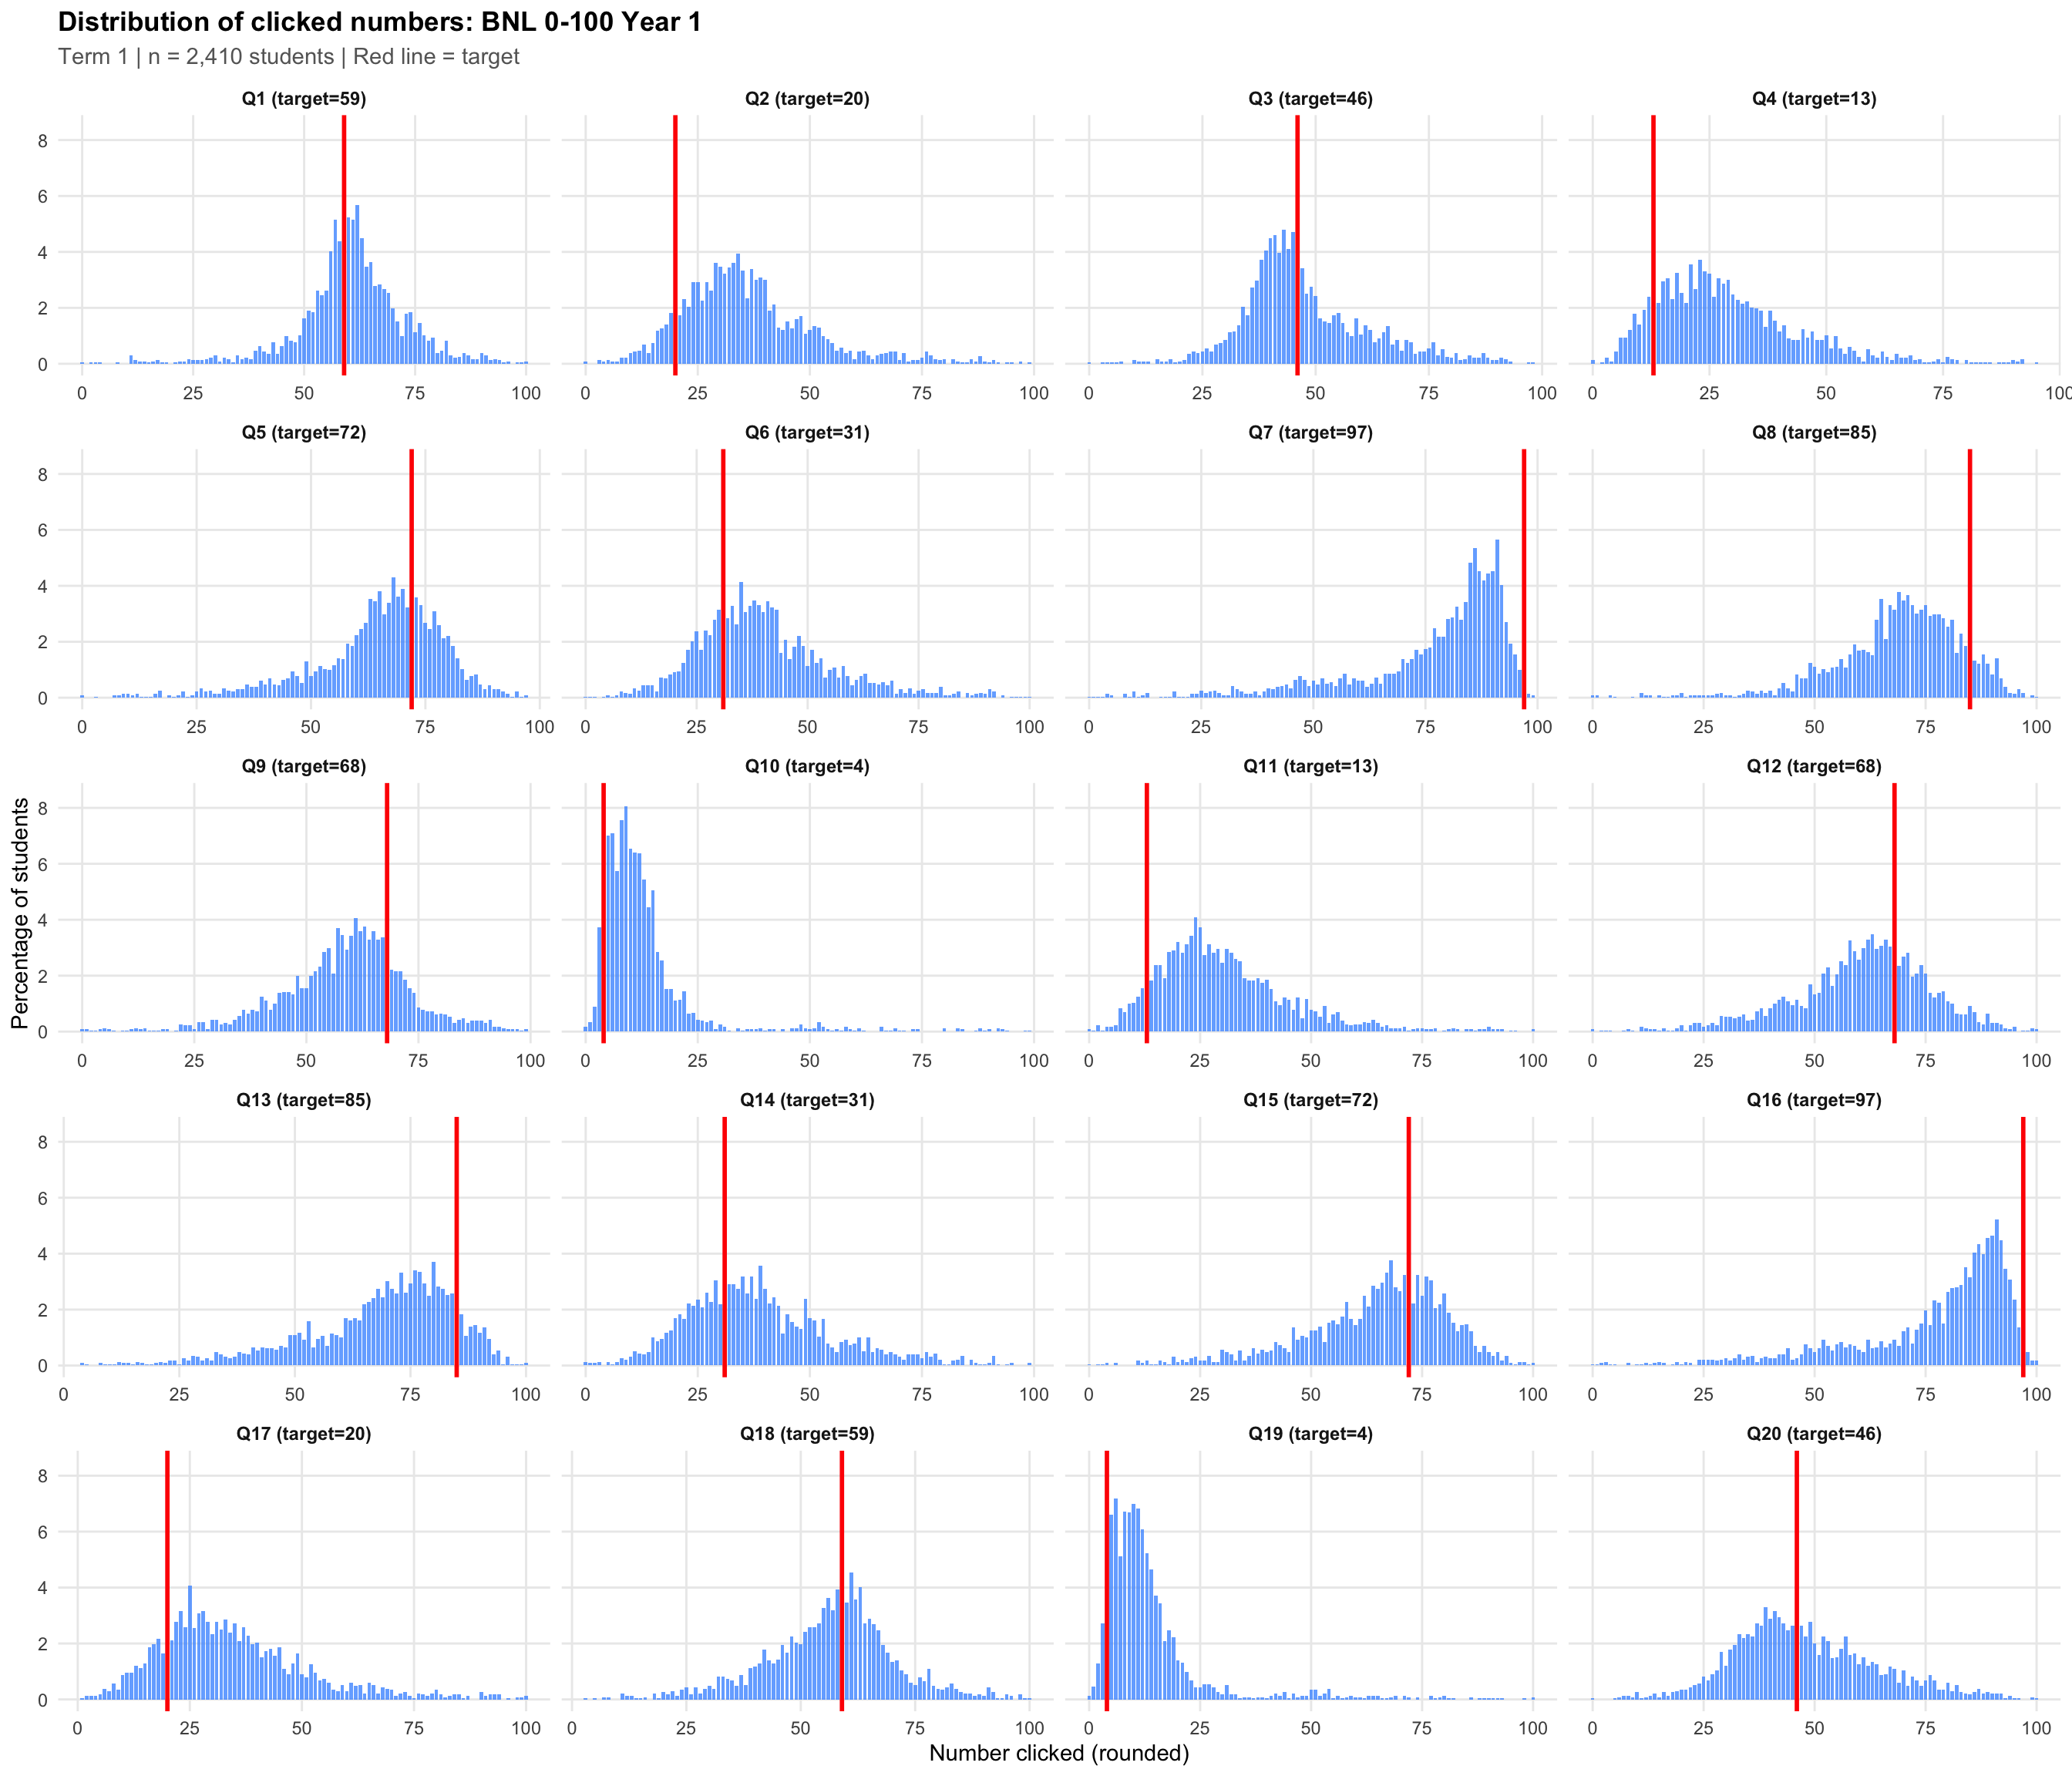
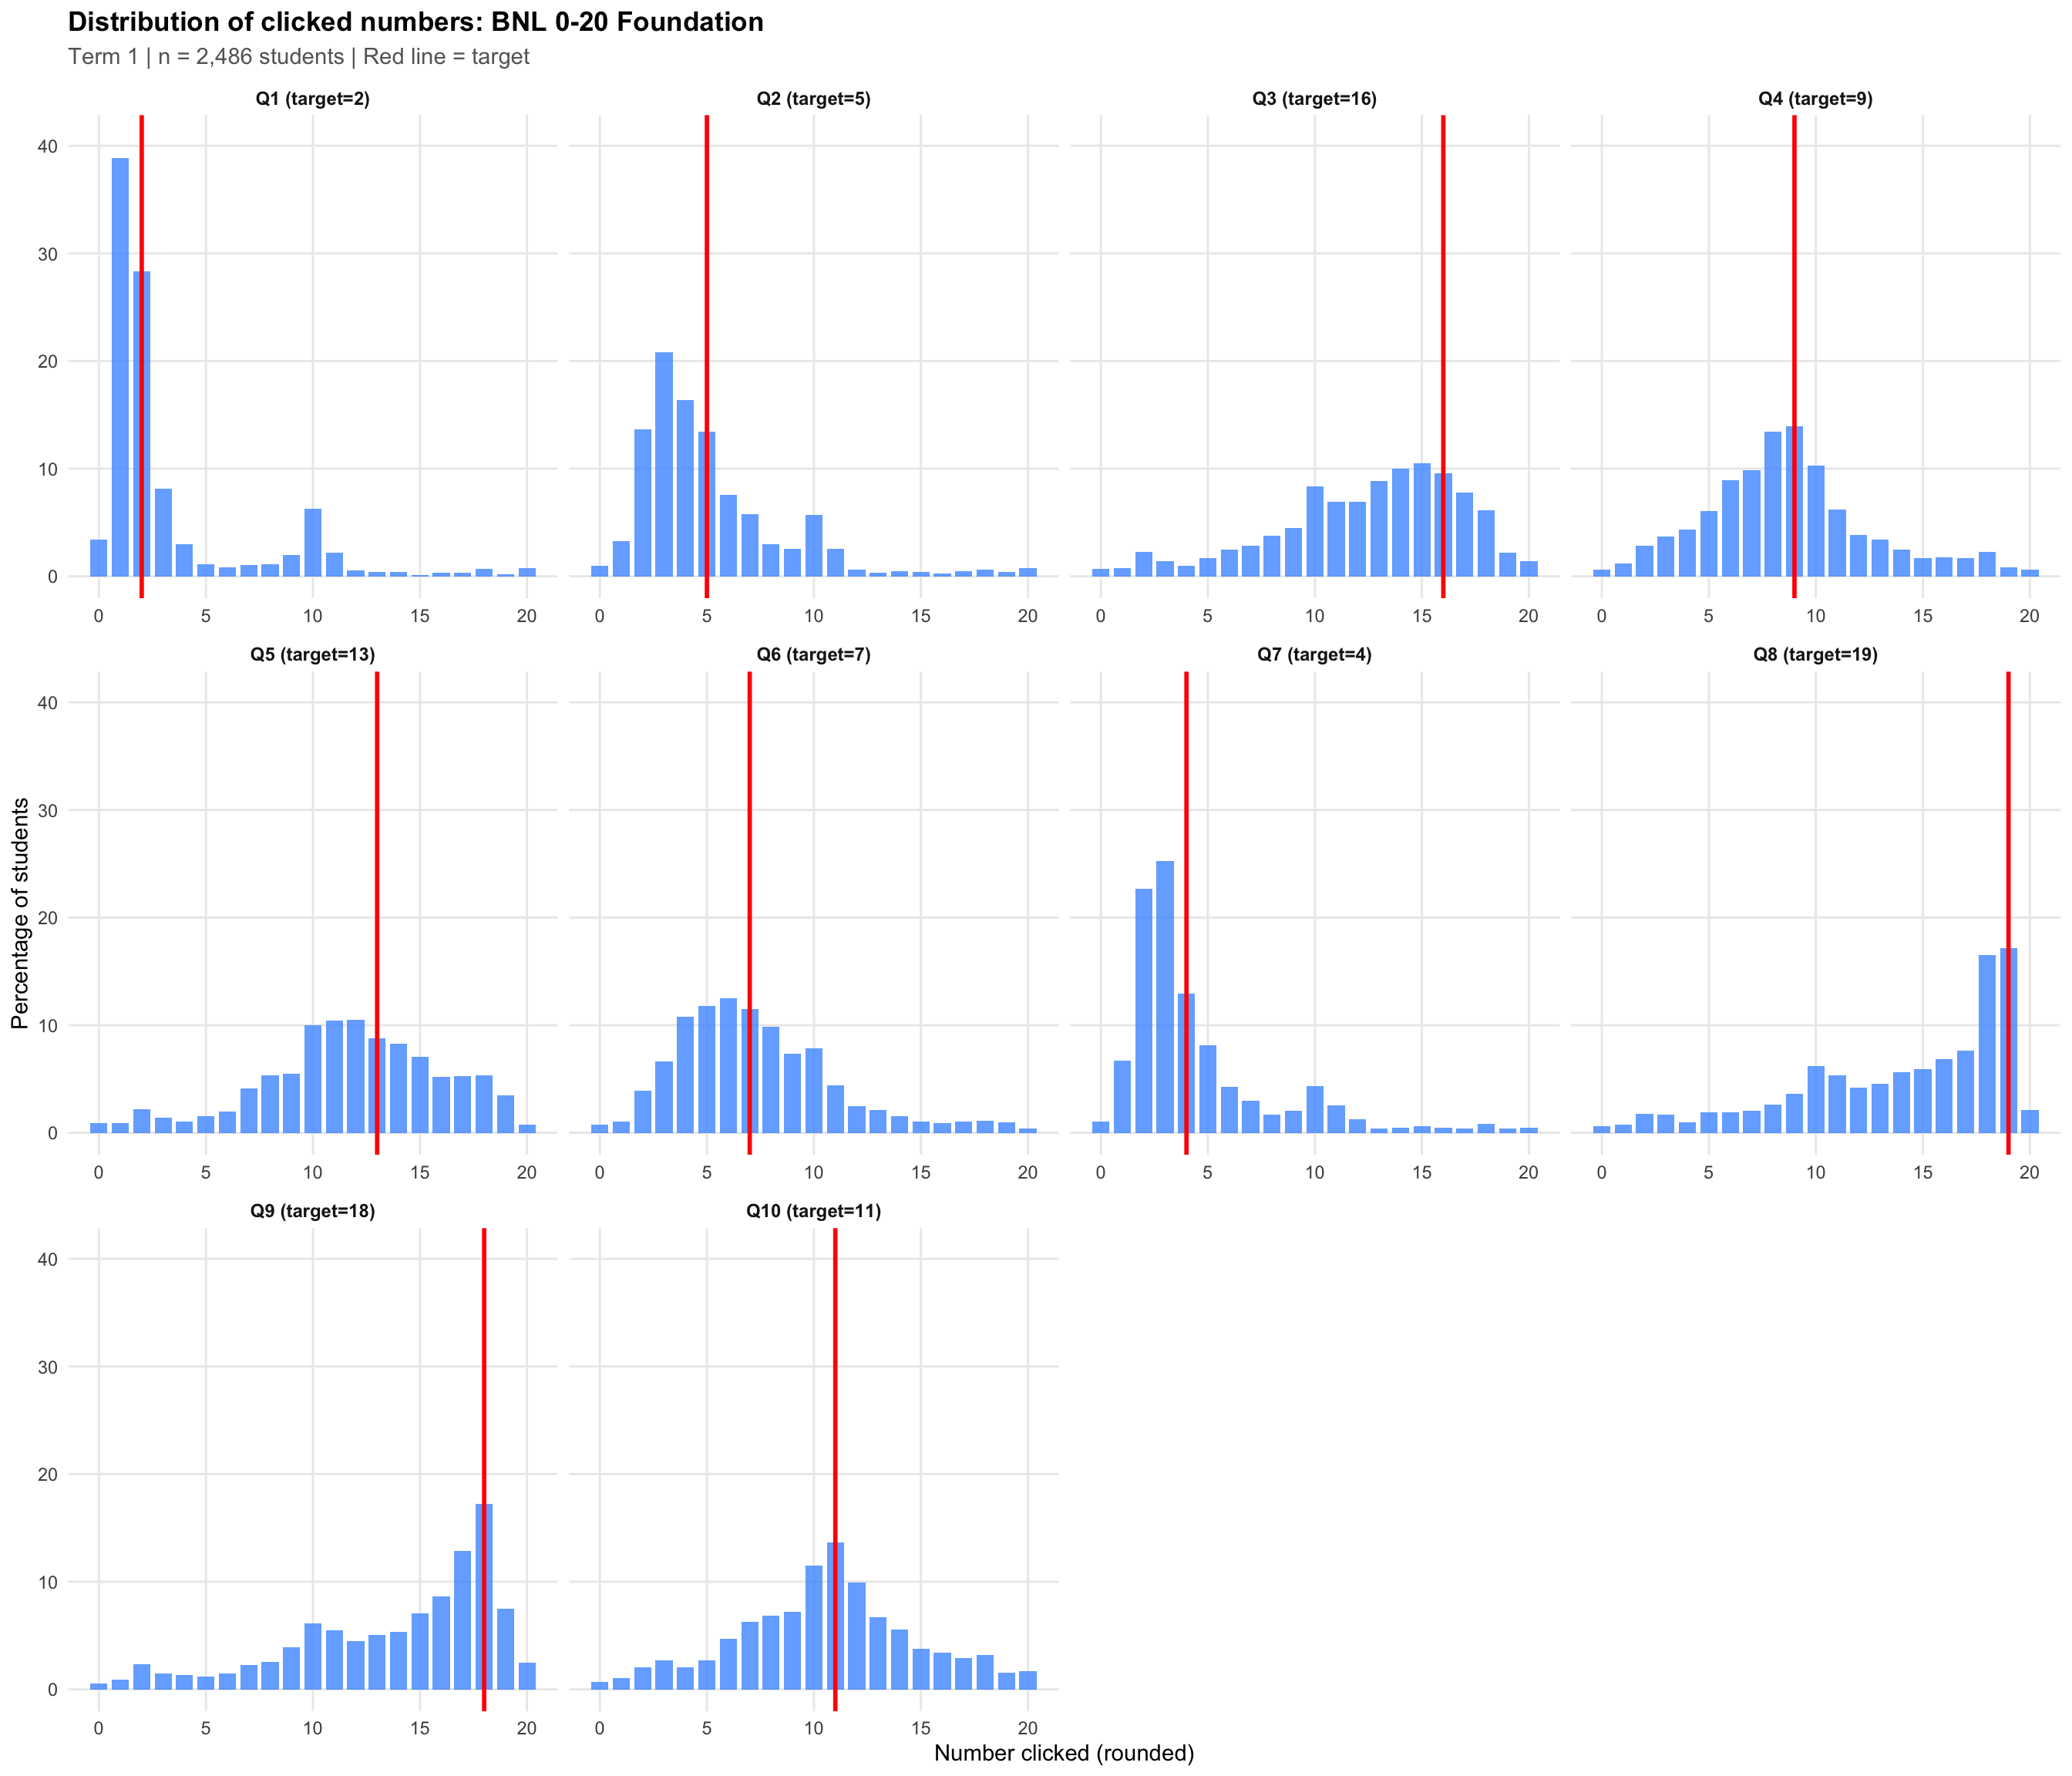
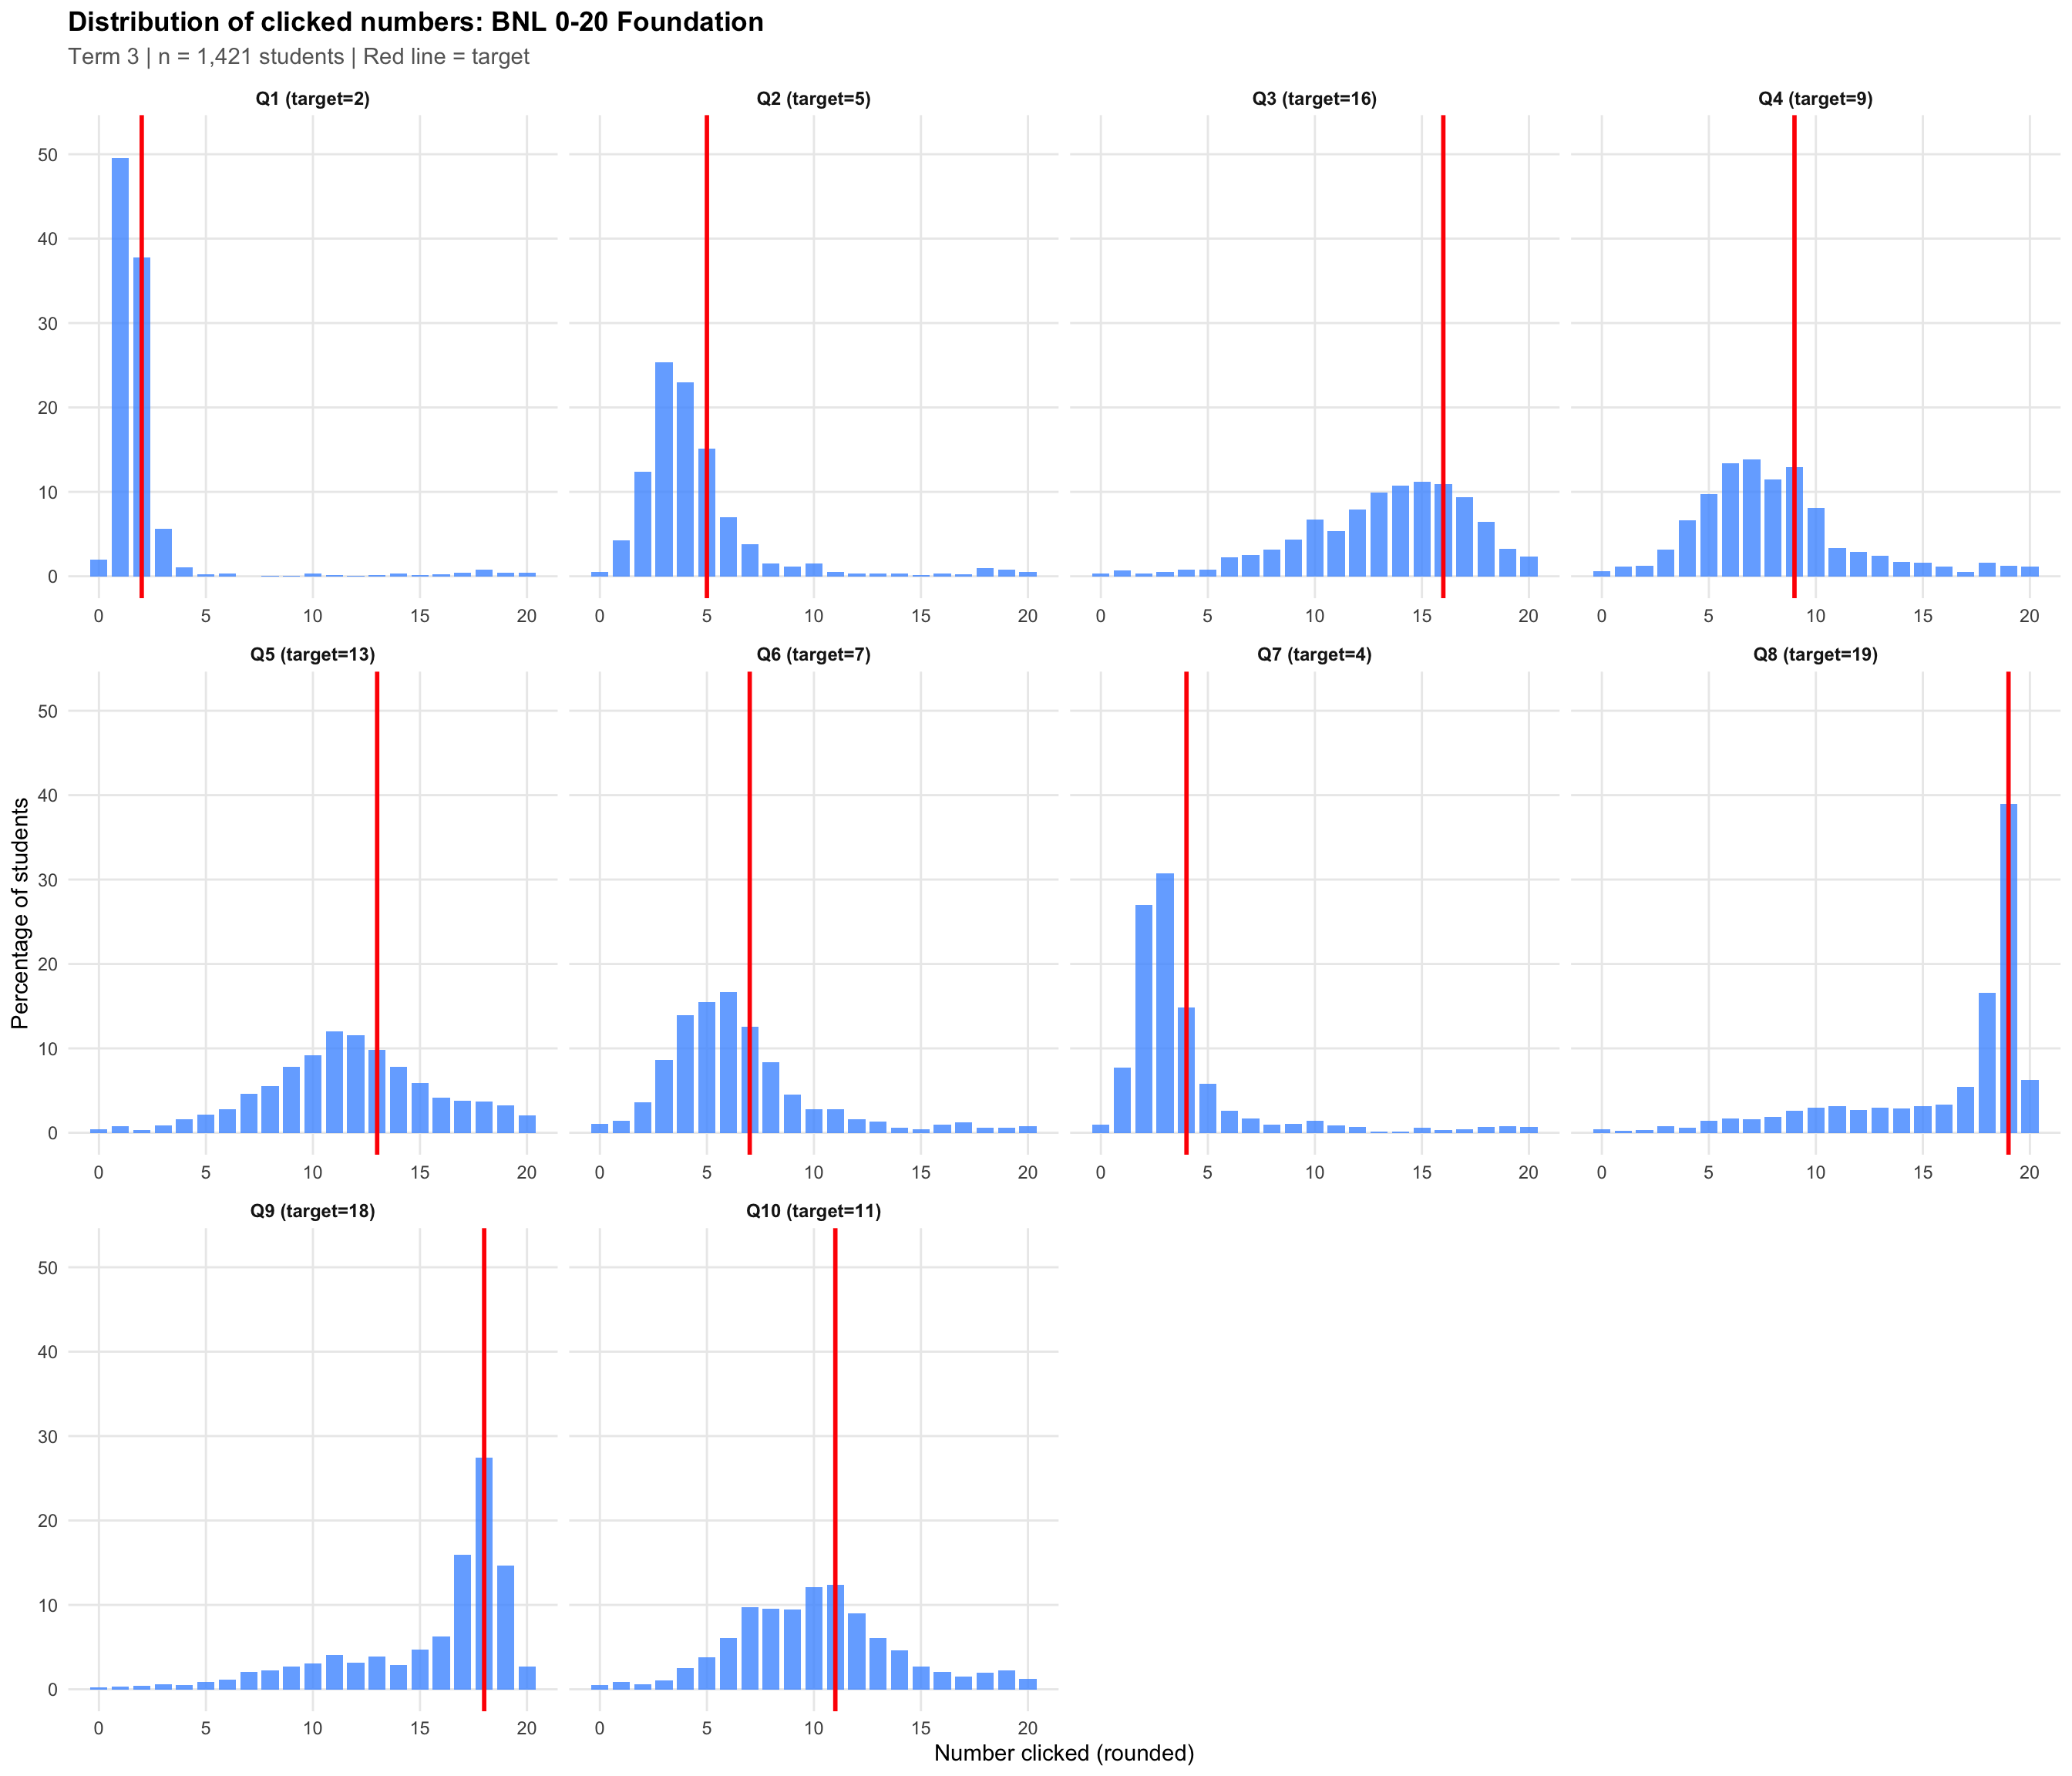
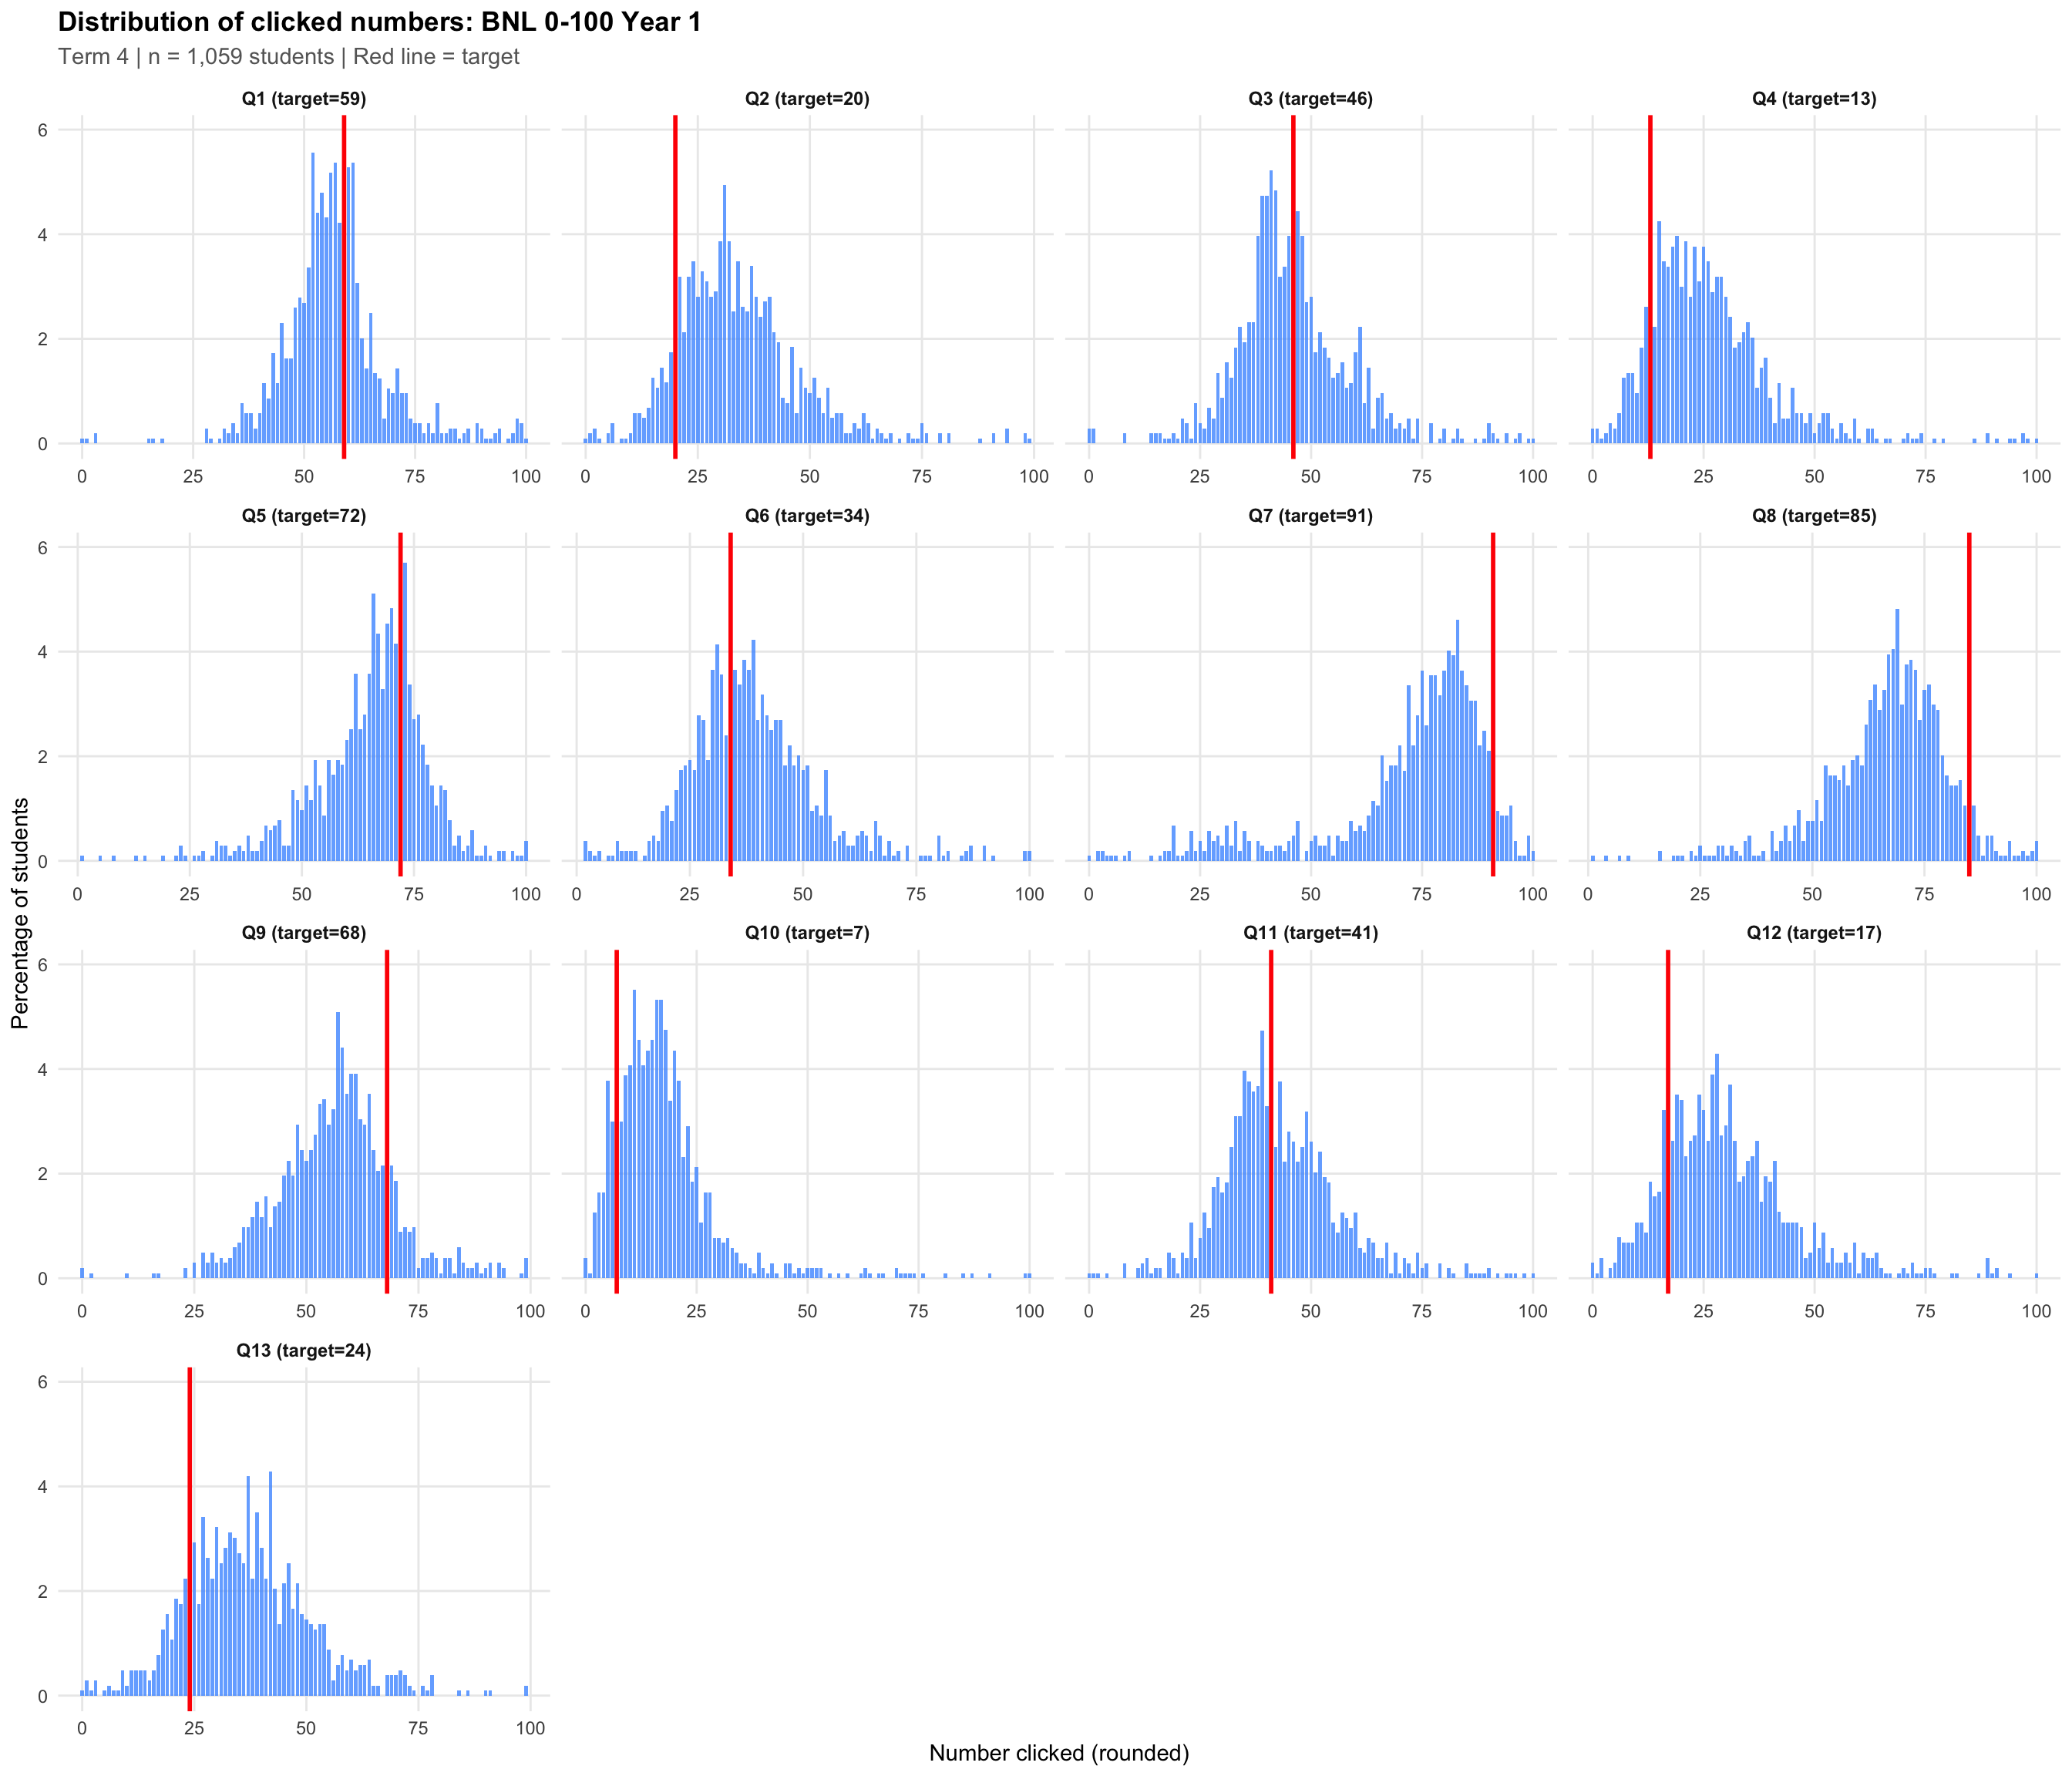
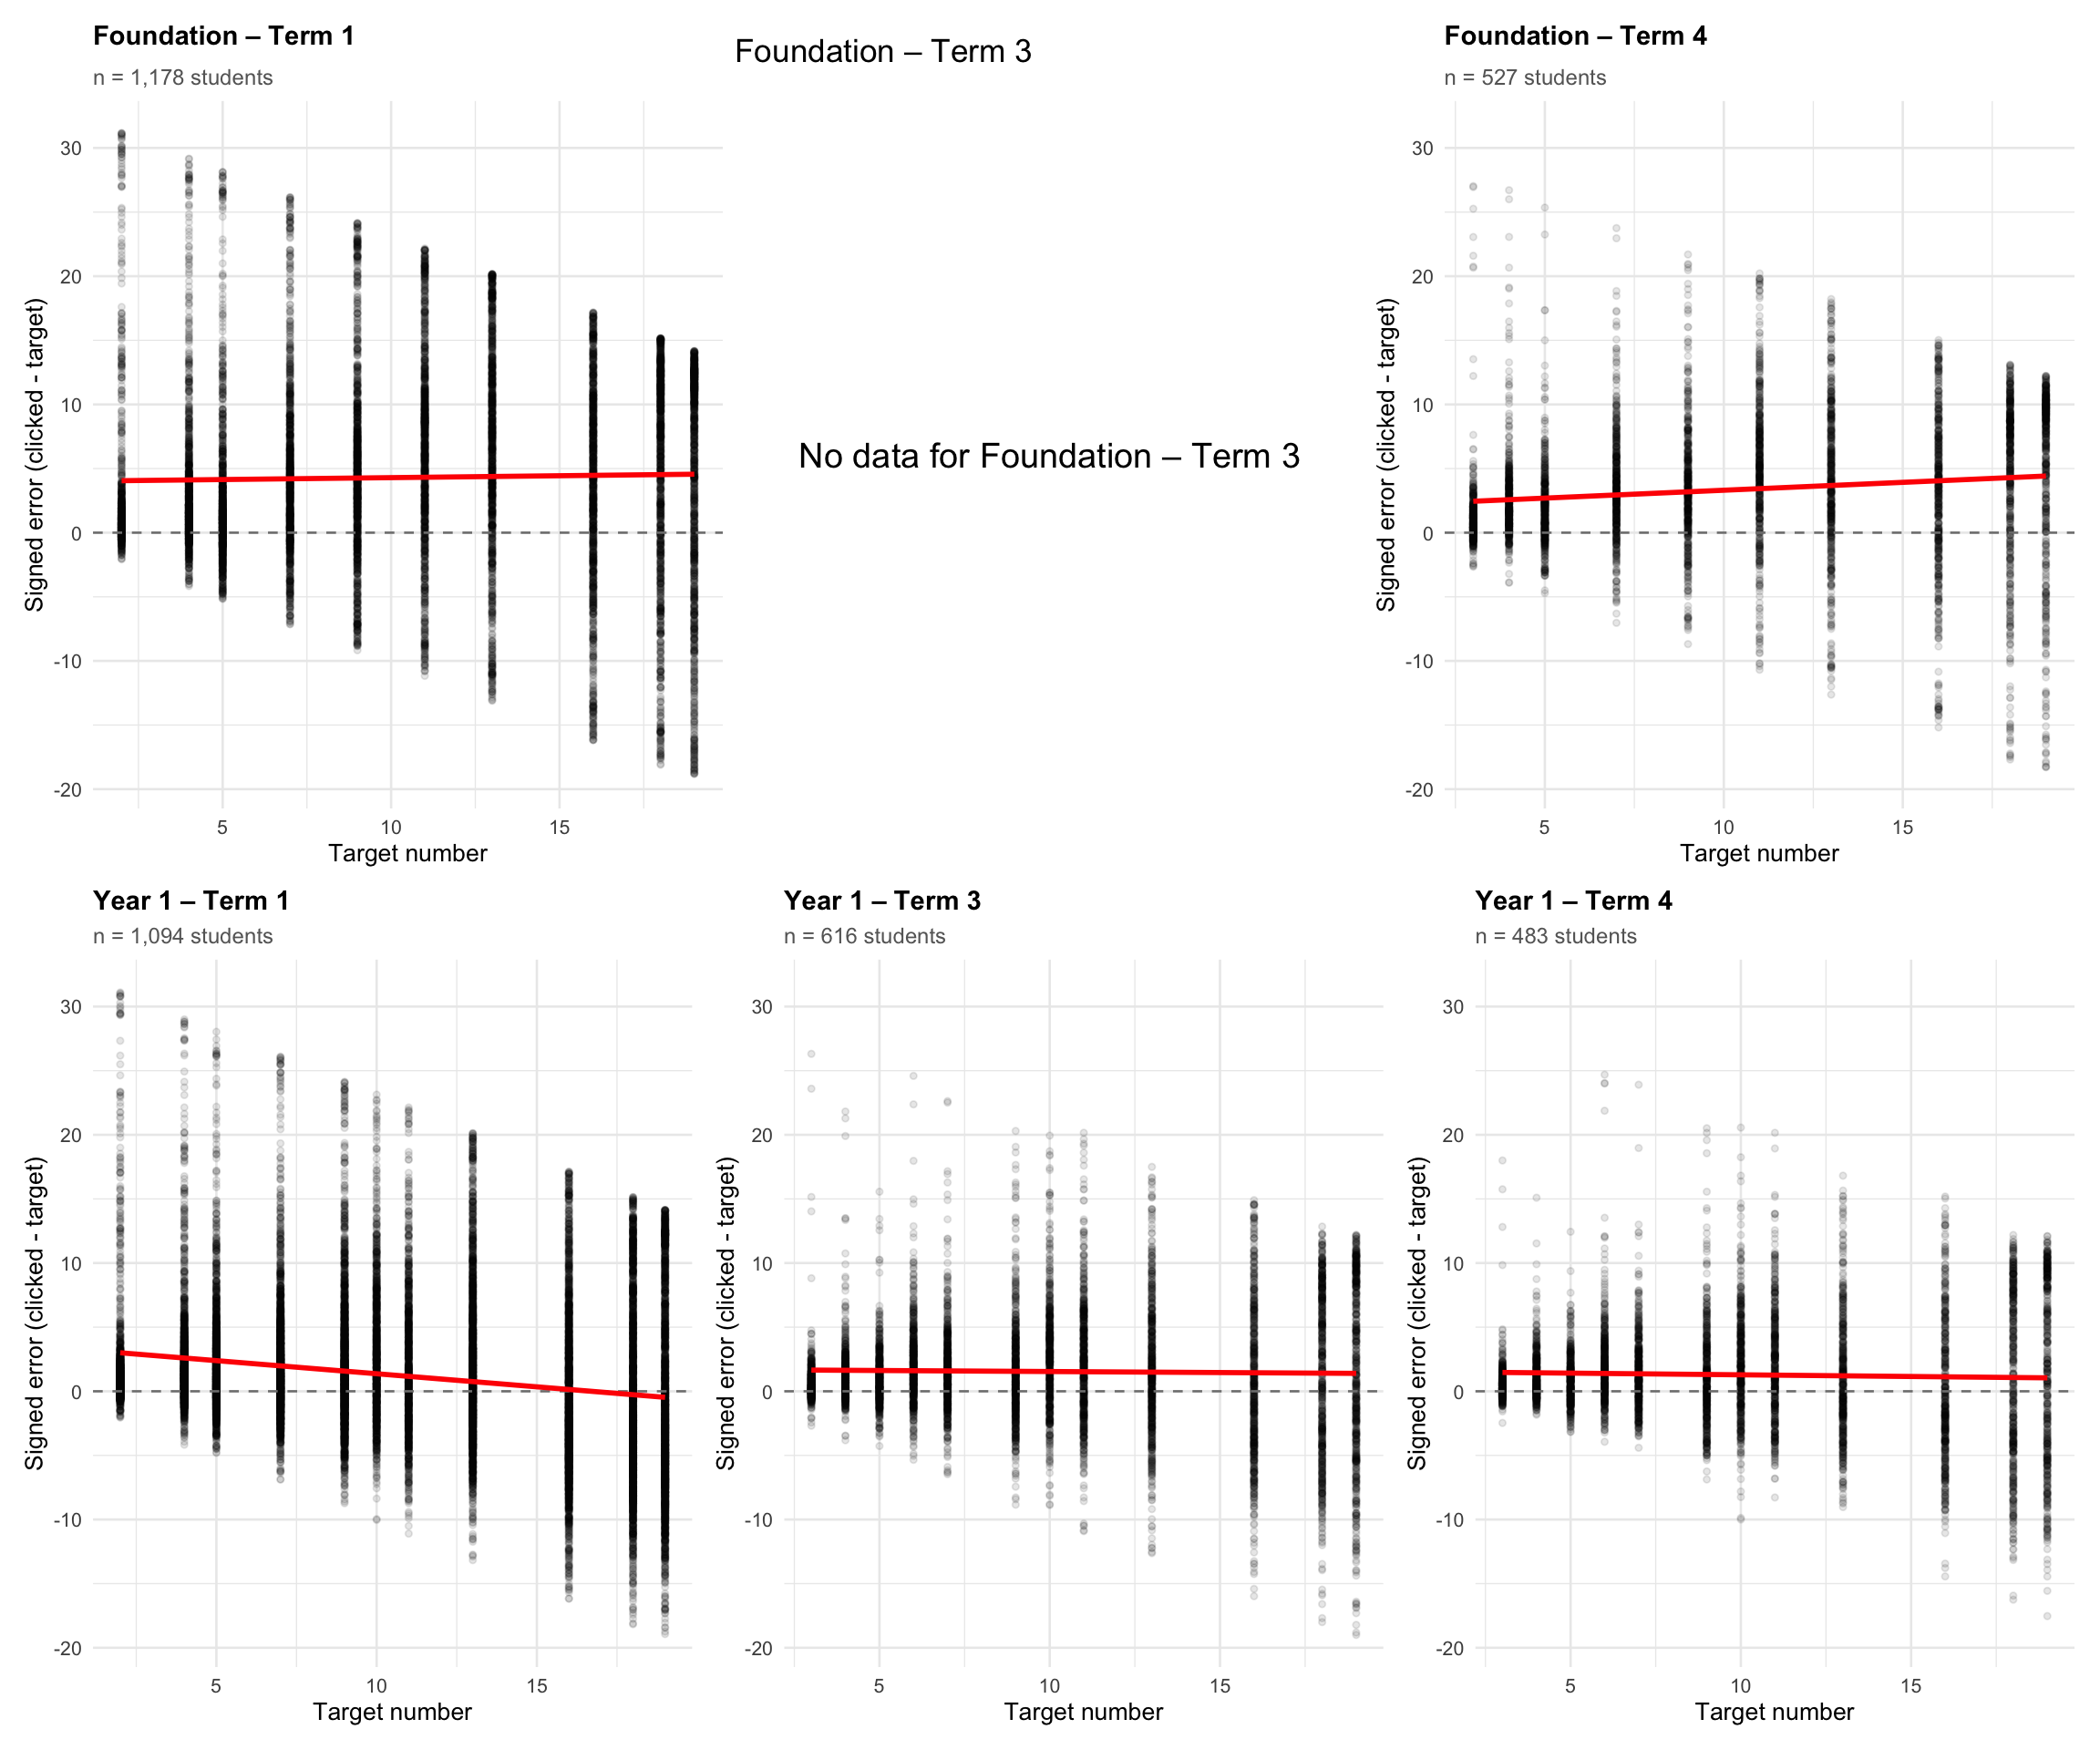
- Foundation BNL0-20: BOY 10 items; MOY/EOY +2 items appended (12 total); task moved to last in screener.
- Foundation UNL 0-20 (chairs/no chairs depending on form): BOY 10; MOY/EOY +2 appended (12); task moved to first in screener.
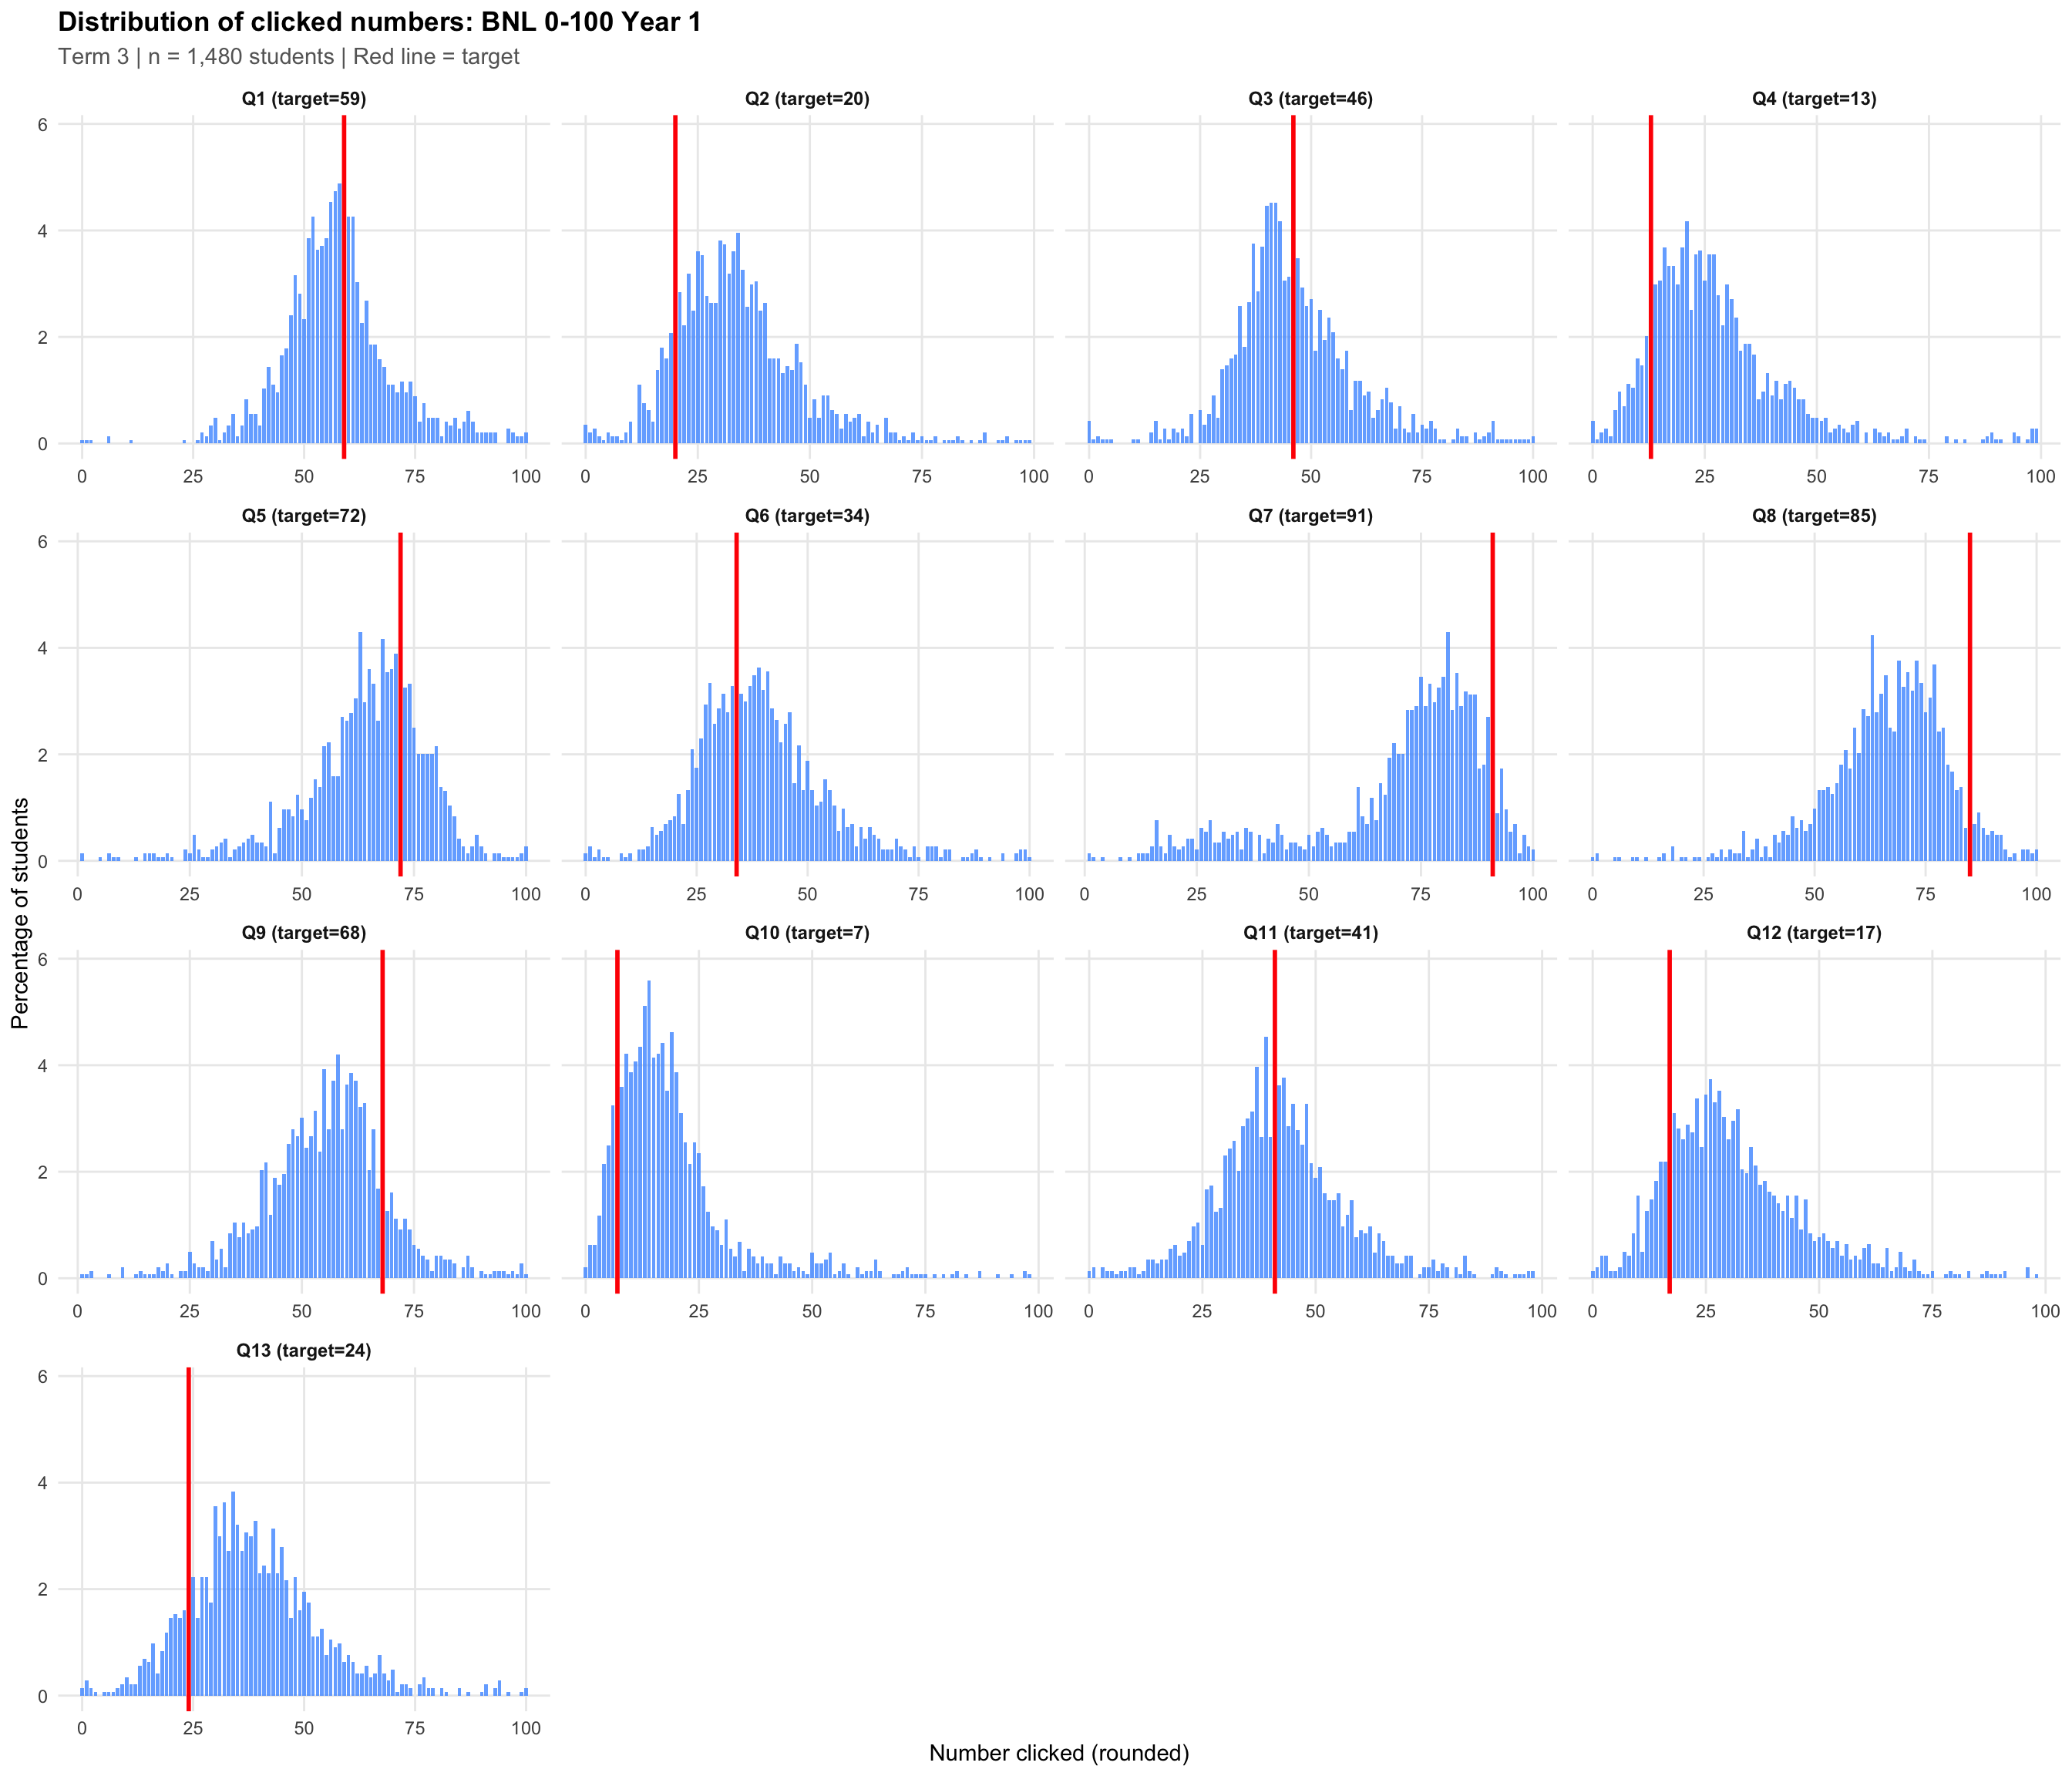
- Year 1 BNL0-100: BOY 20 items (10 stimuli repeated twice); MOY/EOY changed to 10 stimuli once +2 appended (12 total); task moved to last in screener.
- Year 1 UNL0-20: BOY 10; MOY/EOY +2 appended (12); task moved to first in screener.
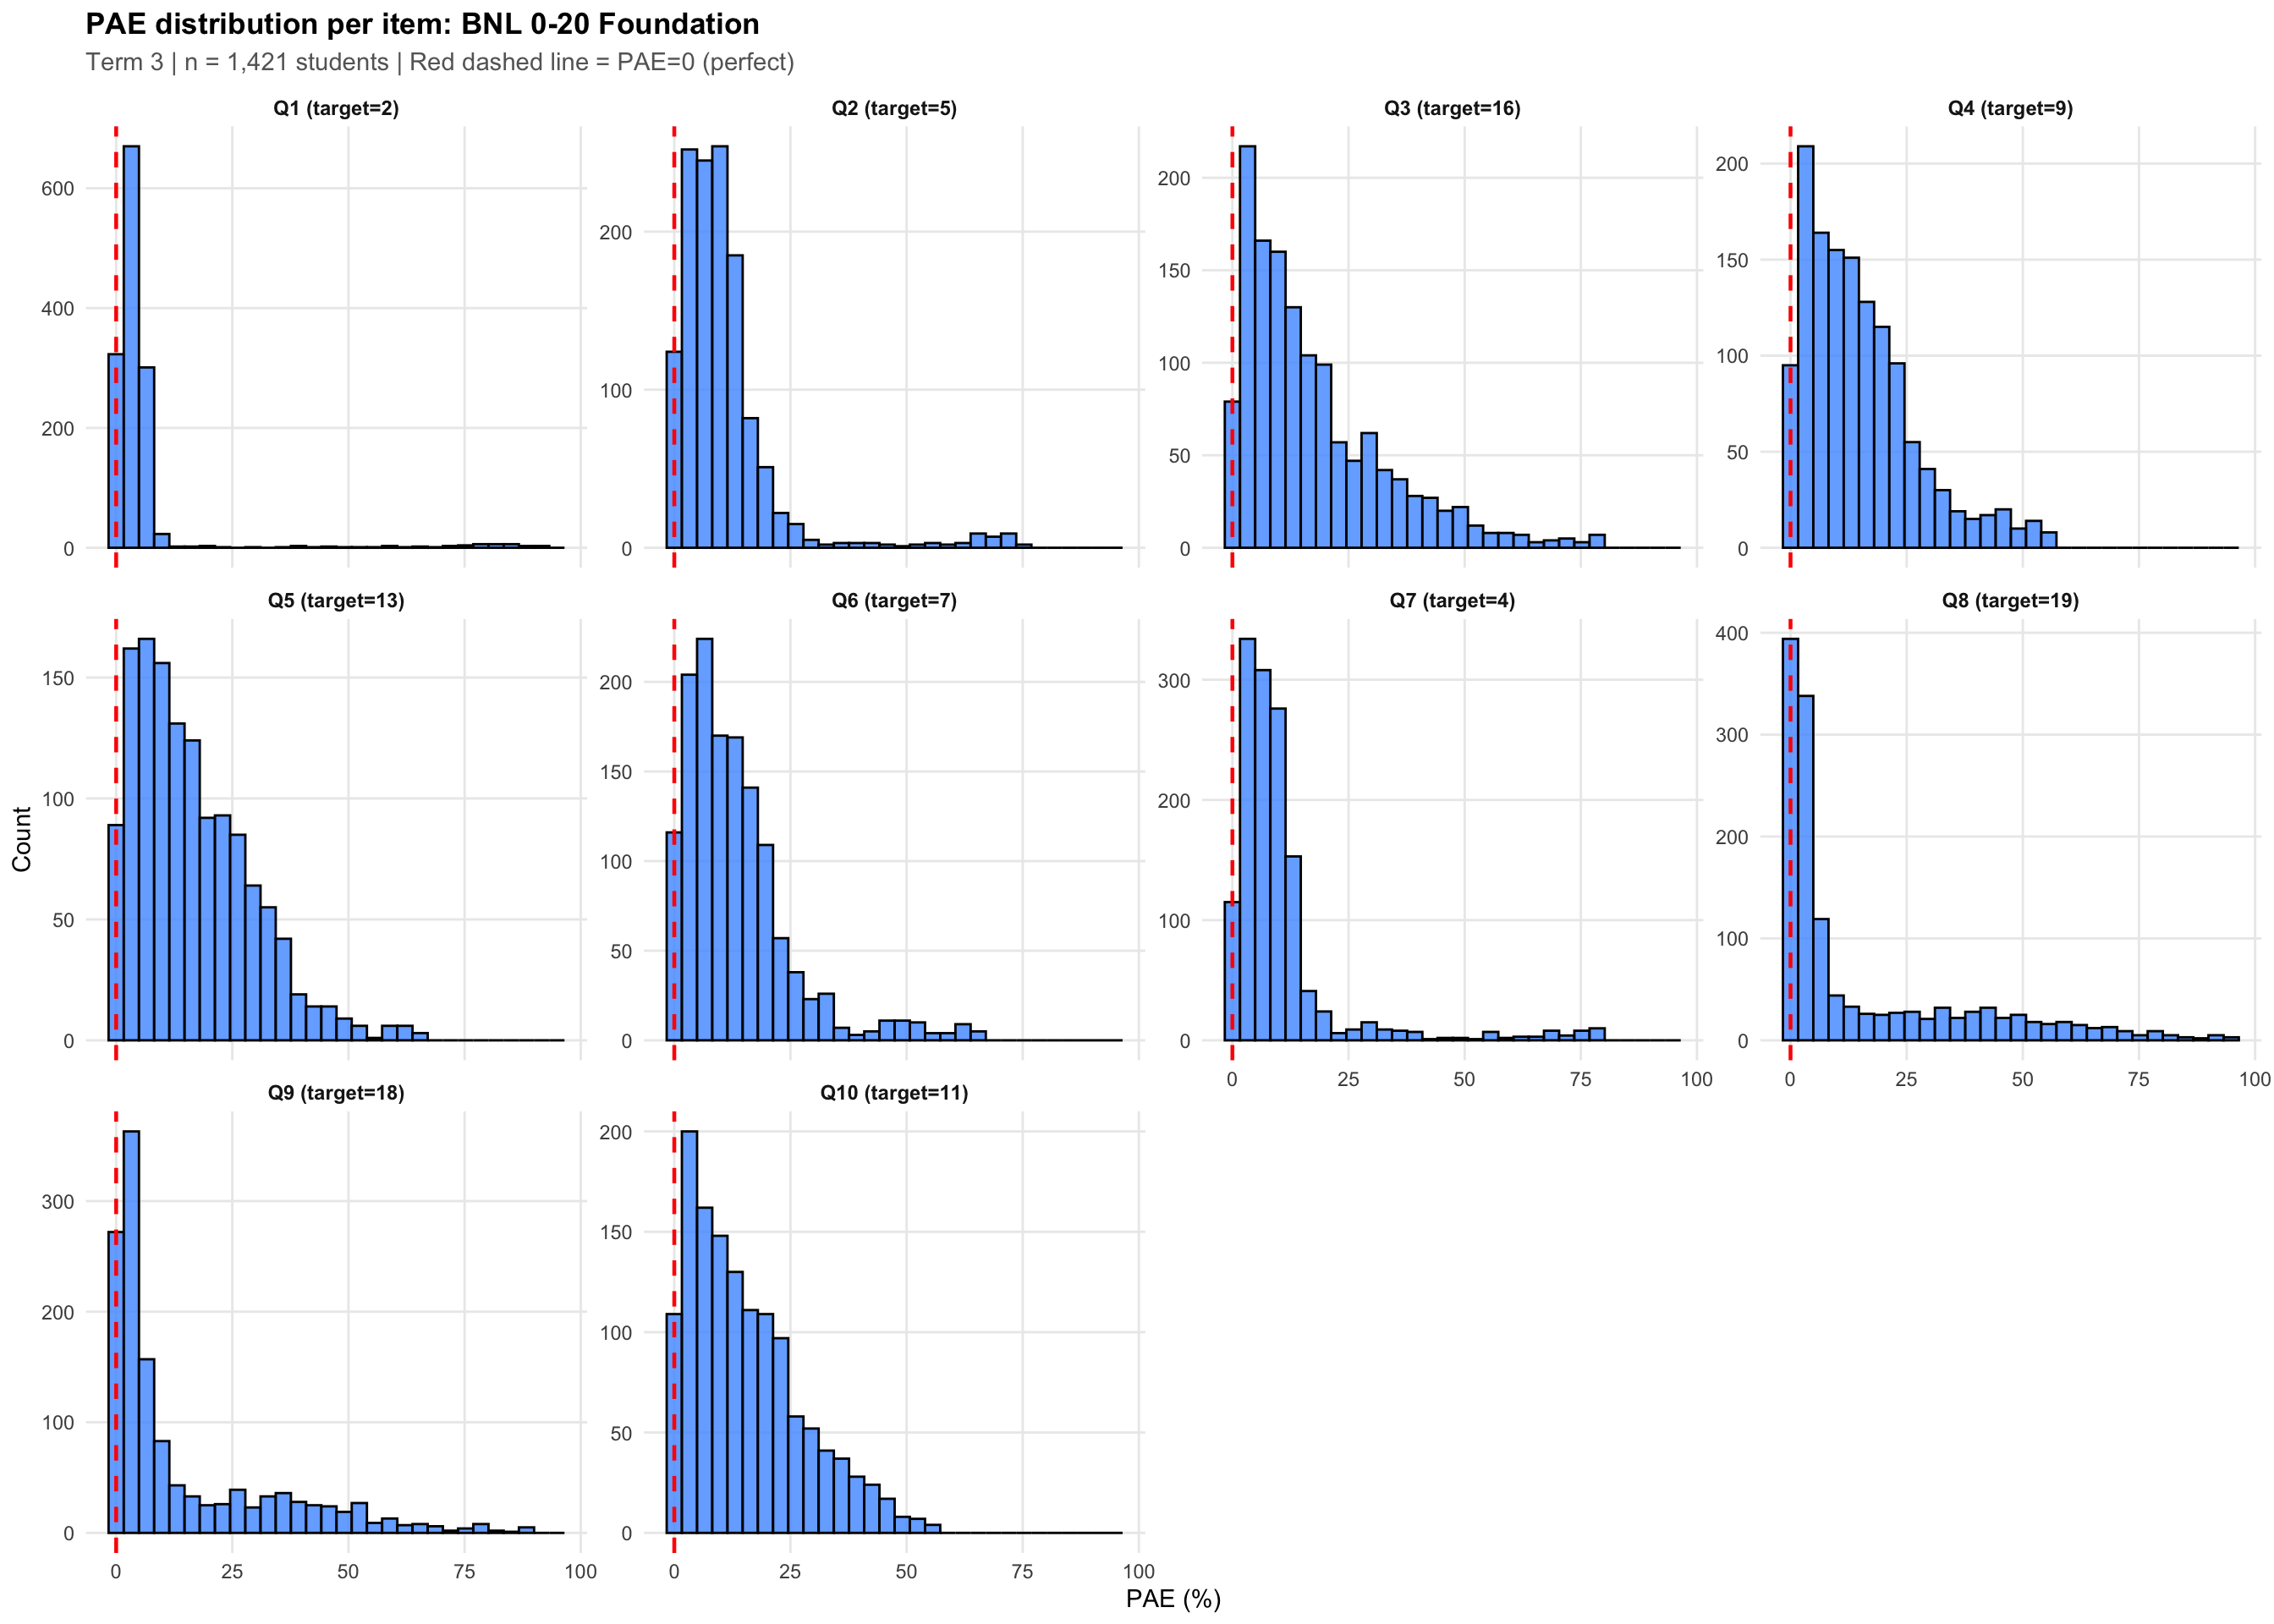
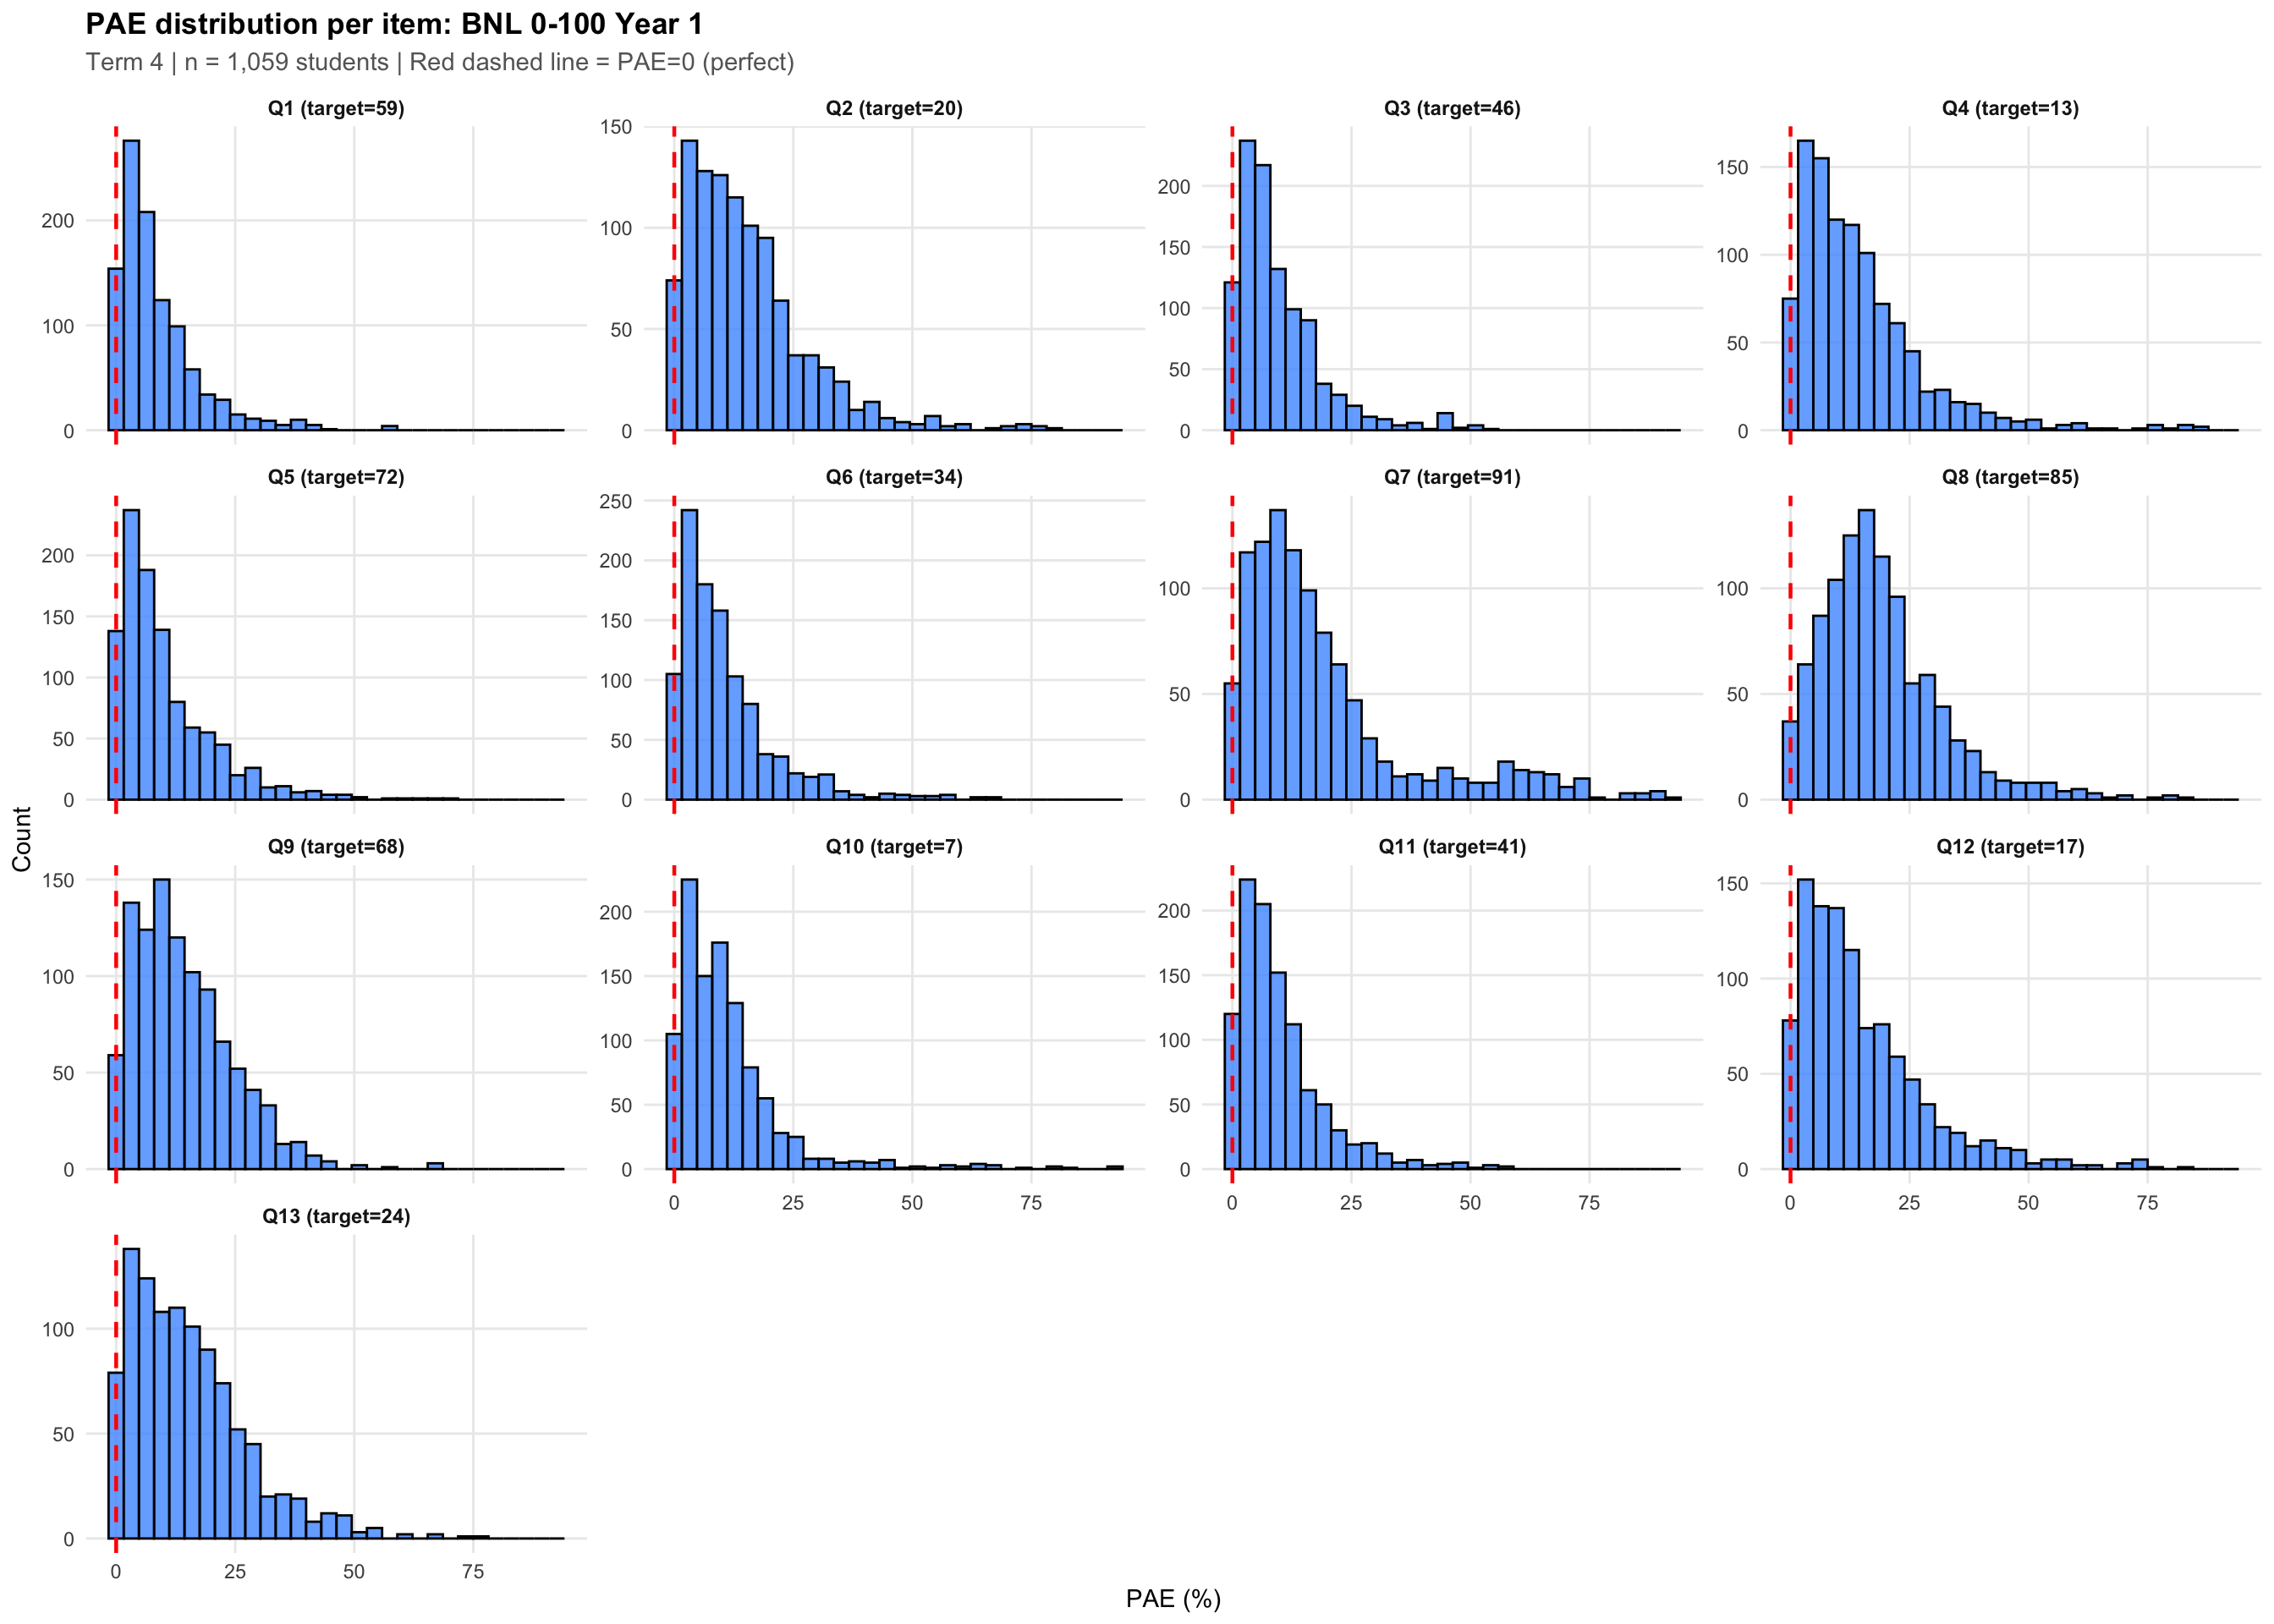
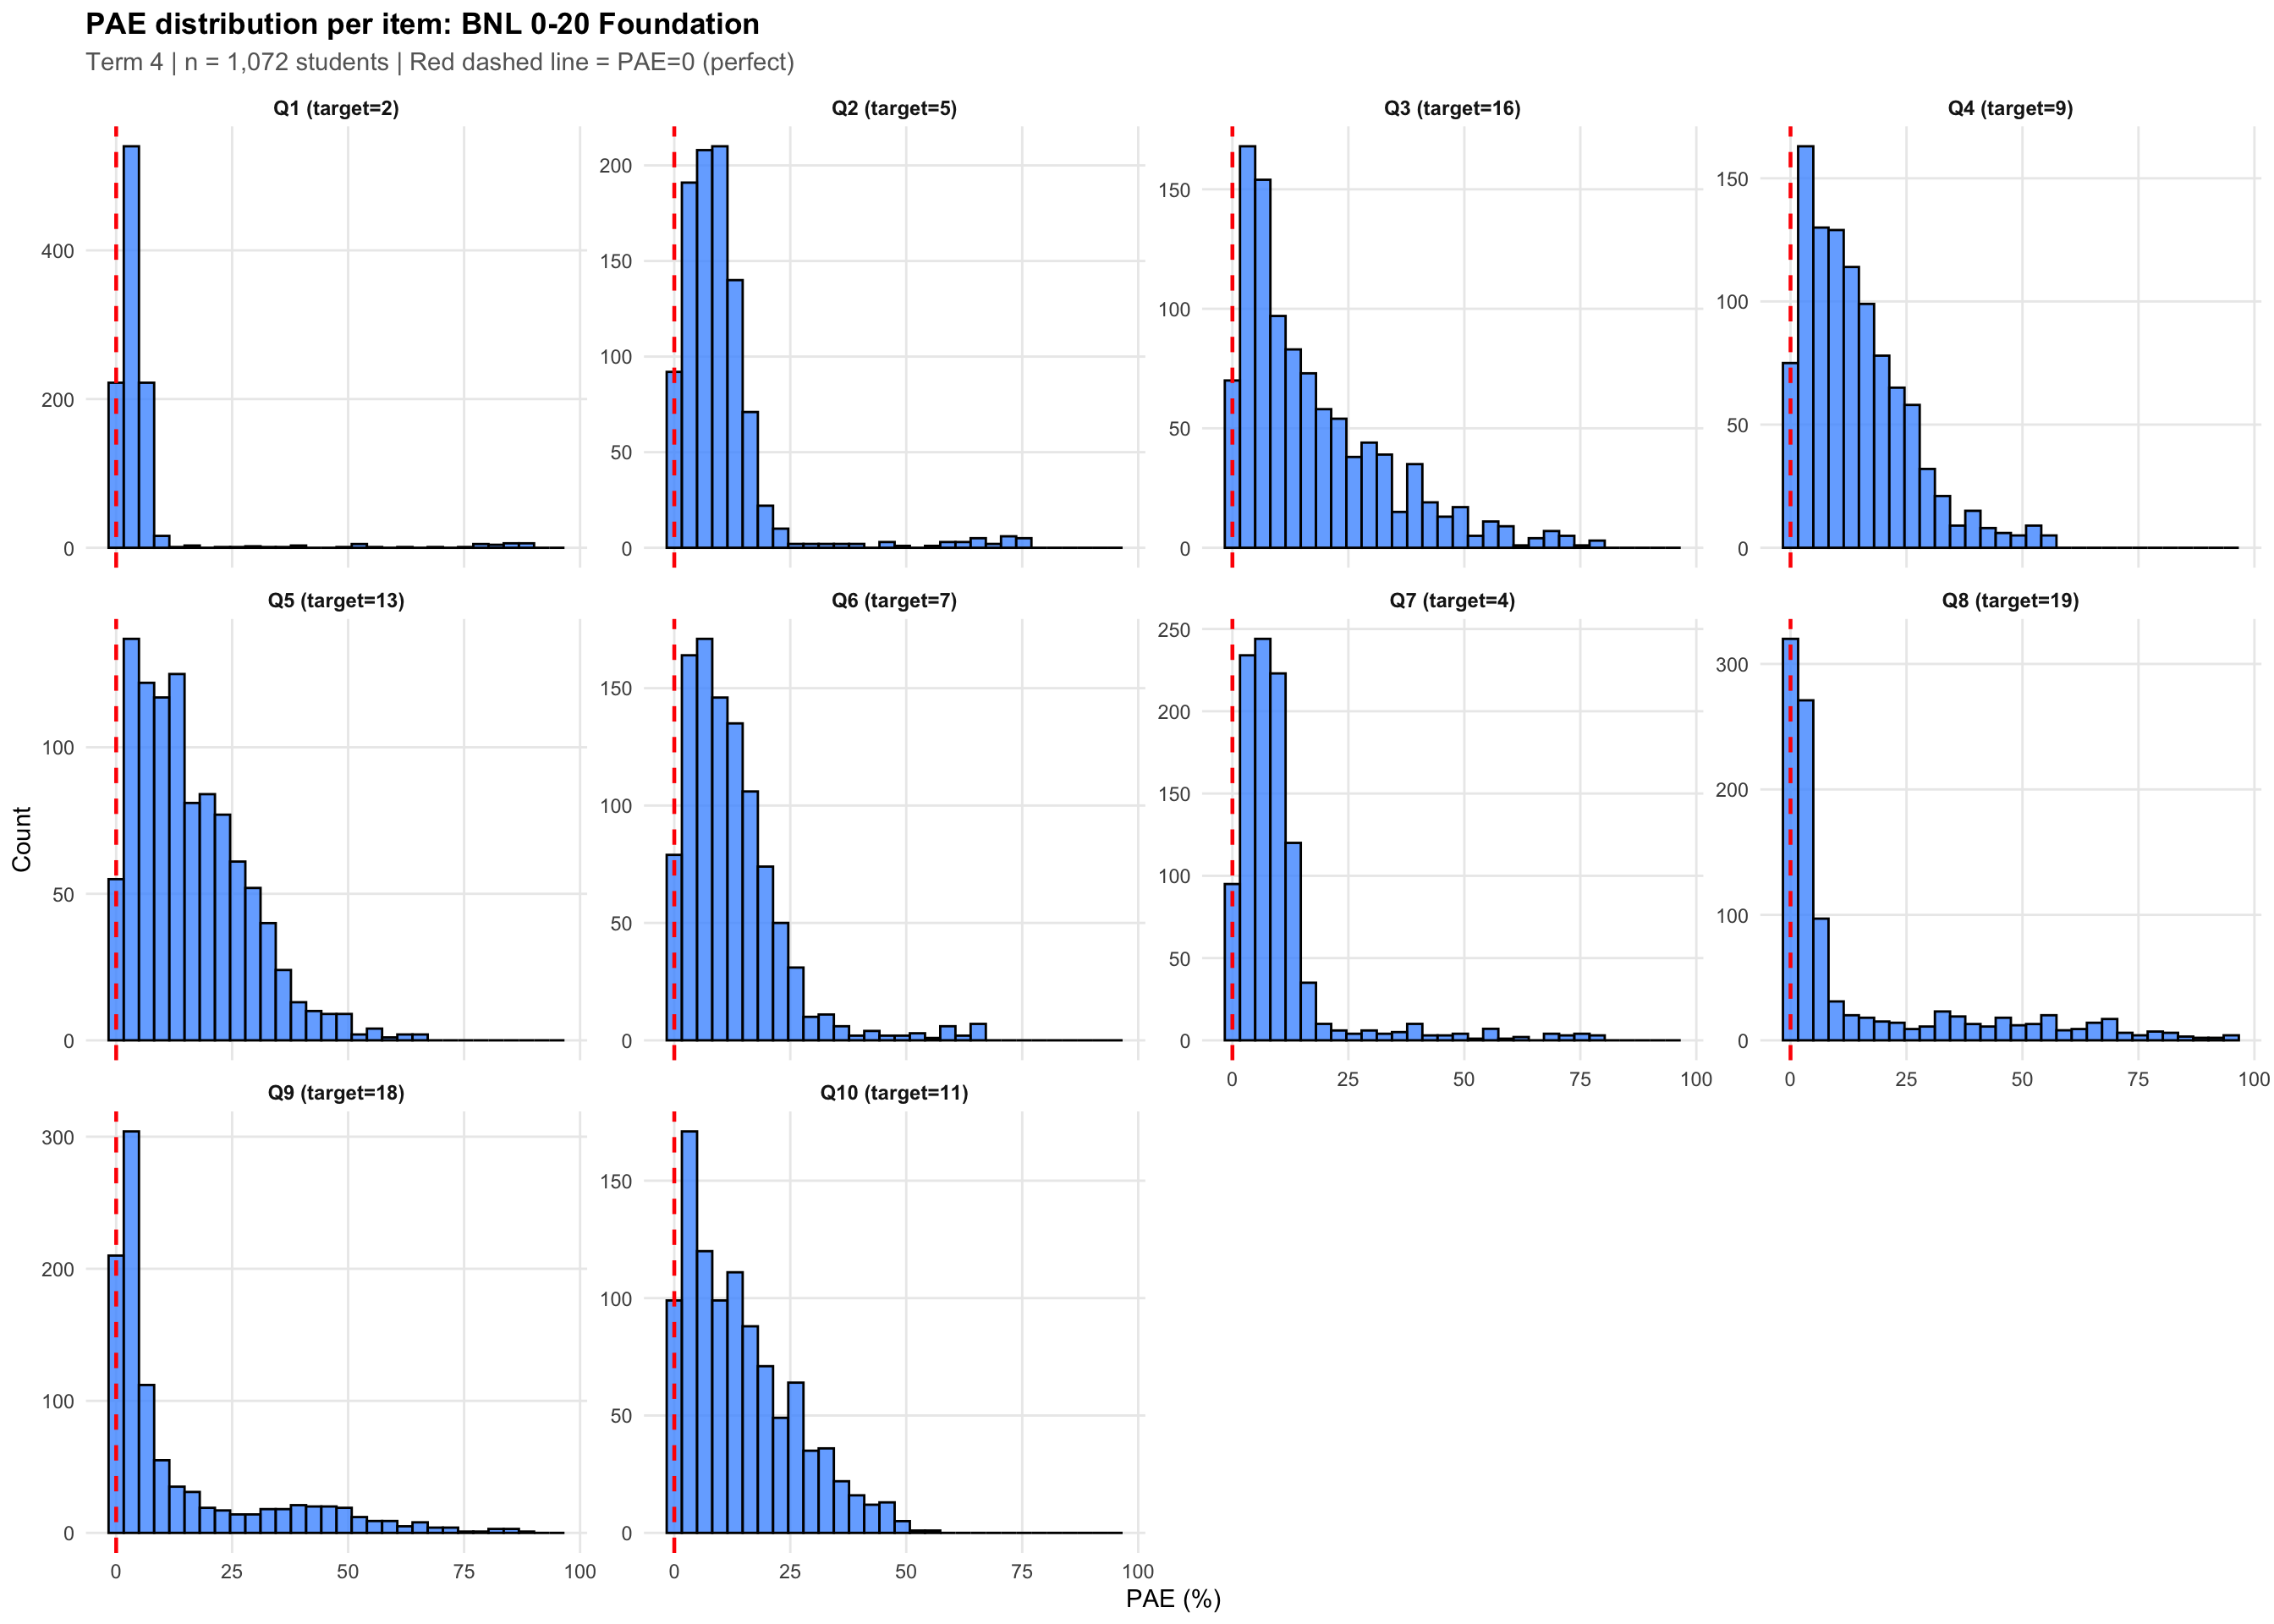
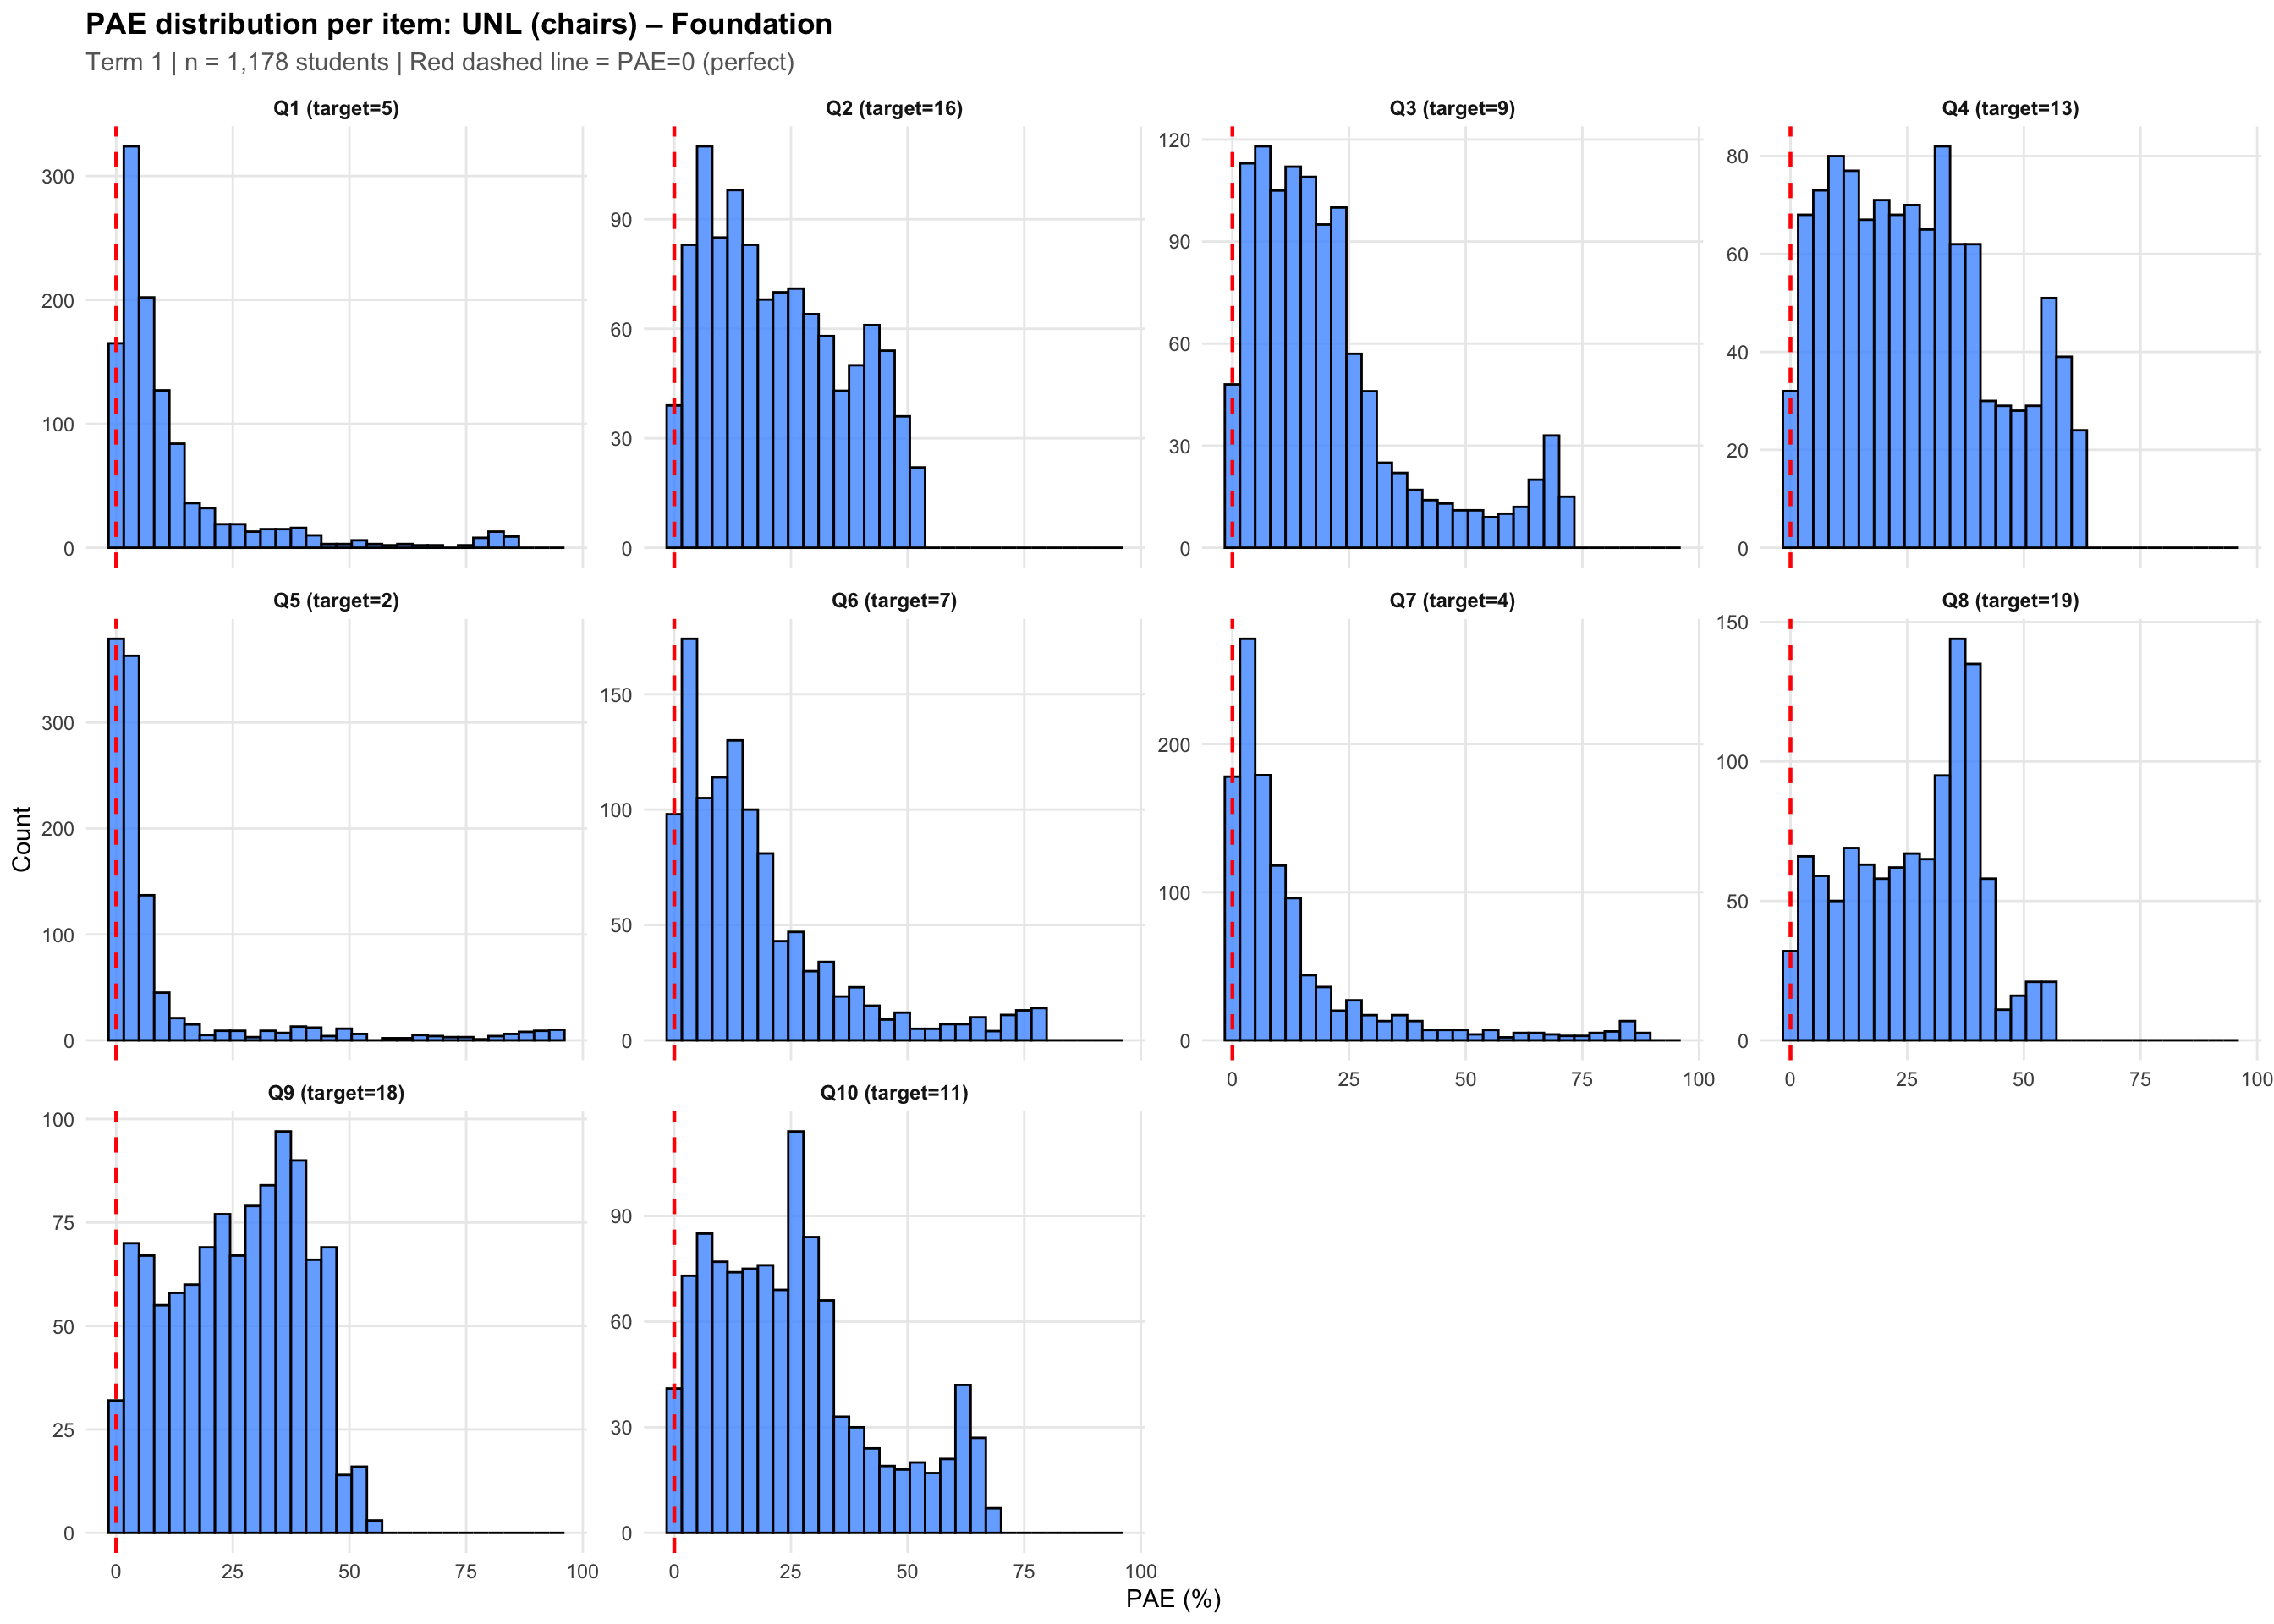
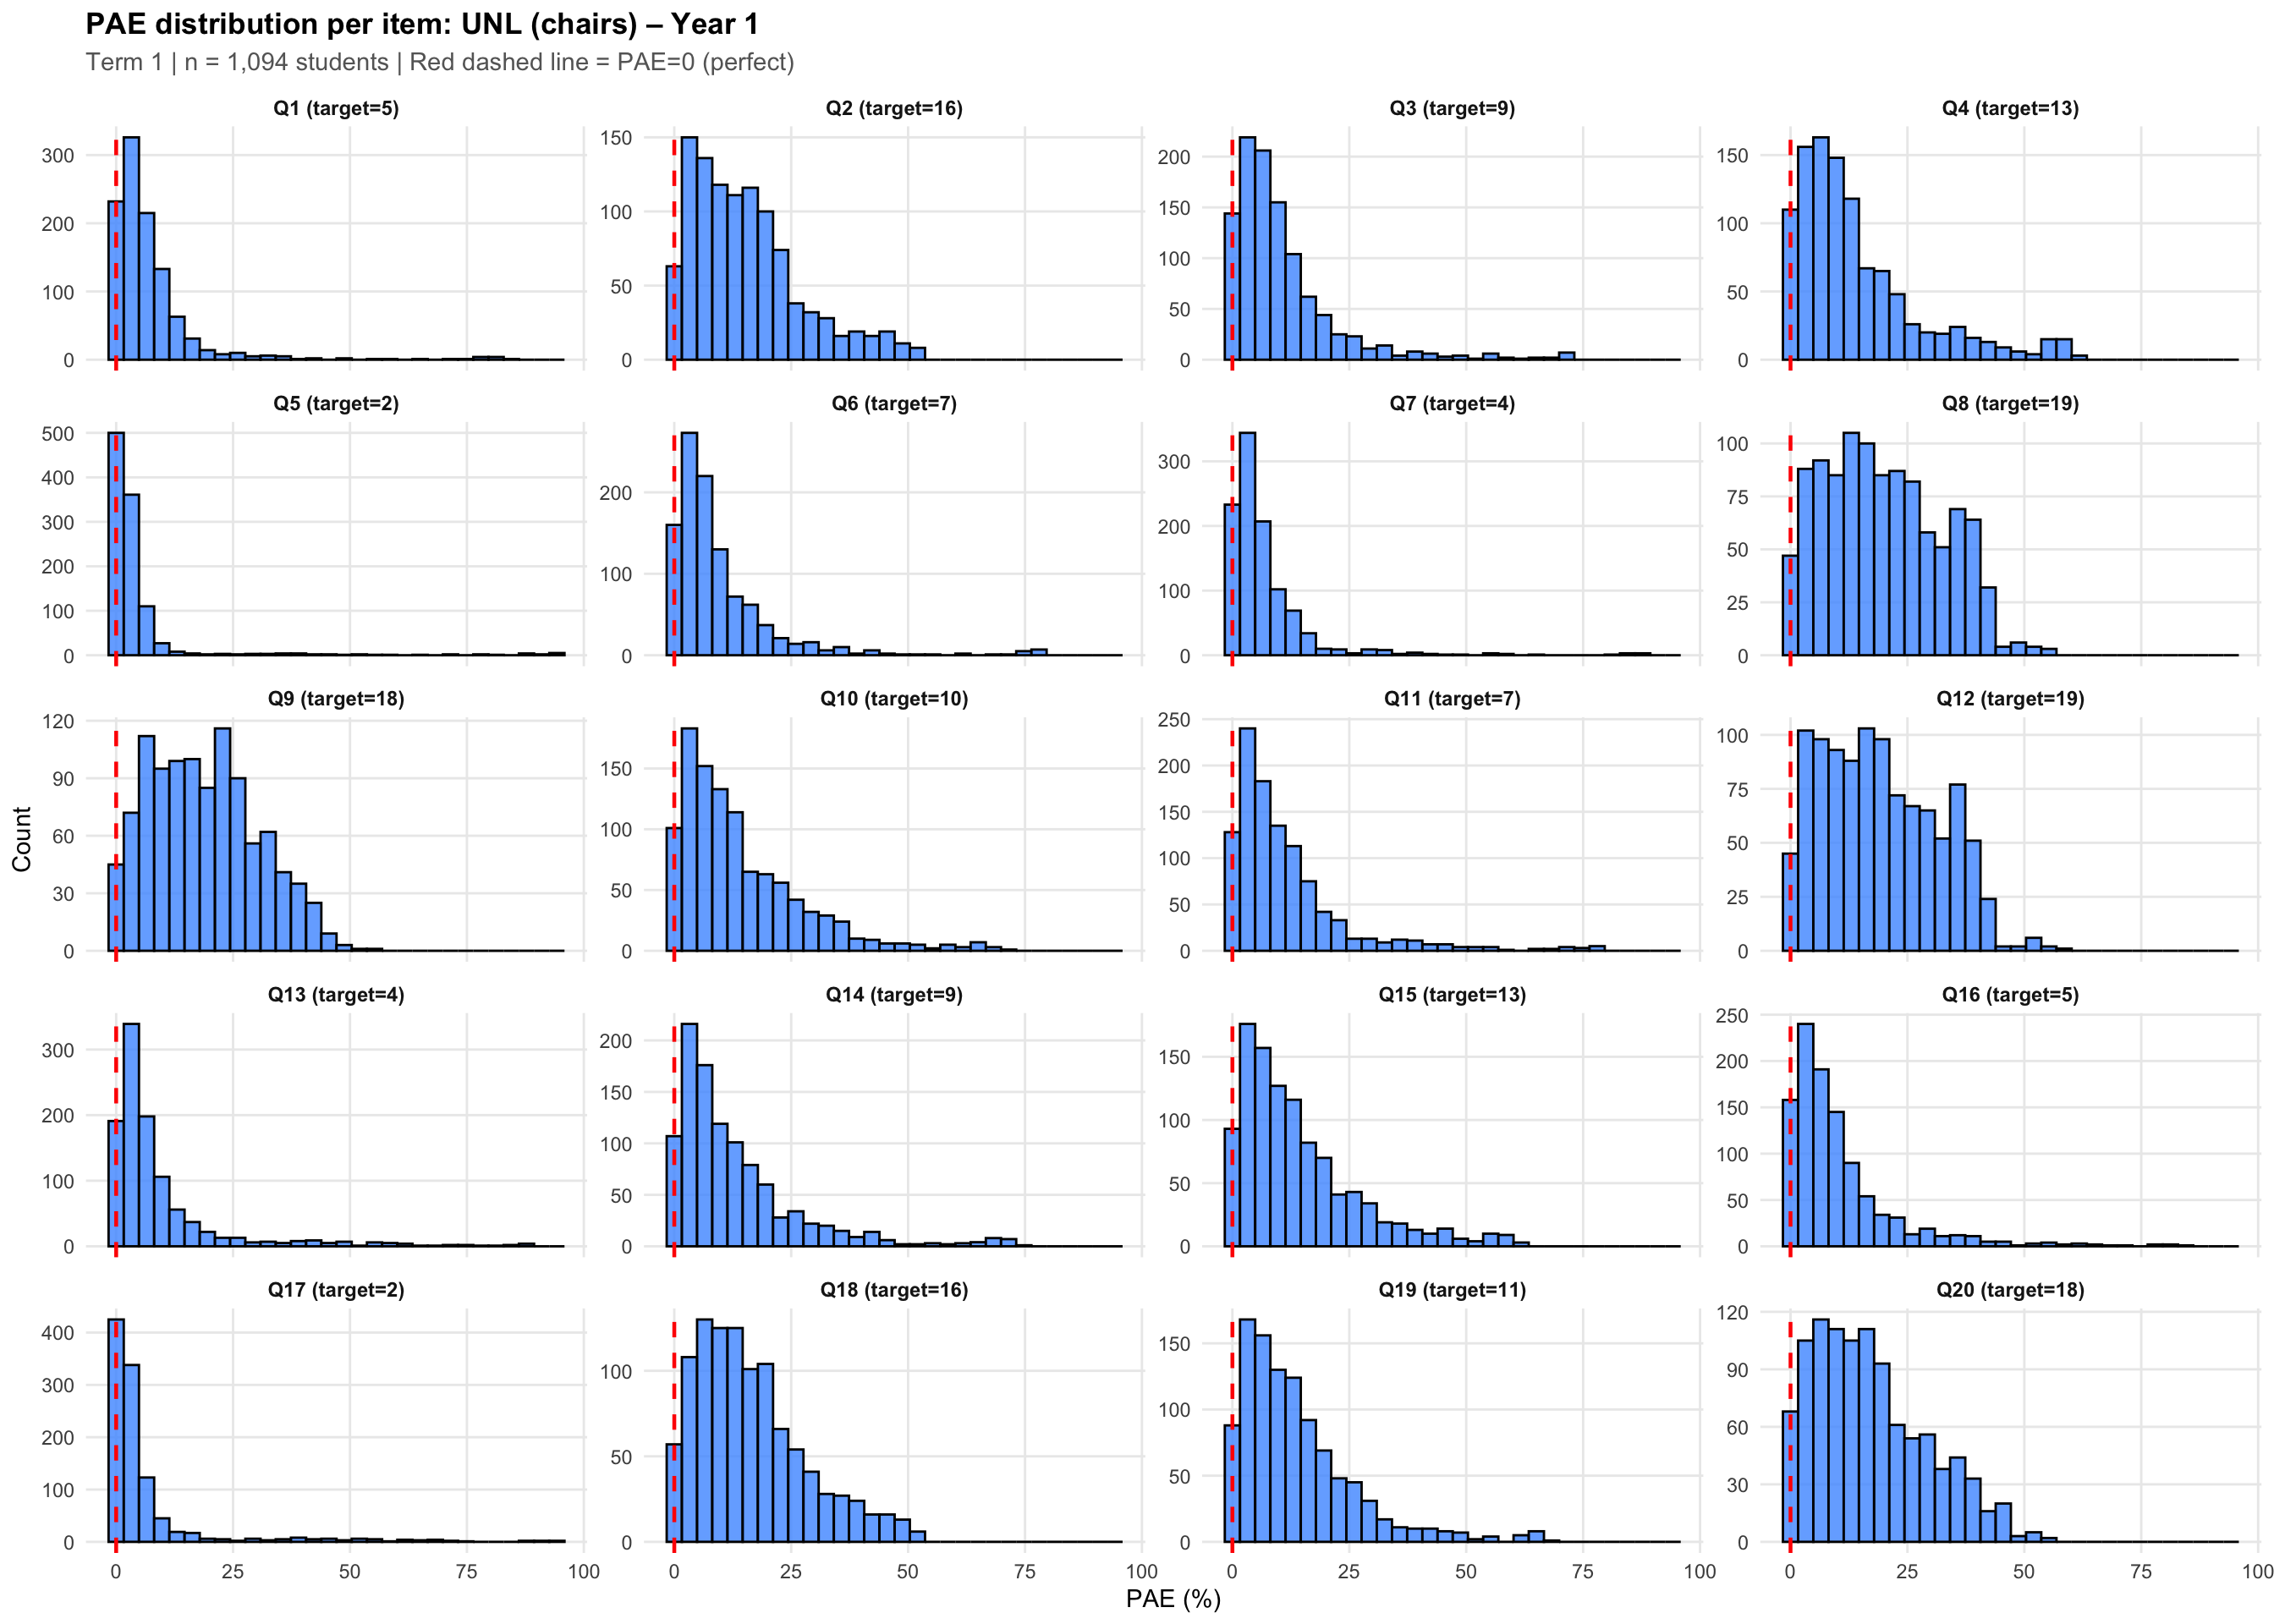
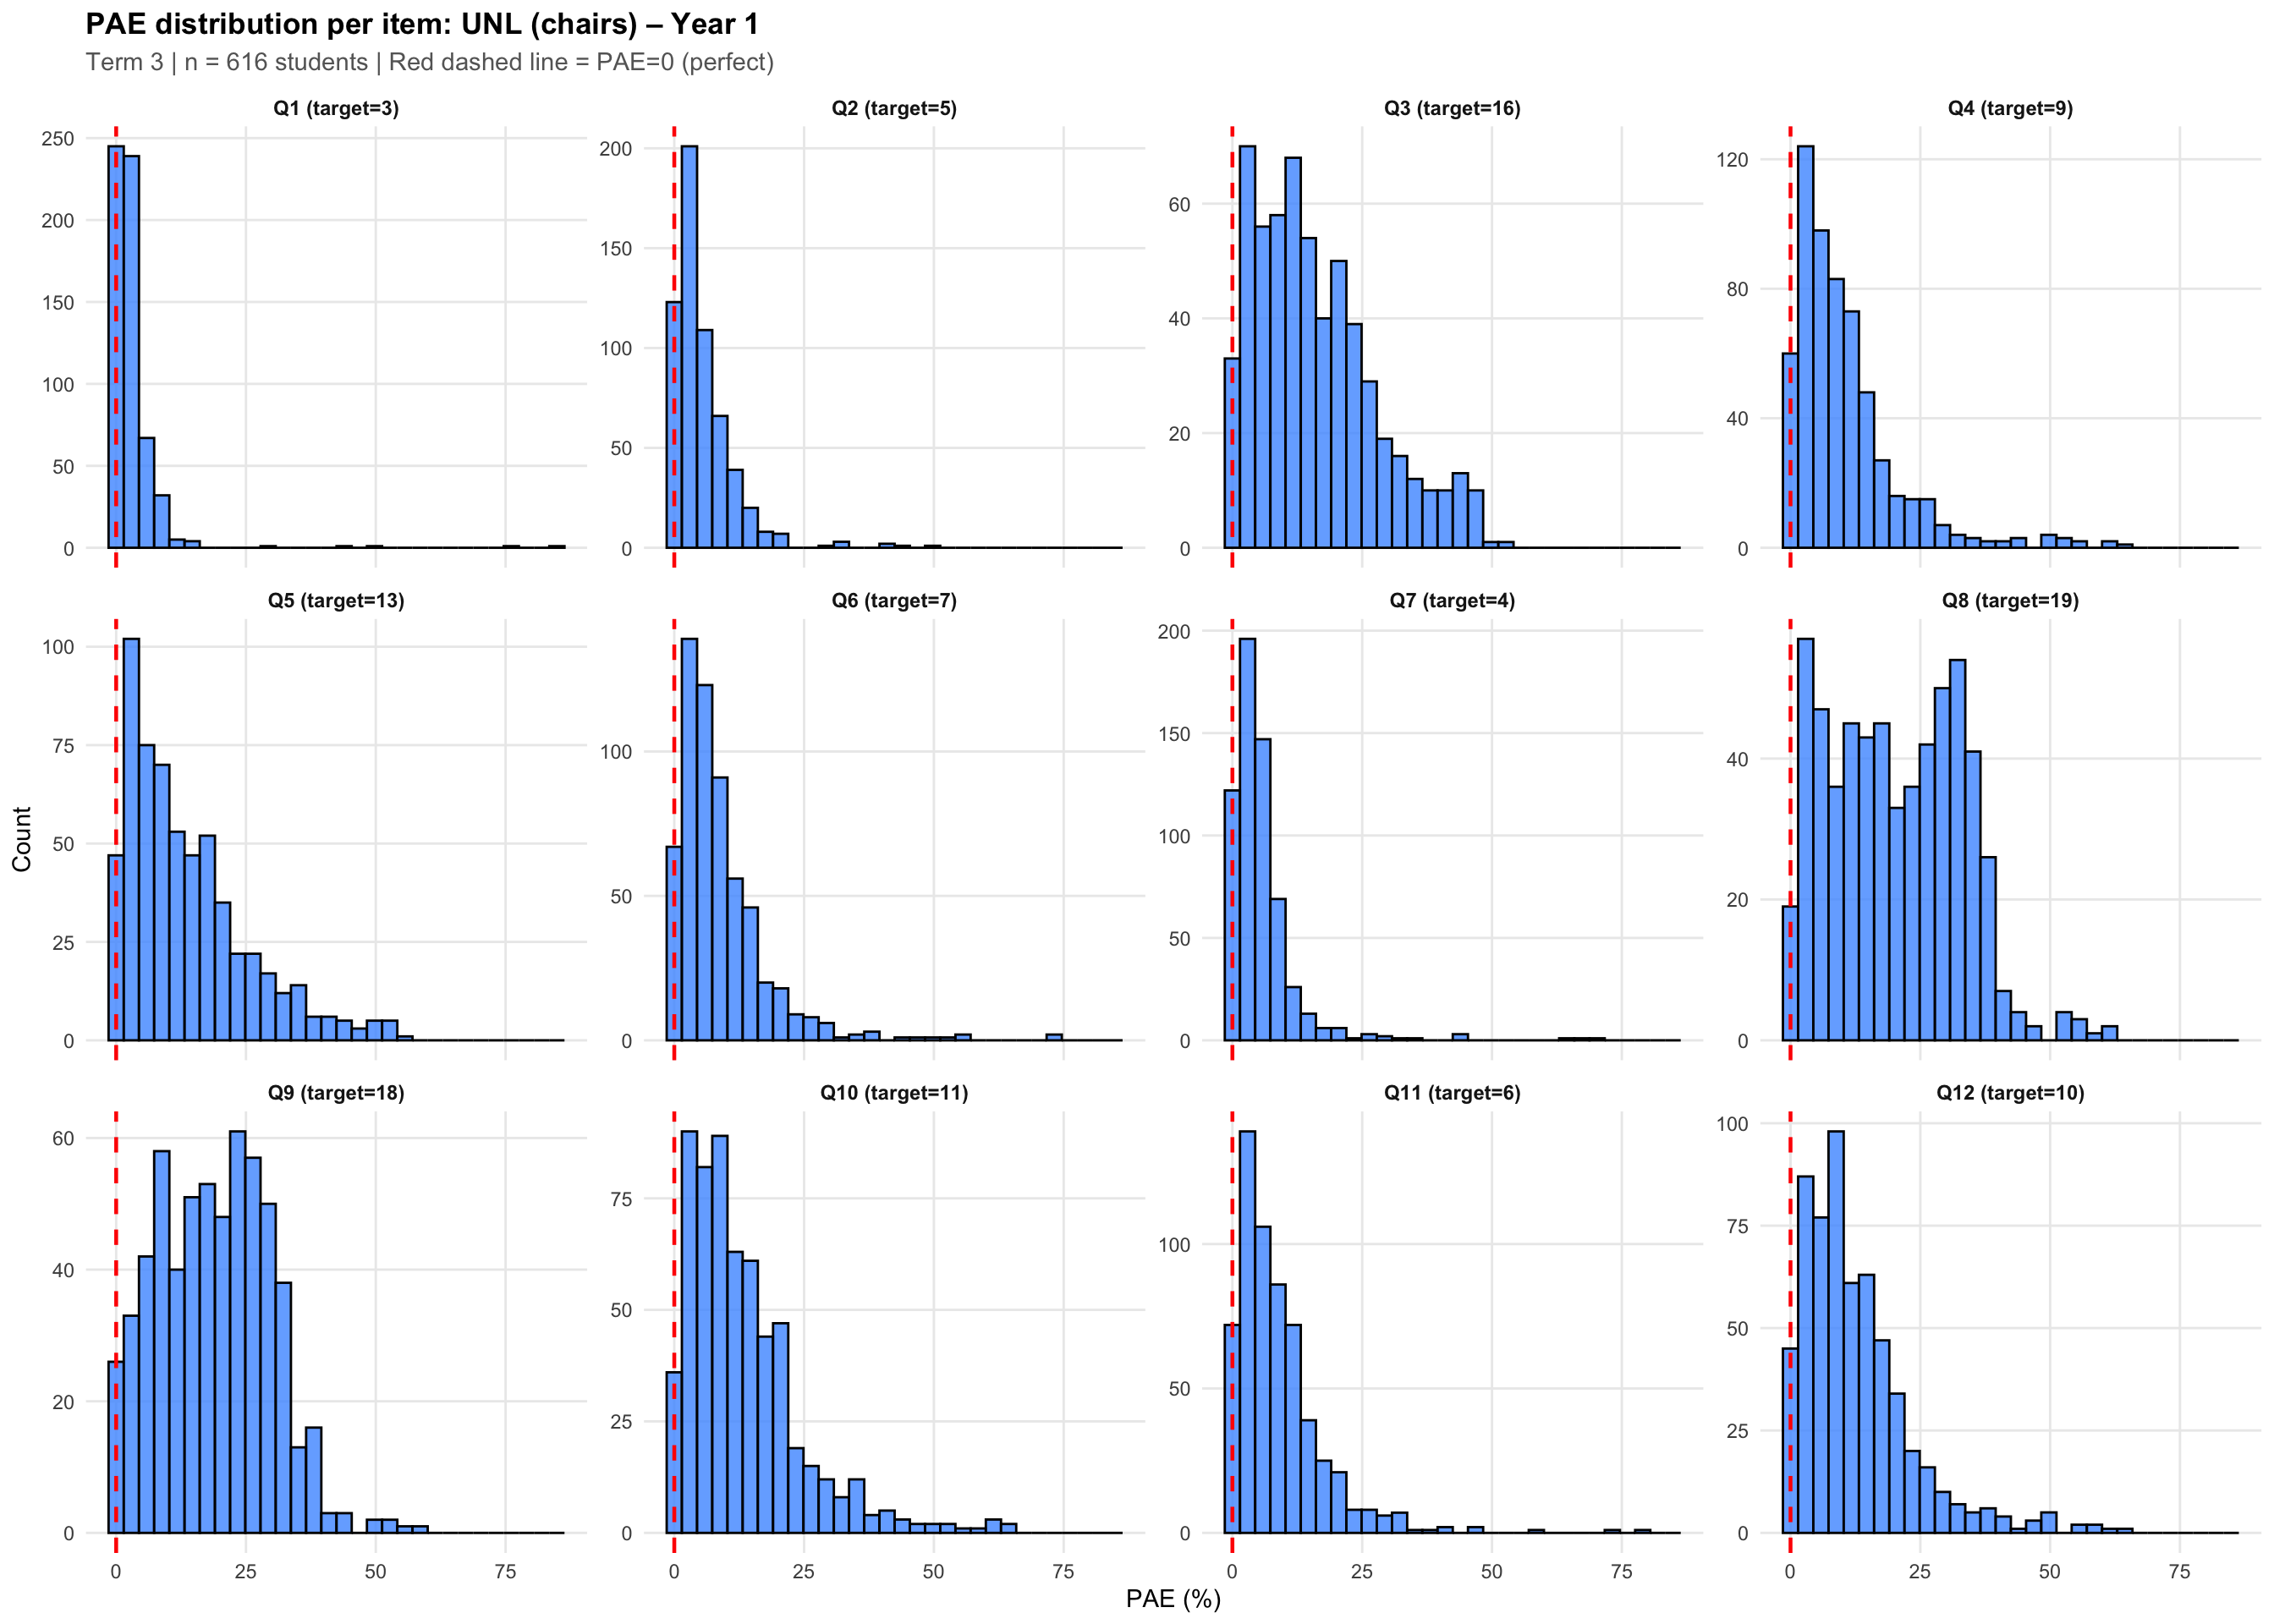
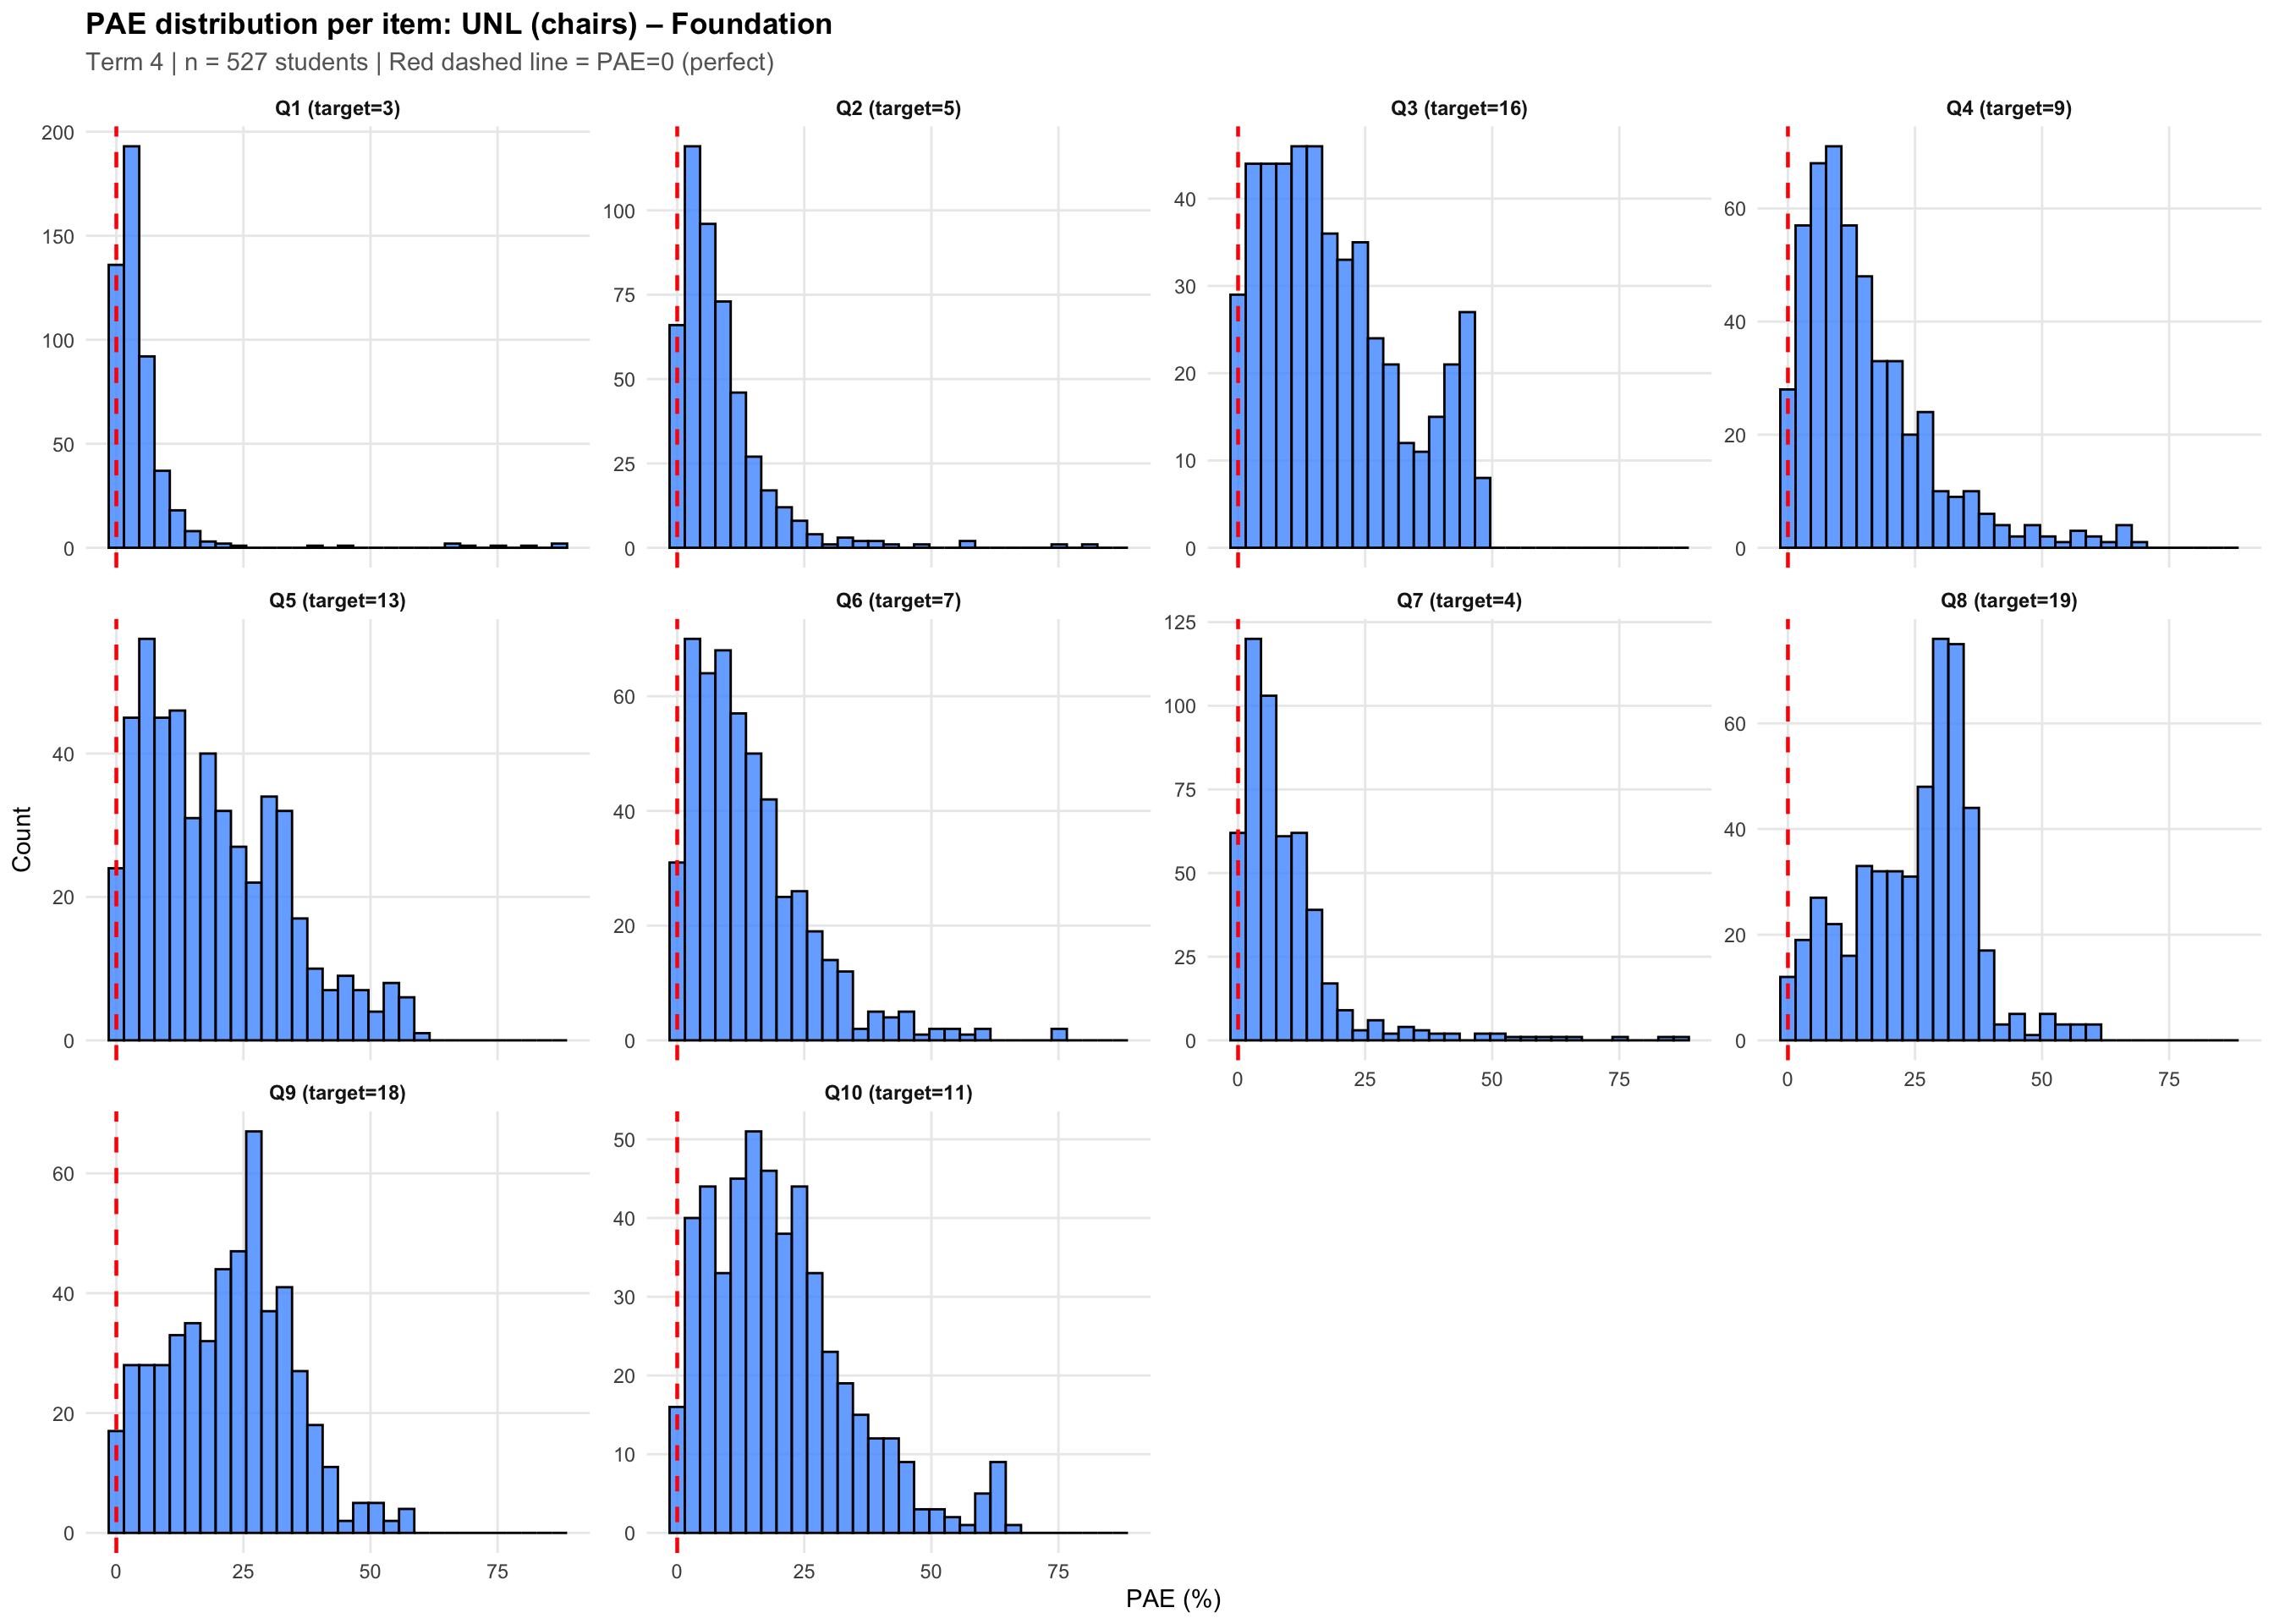
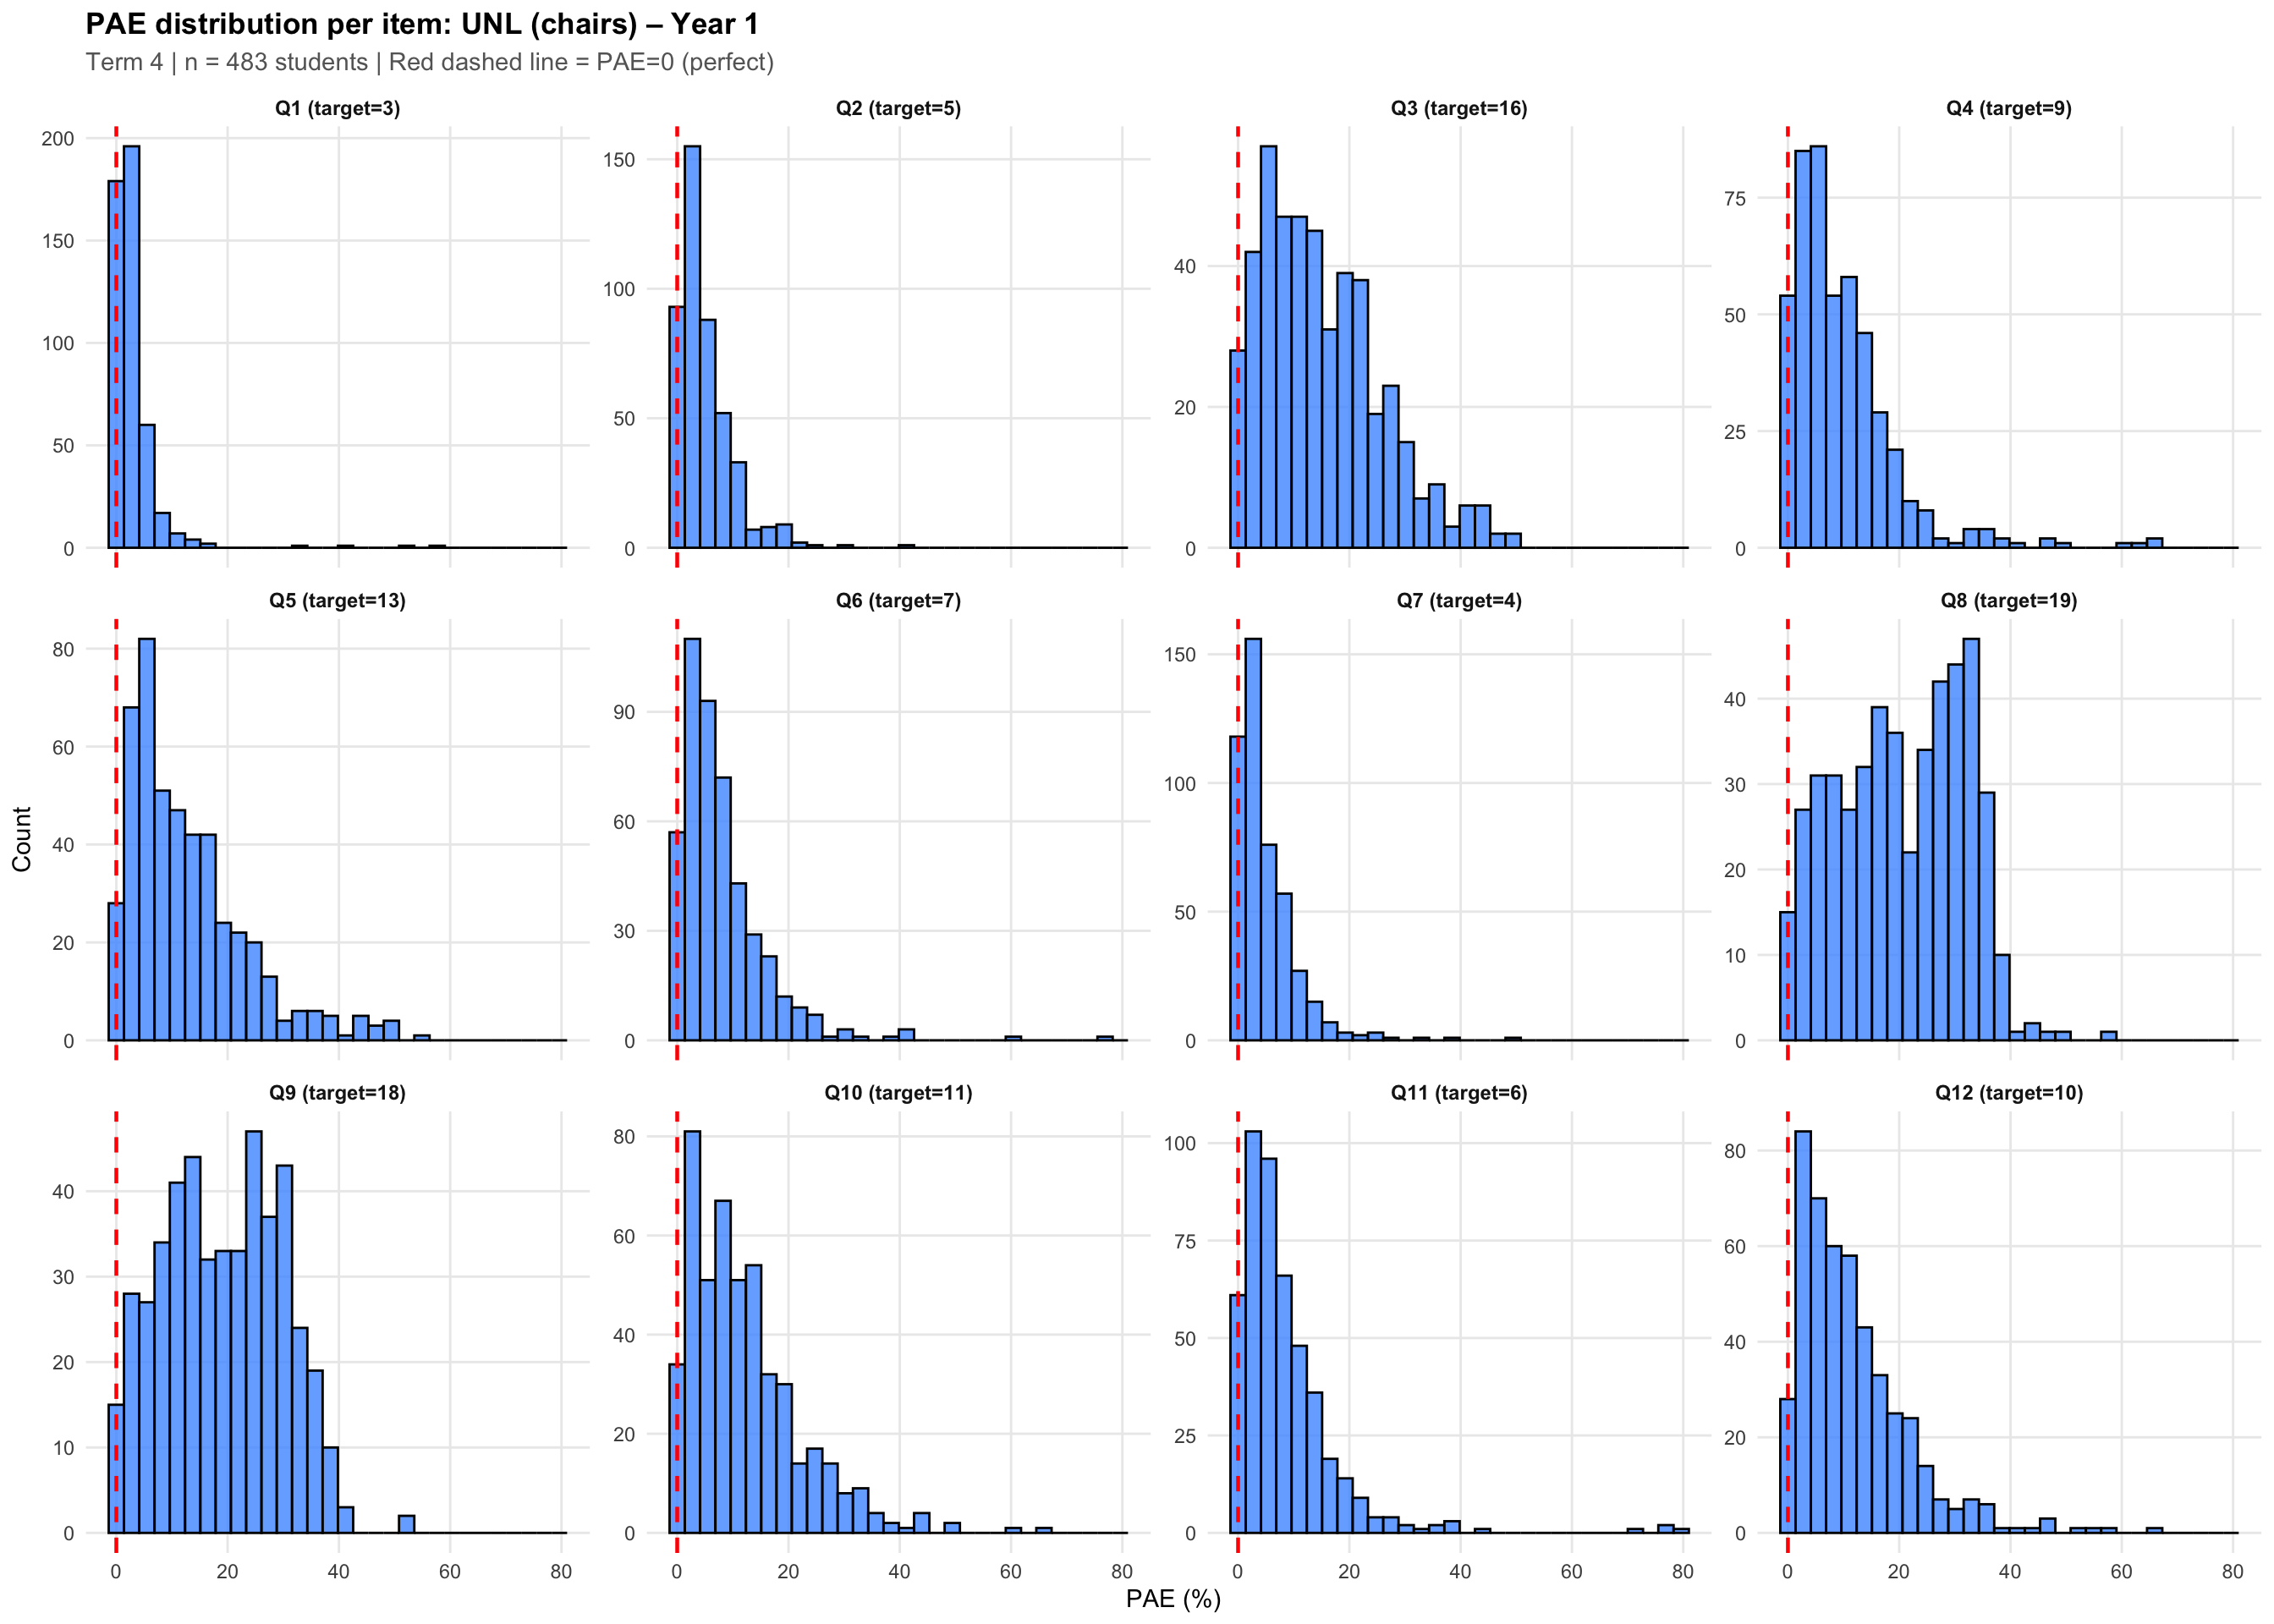
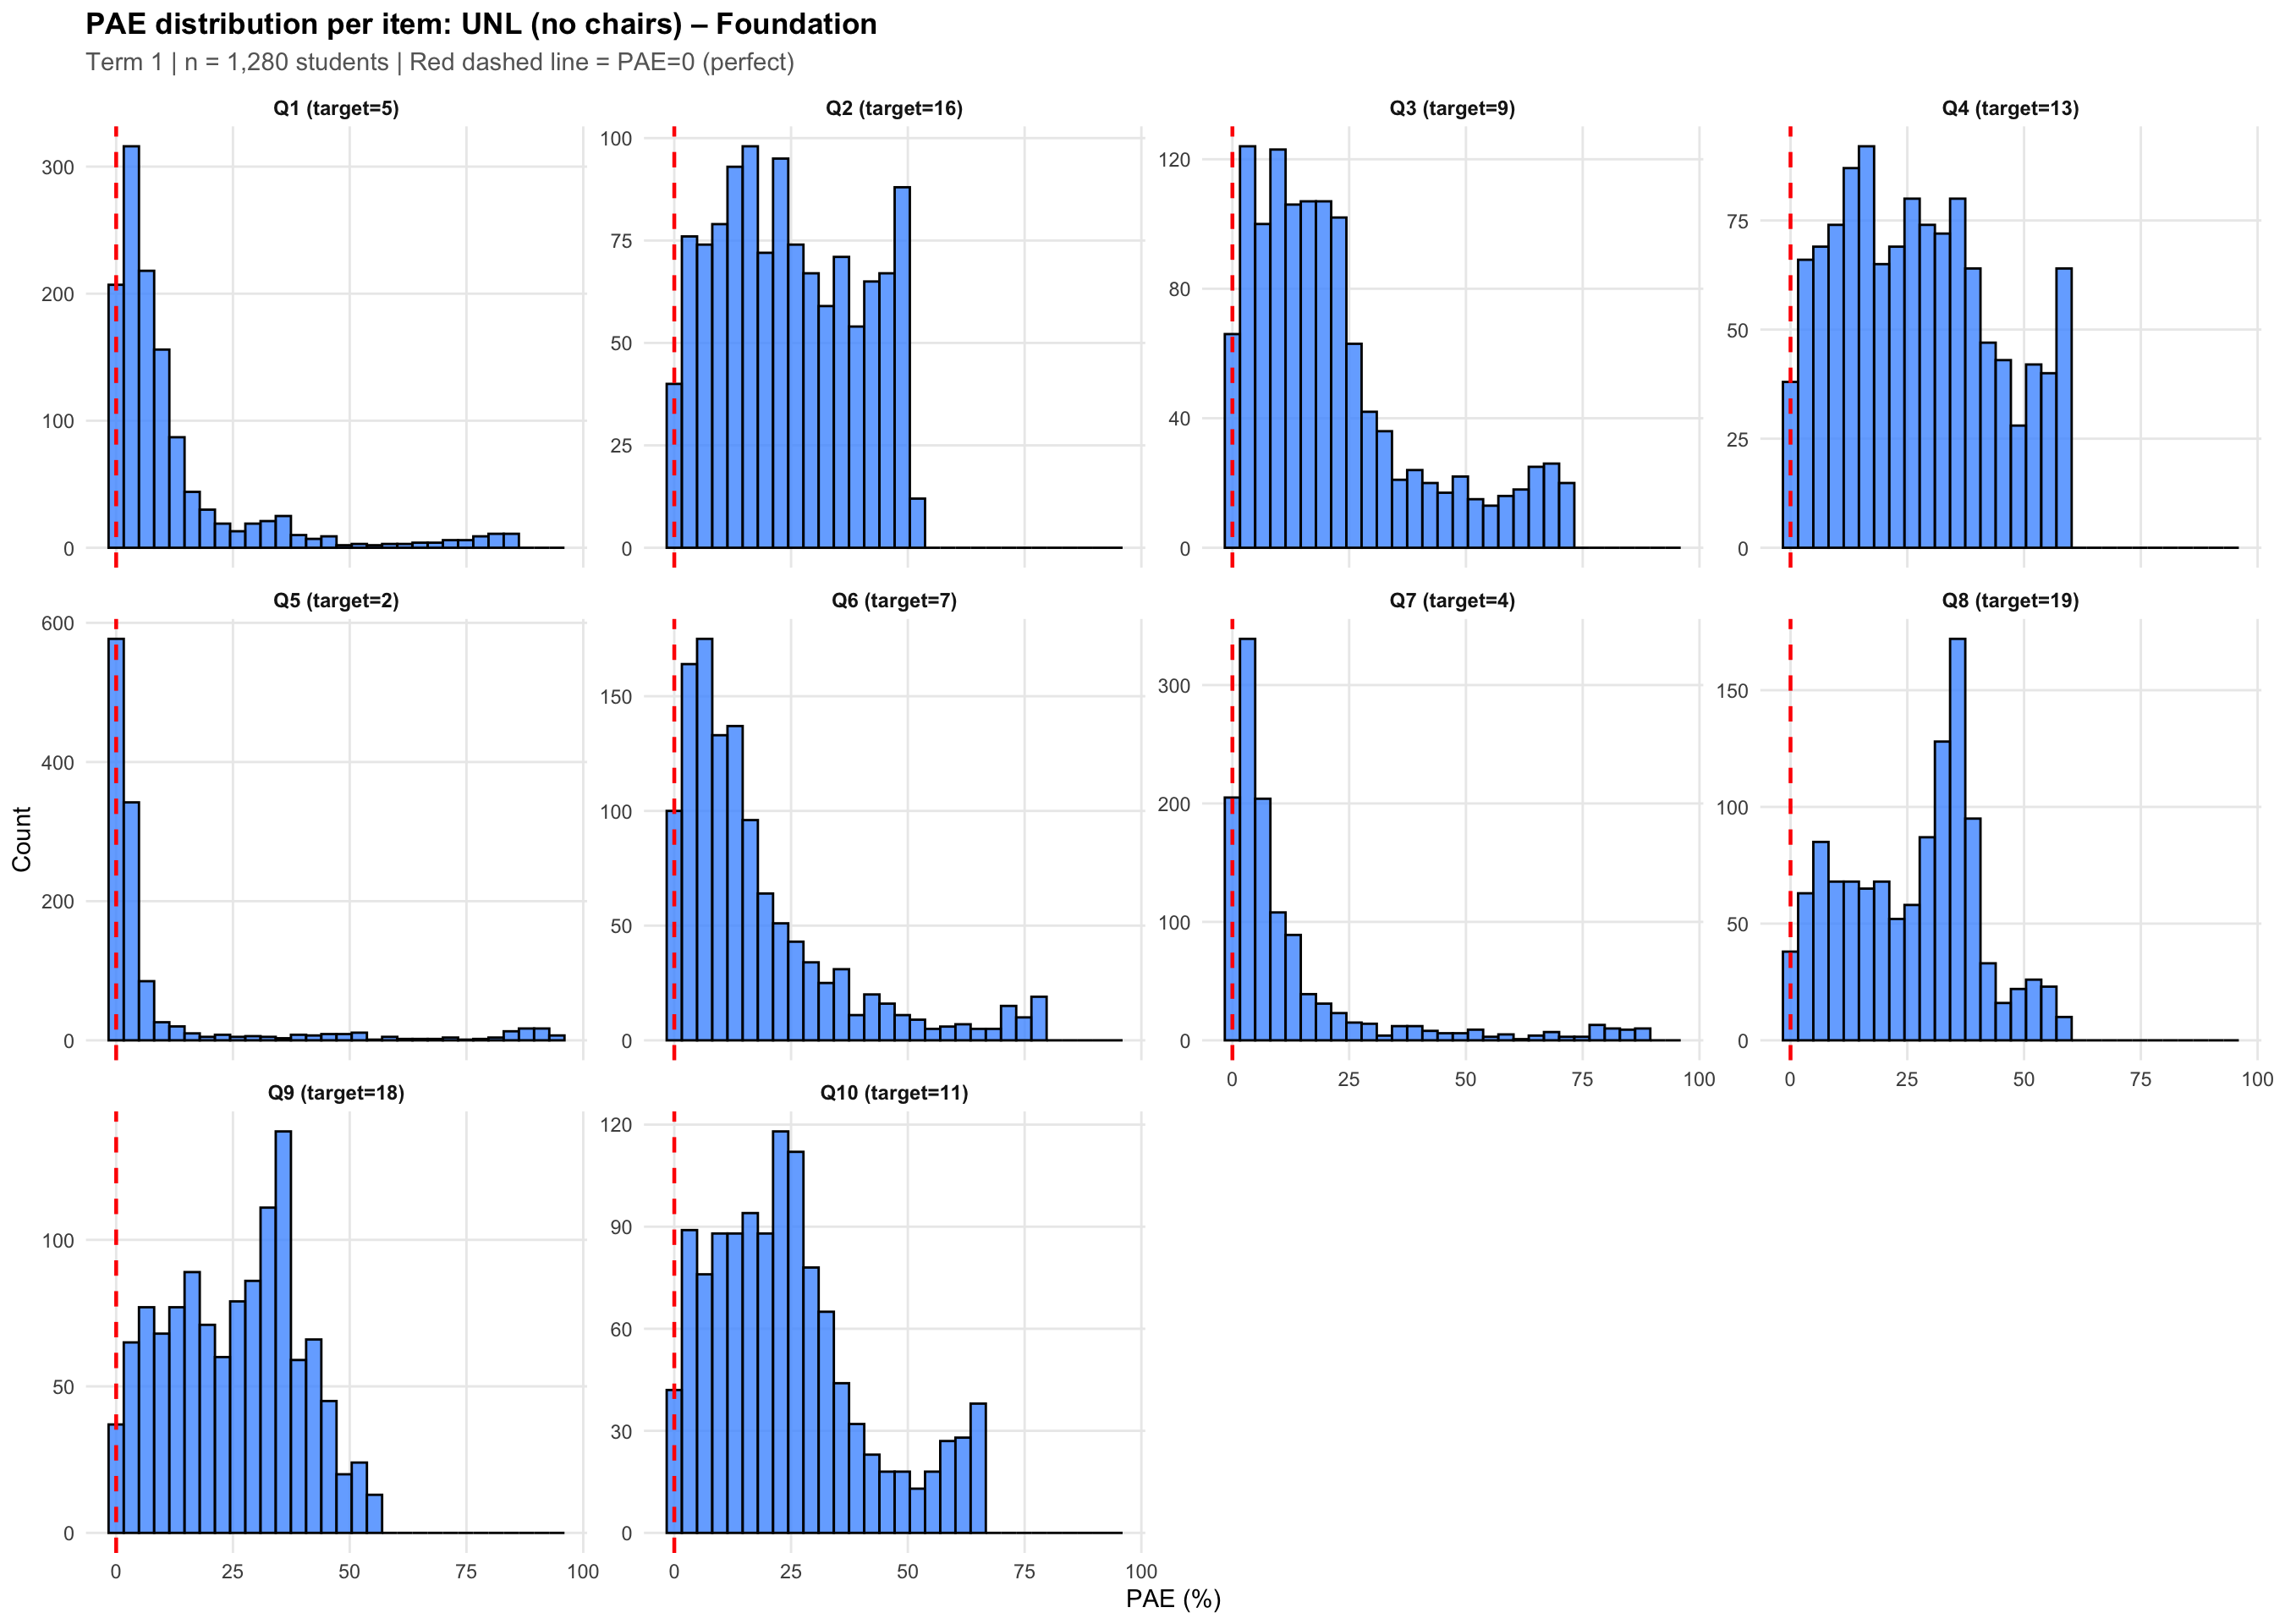
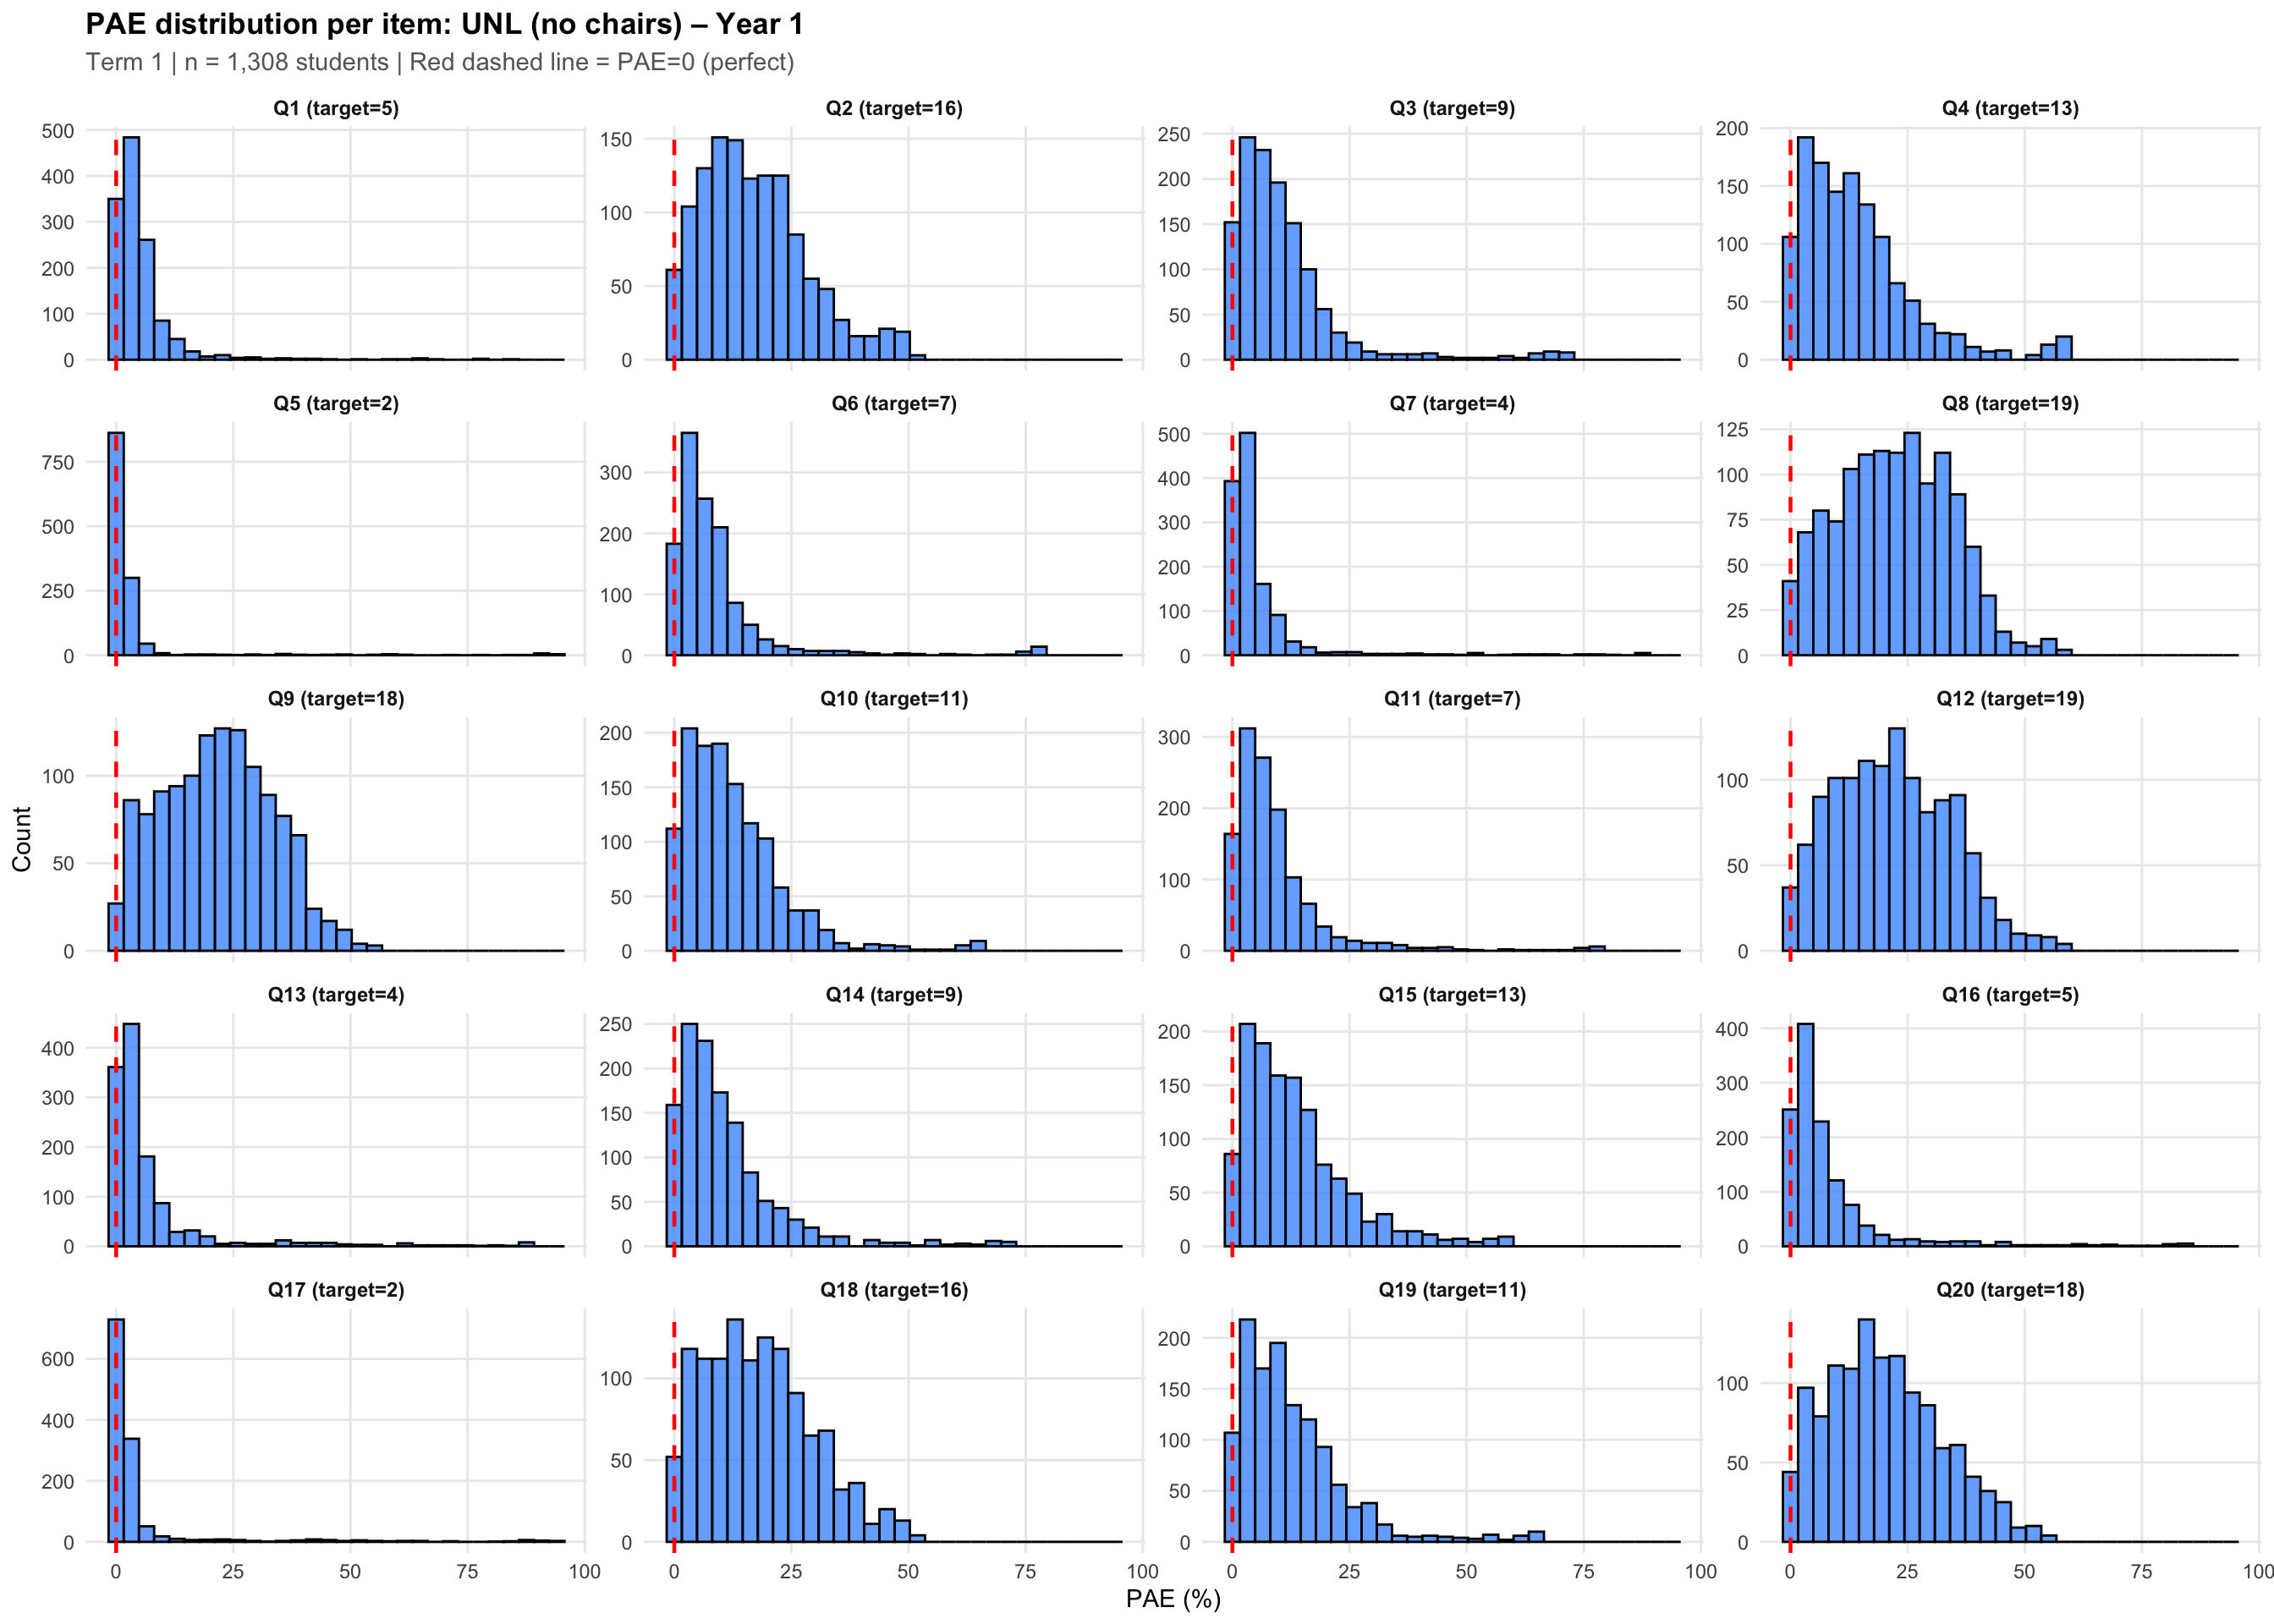
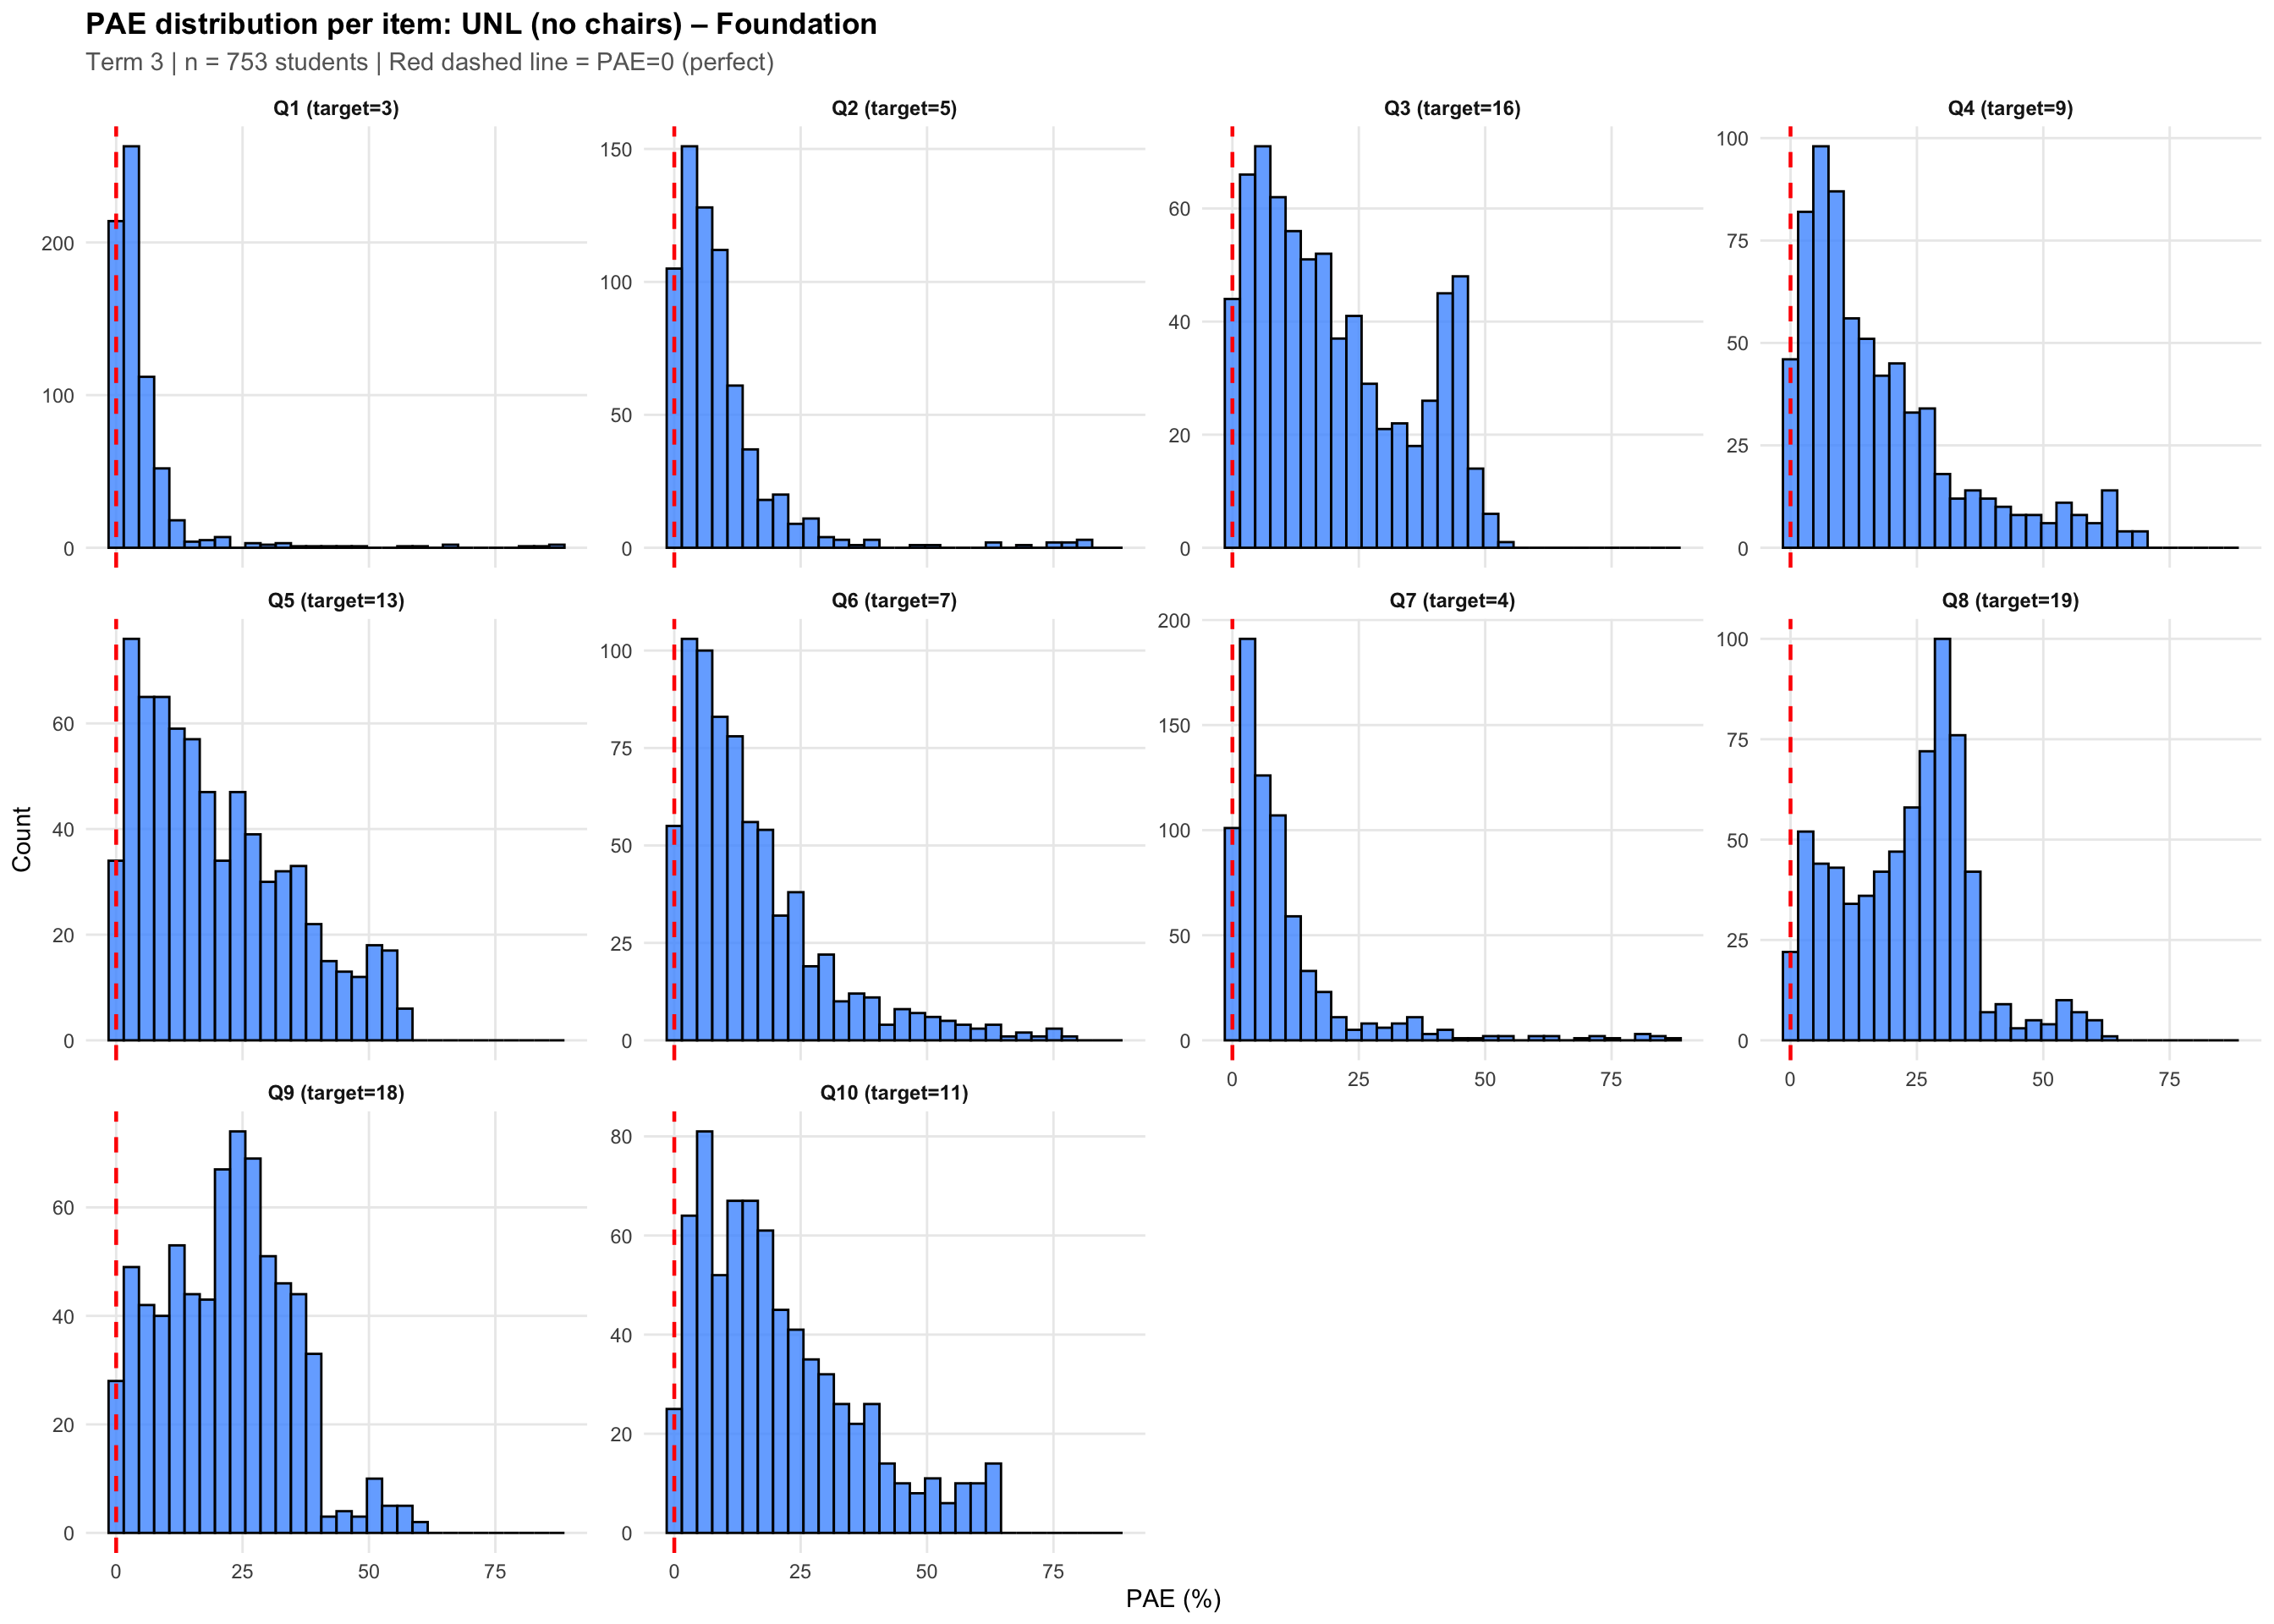
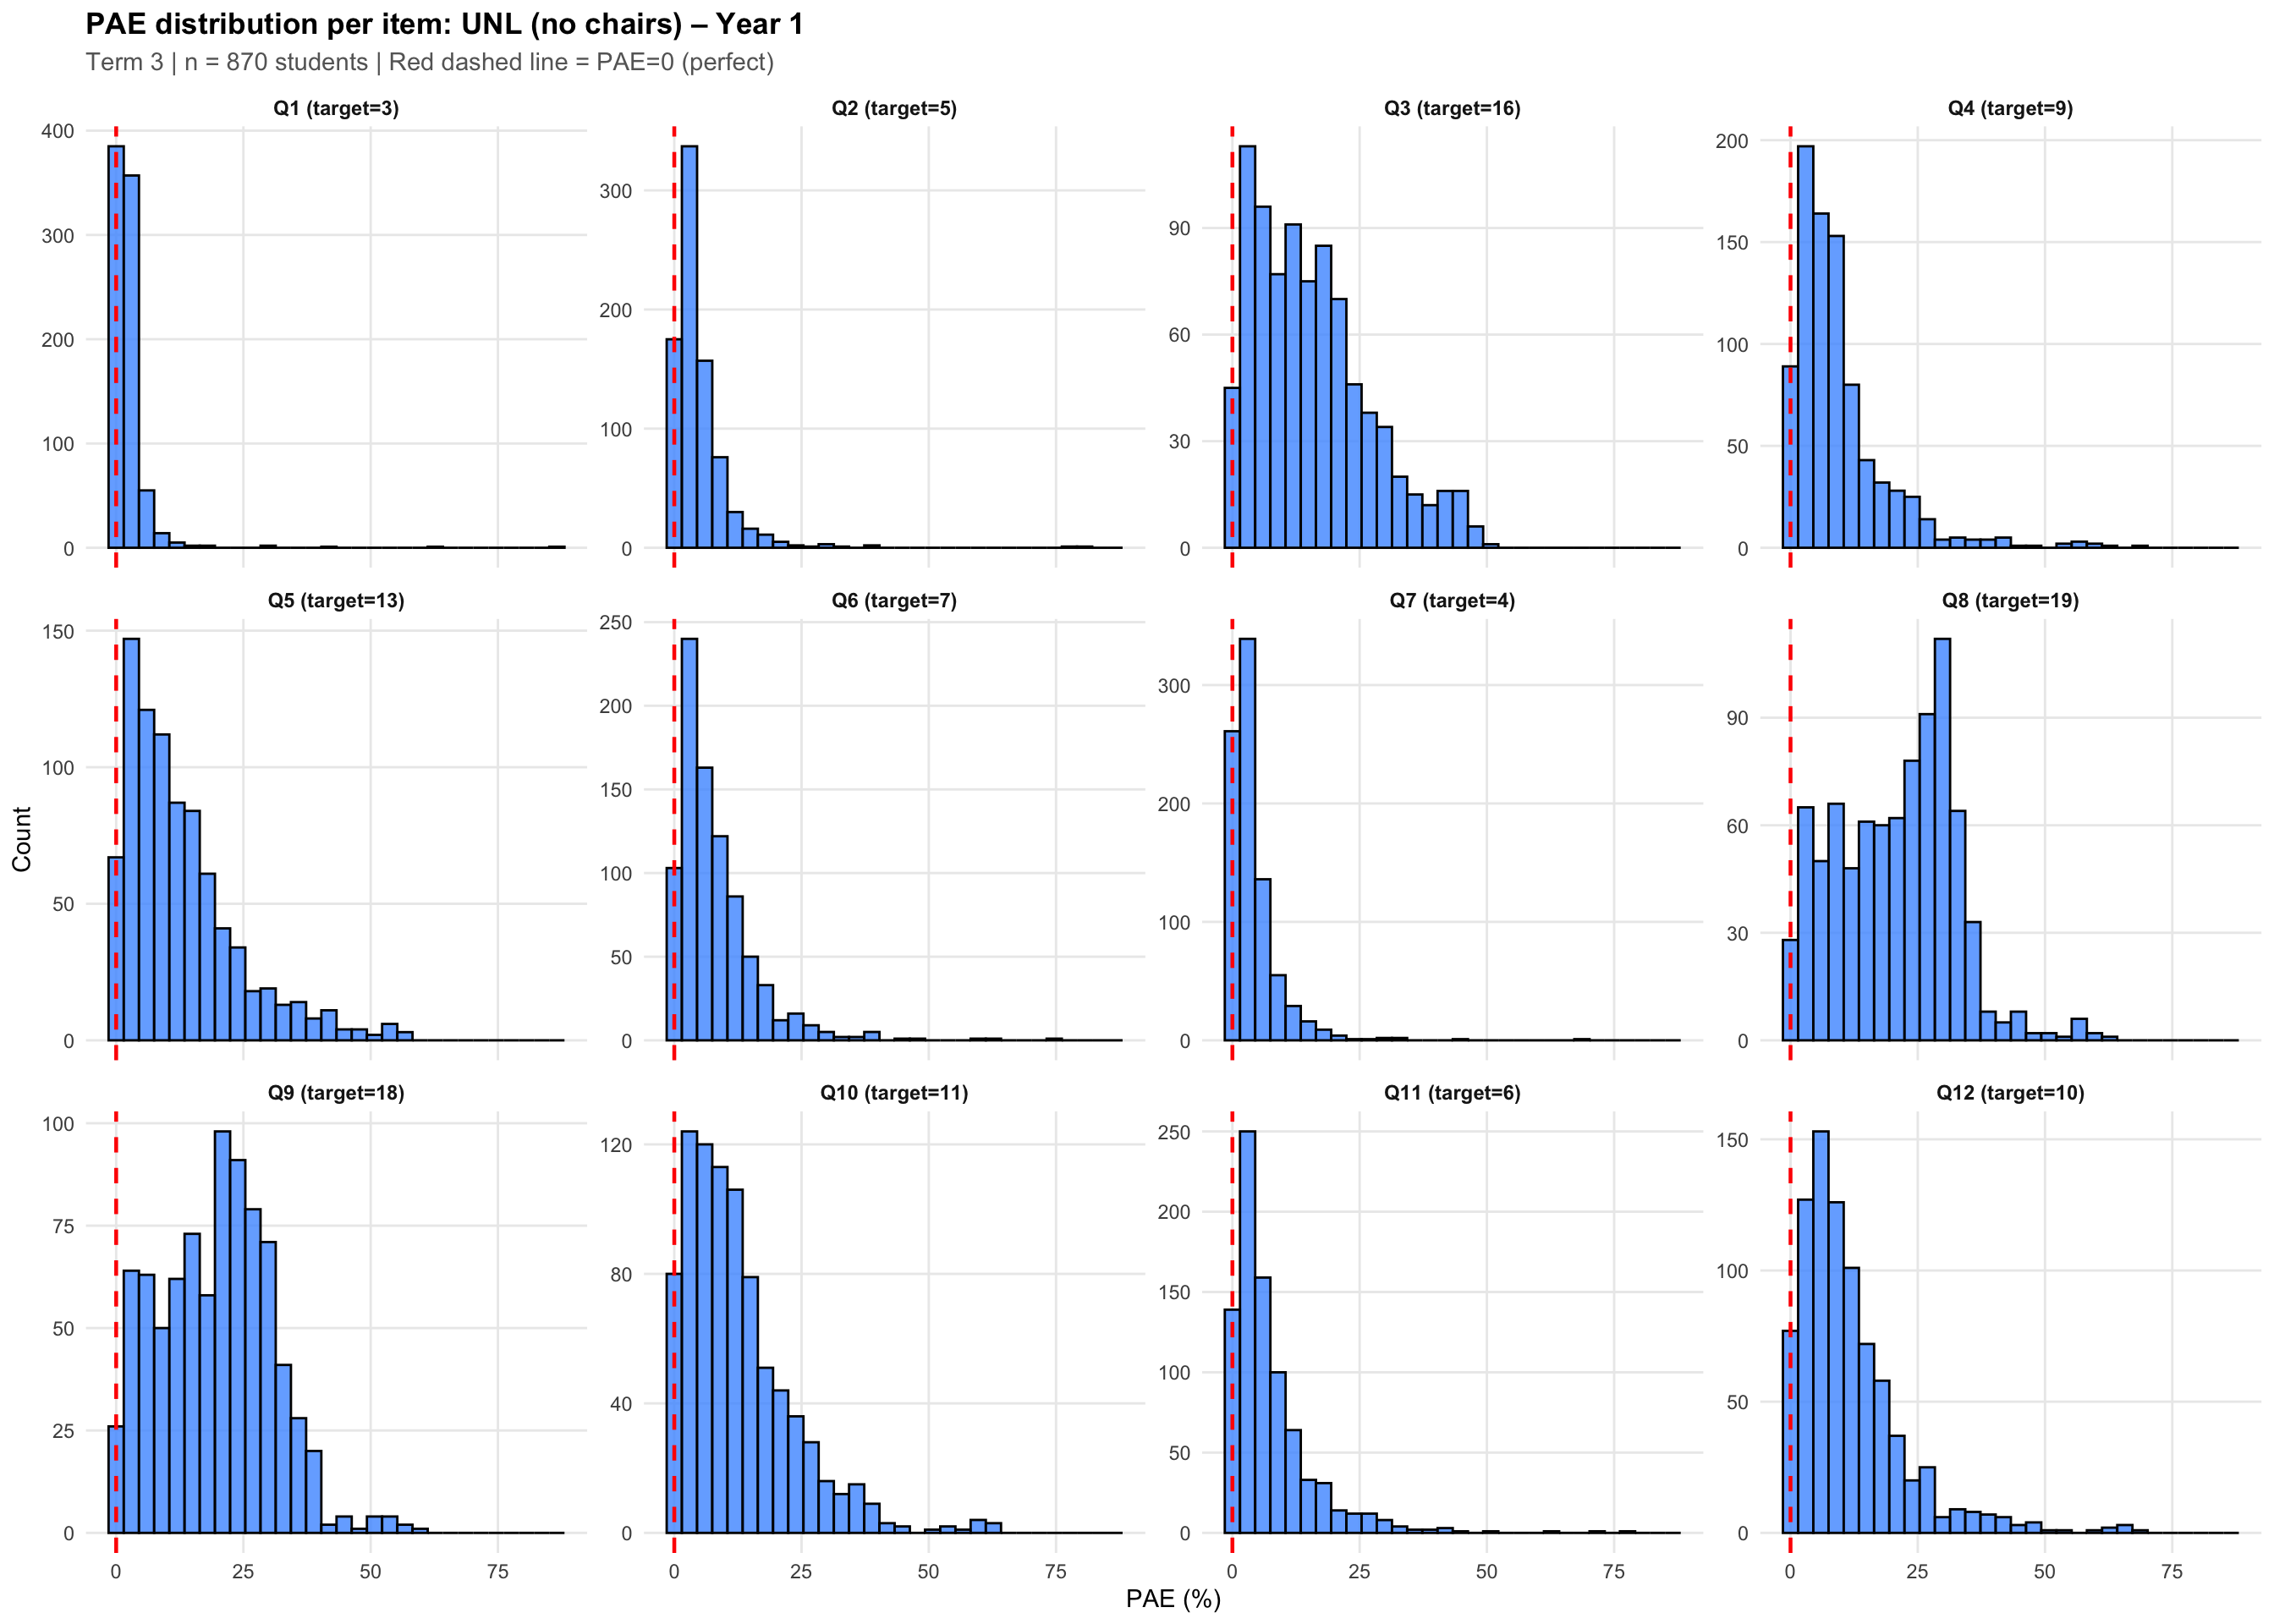
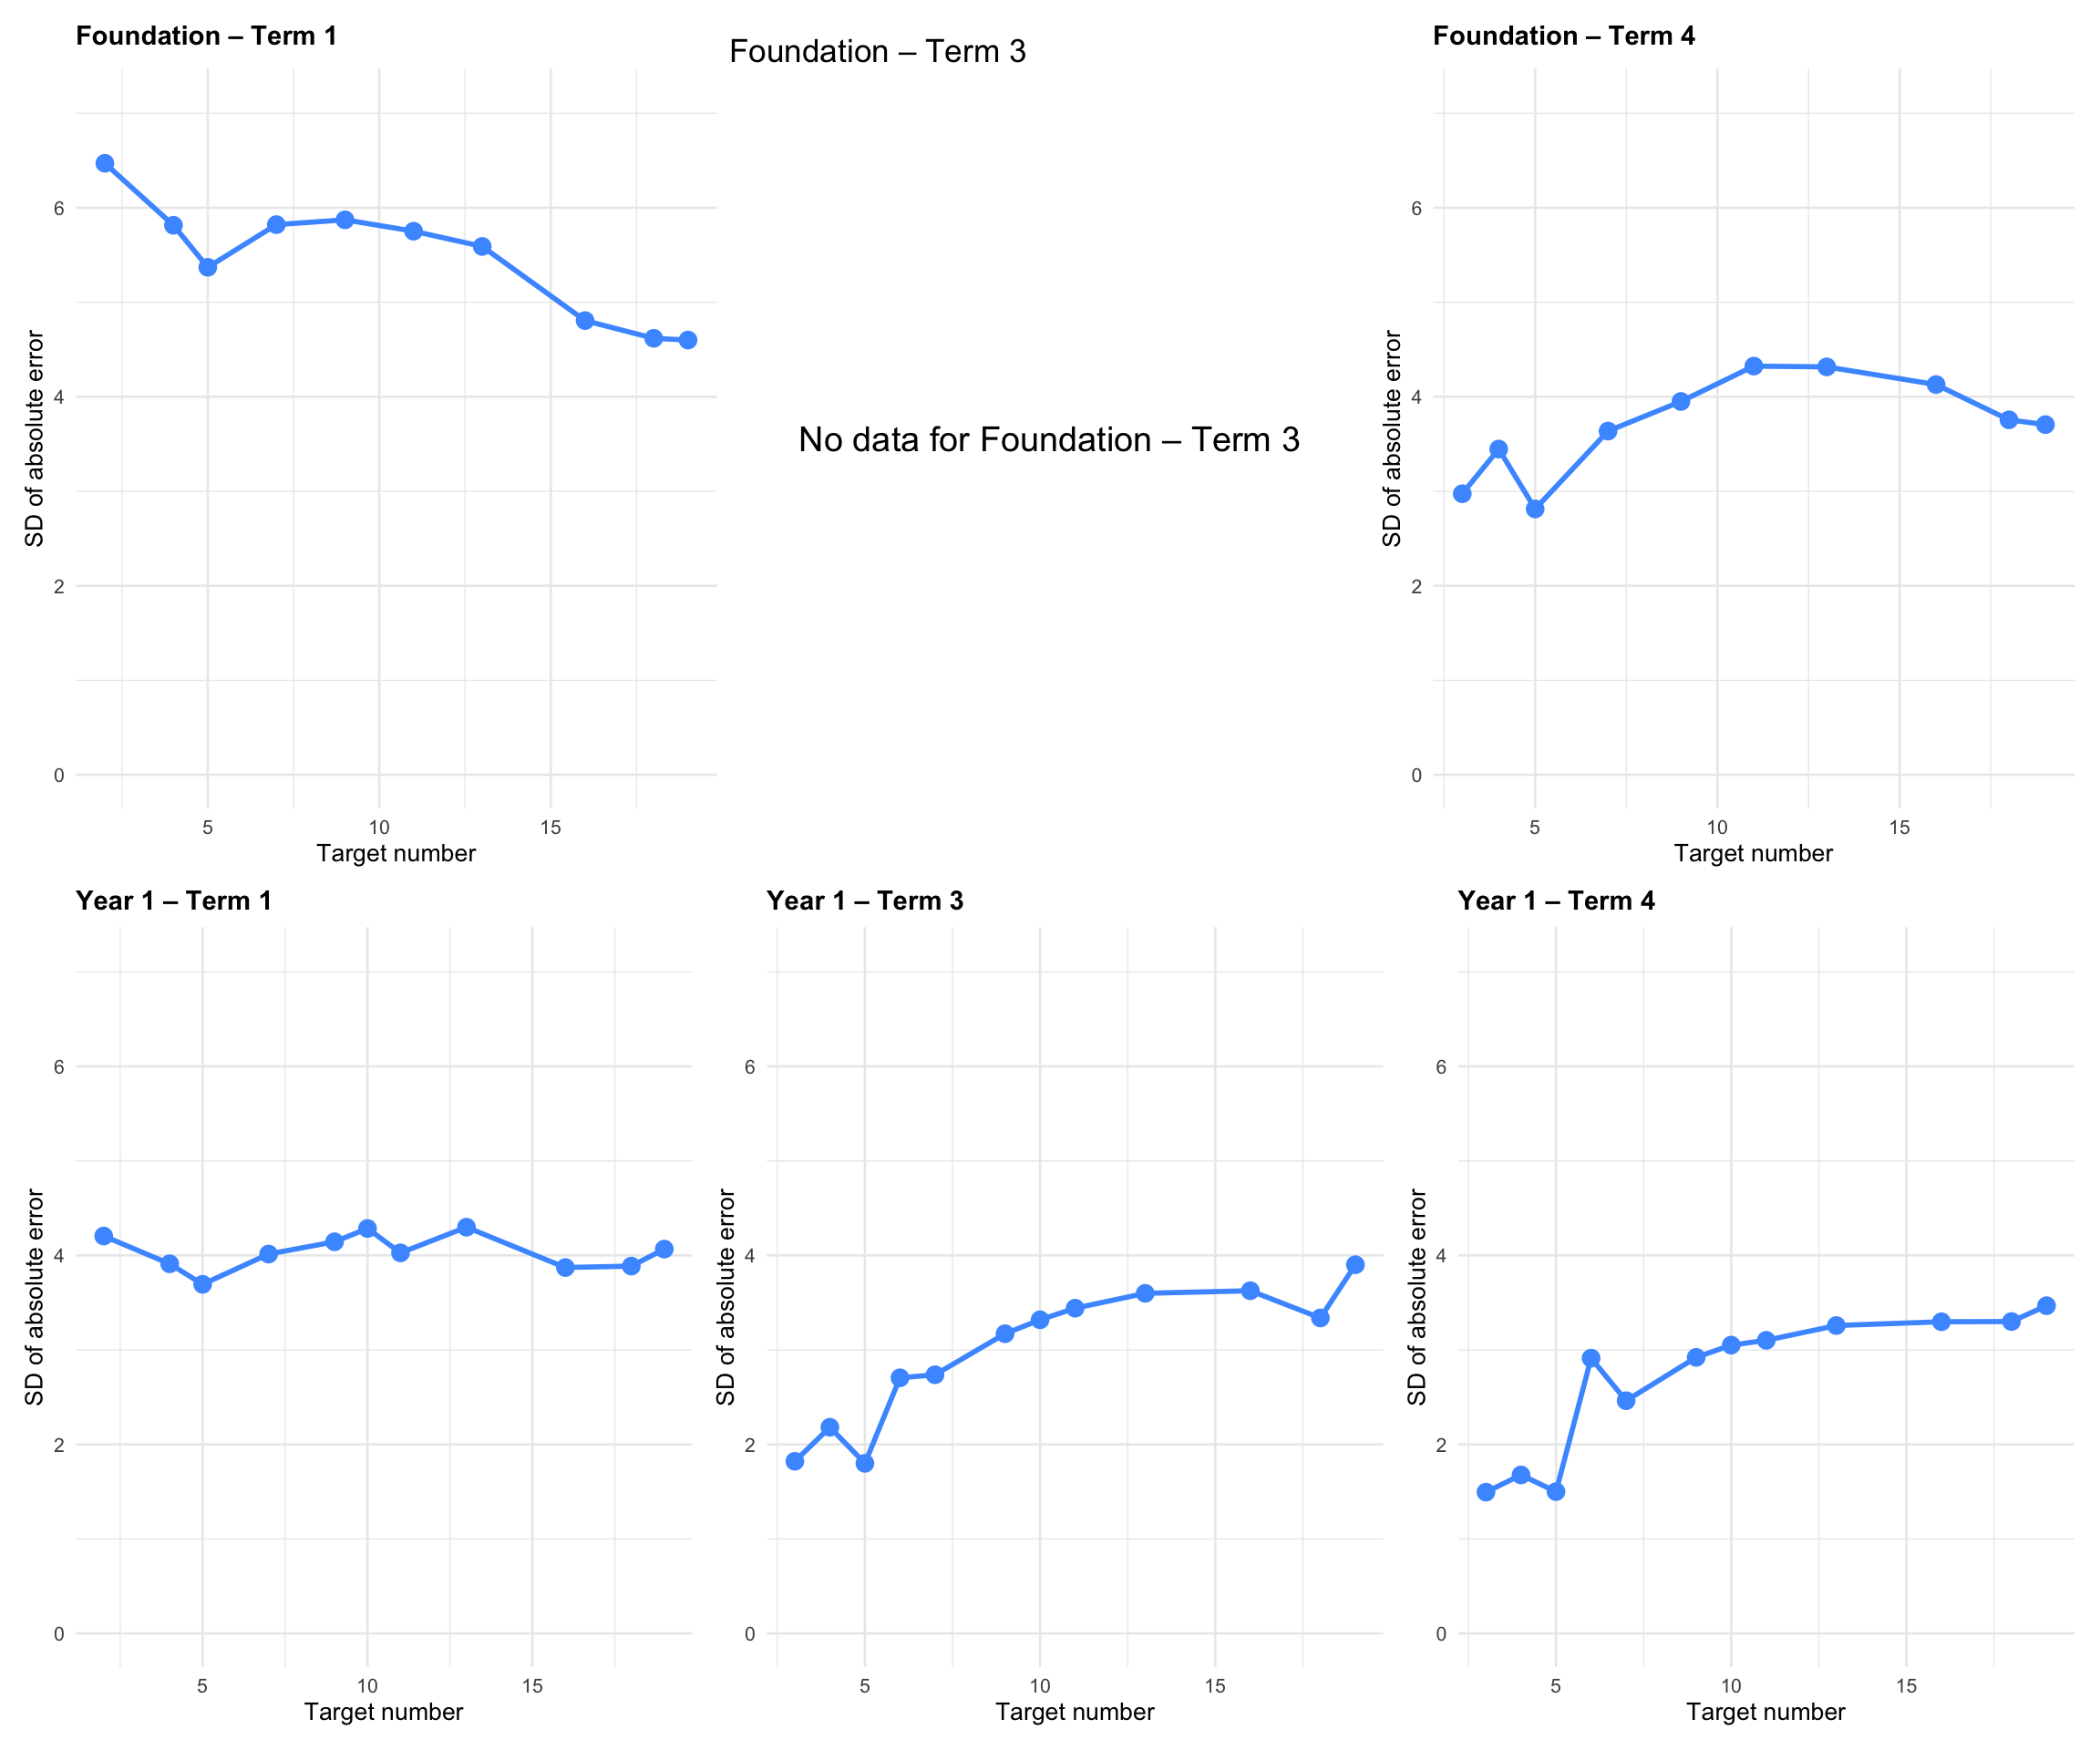
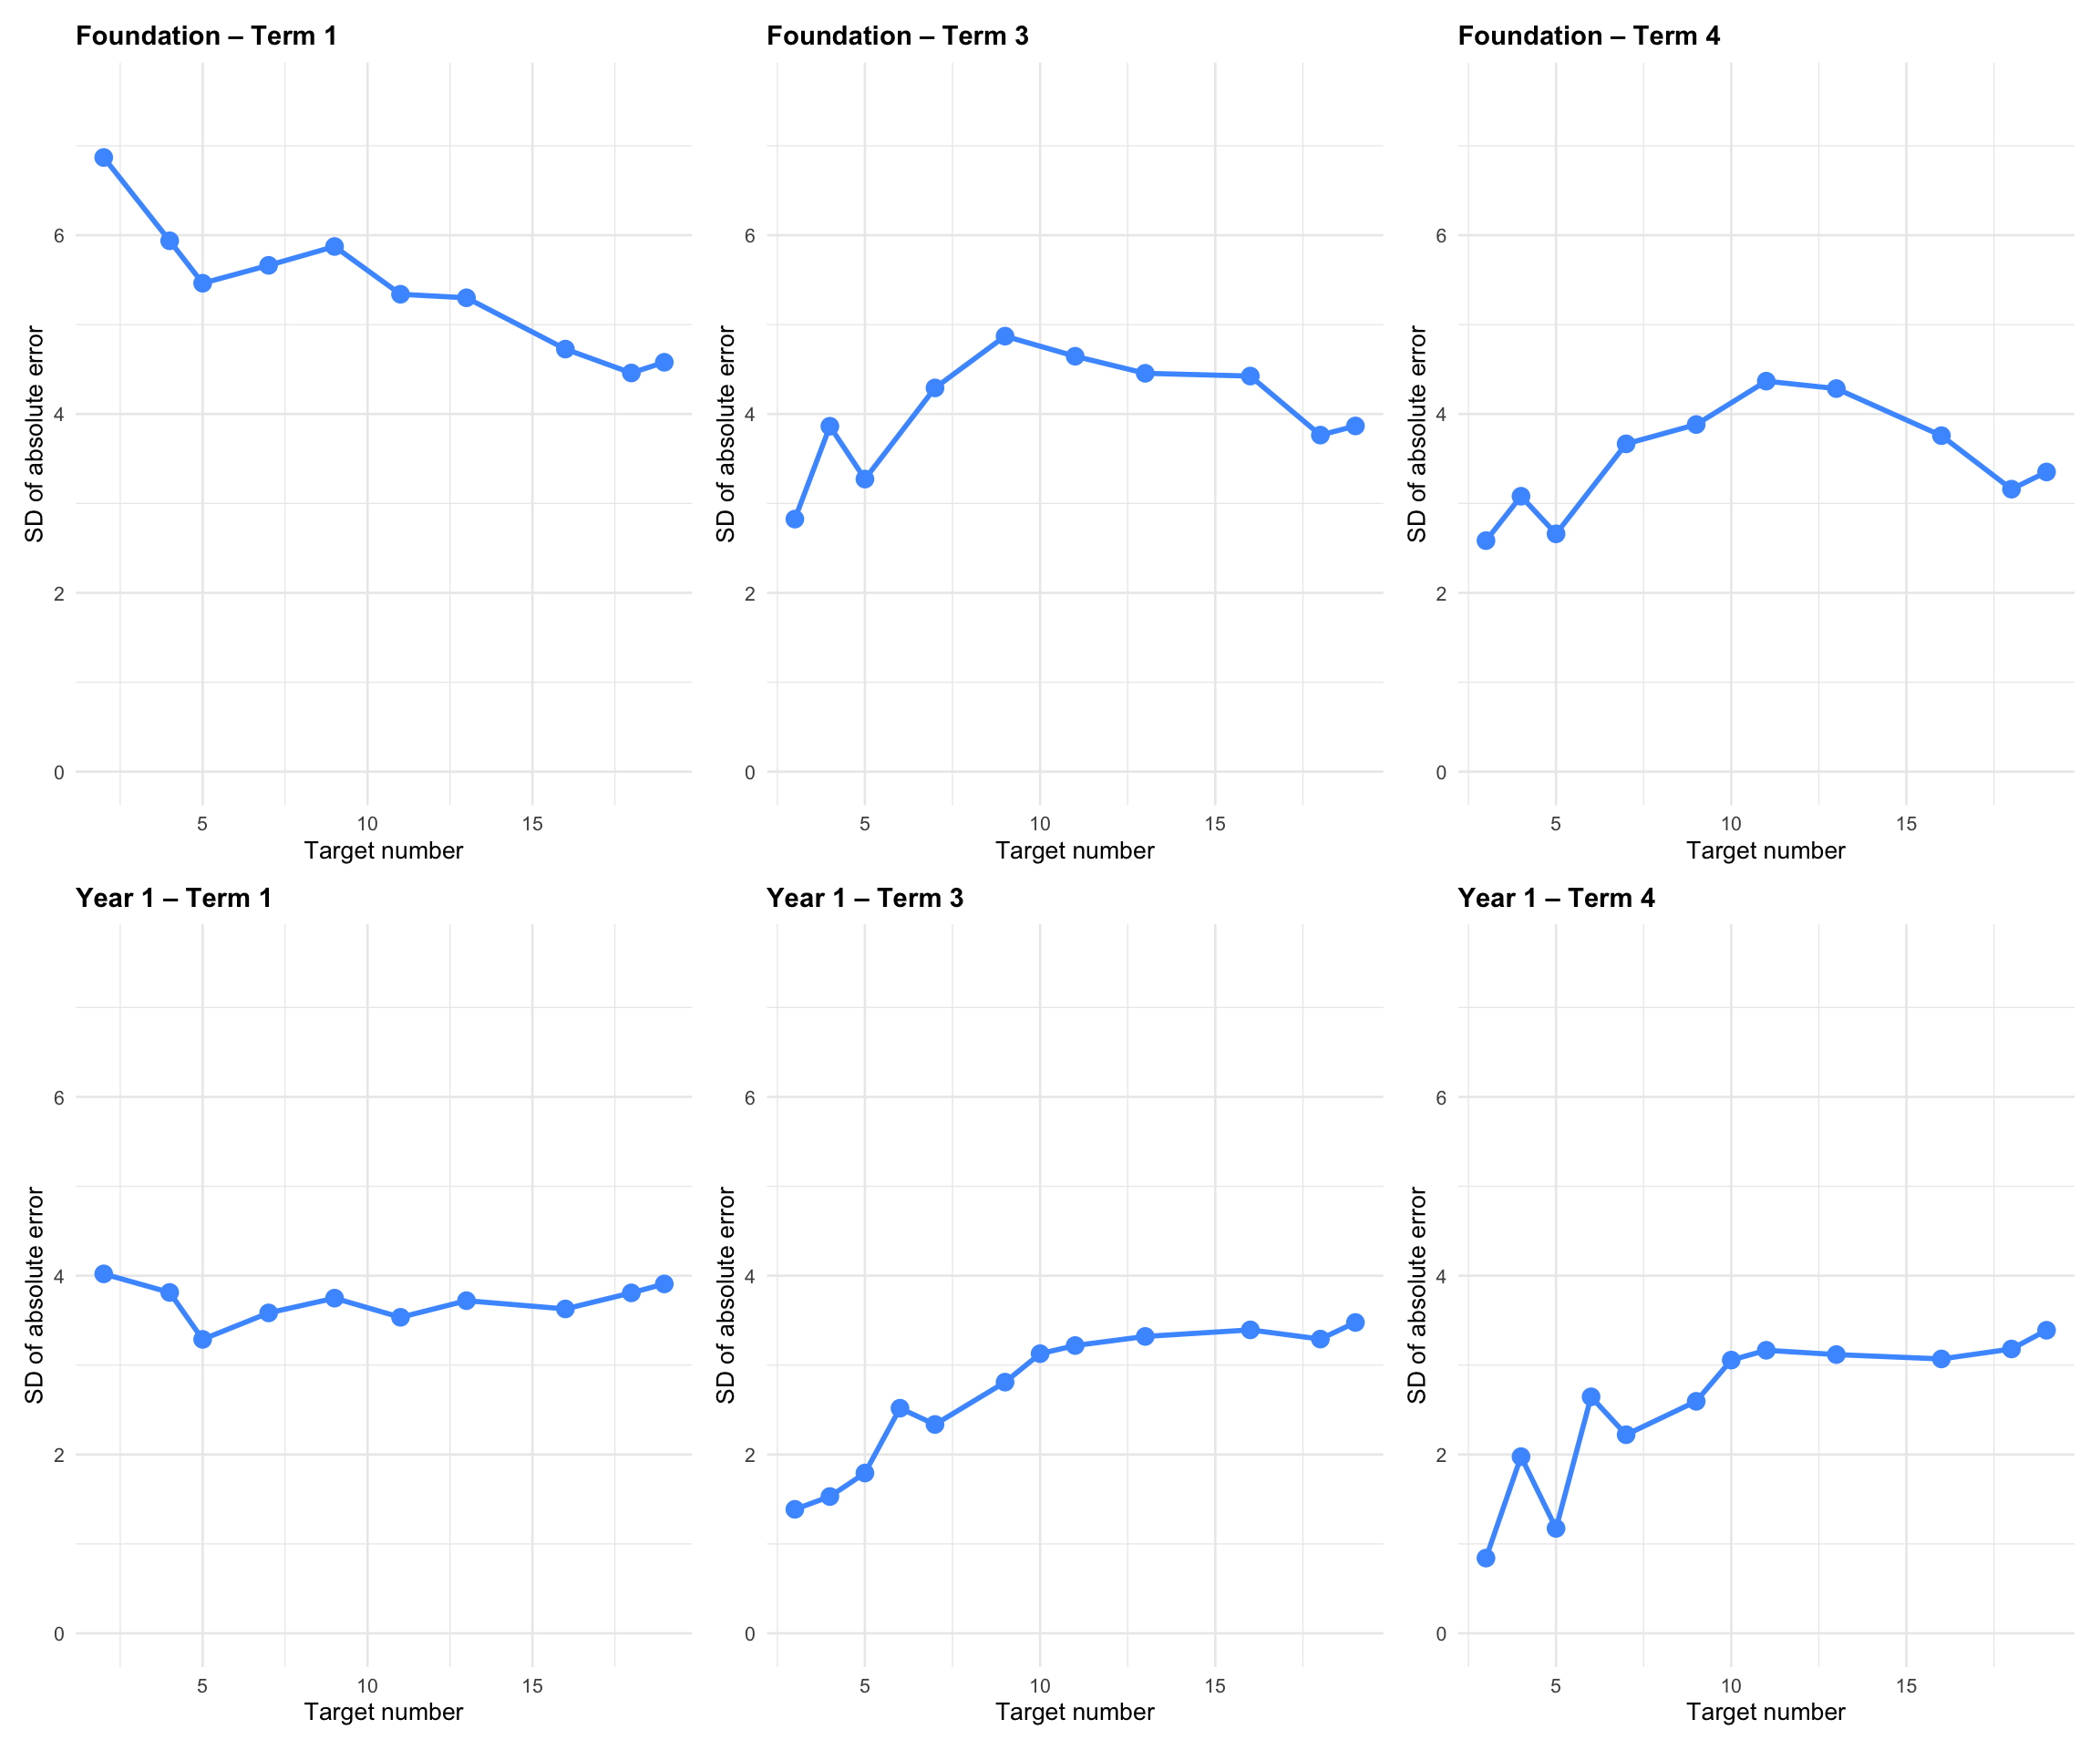
Scoring uses Percentage Absolute Error (PAE) = 100 × |clicked − target| / width, where width is the endpoint for BNL (20 or 100) and the maximum target value for UNL (~30–33 depending on form and term).
Examples
Bounded number line 0 - 20
Bounded number line 0-100
2. Overview of test results
| 1 |
Foundation |
BNL 0-20 |
2486 |
10 |
14.24 |
13.00 |
| 1 |
Foundation |
UNL 0-20 (chairs) |
1178 |
10 |
18.70 |
8.75 |
| 1 |
Foundation |
UNL 0-20 (no chairs) |
1280 |
10 |
18.52 |
7.78 |
| 1 |
Year 1 |
BNL 0-100 |
2415 |
20 |
12.35 |
8.35 |
| 1 |
Year 1 |
UNL 0-20 (chairs) |
1096 |
20 |
10.75 |
5.29 |
| 1 |
Year 1 |
UNL 0-20 (no chairs) |
1308 |
20 |
10.99 |
4.95 |
| 3 |
Foundation |
BNL 0-20 |
1424 |
10 |
11.49 |
6.89 |
| 3 |
Foundation |
UNL 0-20 (no chairs) |
756 |
10 |
15.06 |
10.65 |
| 3 |
Year 1 |
BNL 0-100 |
1482 |
13 |
12.62 |
4.85 |
| 3 |
Year 1 |
UNL 0-20 (chairs) |
616 |
12 |
9.92 |
8.58 |
| 3 |
Year 1 |
UNL 0-20 (no chairs) |
872 |
12 |
9.45 |
7.75 |
| 4 |
Foundation |
BNL 0-20 |
1072 |
10 |
10.72 |
5.80 |
| 4 |
Foundation |
UNL 0-20 (chairs) |
527 |
10 |
14.89 |
9.70 |
| 4 |
Foundation |
UNL 0-20 (no chairs) |
569 |
10 |
12.44 |
8.30 |
| 4 |
Year 1 |
BNL 0-100 |
1059 |
13 |
11.62 |
4.46 |
| 4 |
Year 1 |
UNL 0-20 (chairs) |
483 |
12 |
10.03 |
7.64 |
| 4 |
Year 1 |
UNL 0-20 (no chairs) |
586 |
12 |
9.44 |
6.33 |
* PAE = Percentage Absolute Error (%). Lower values indicate better performance.
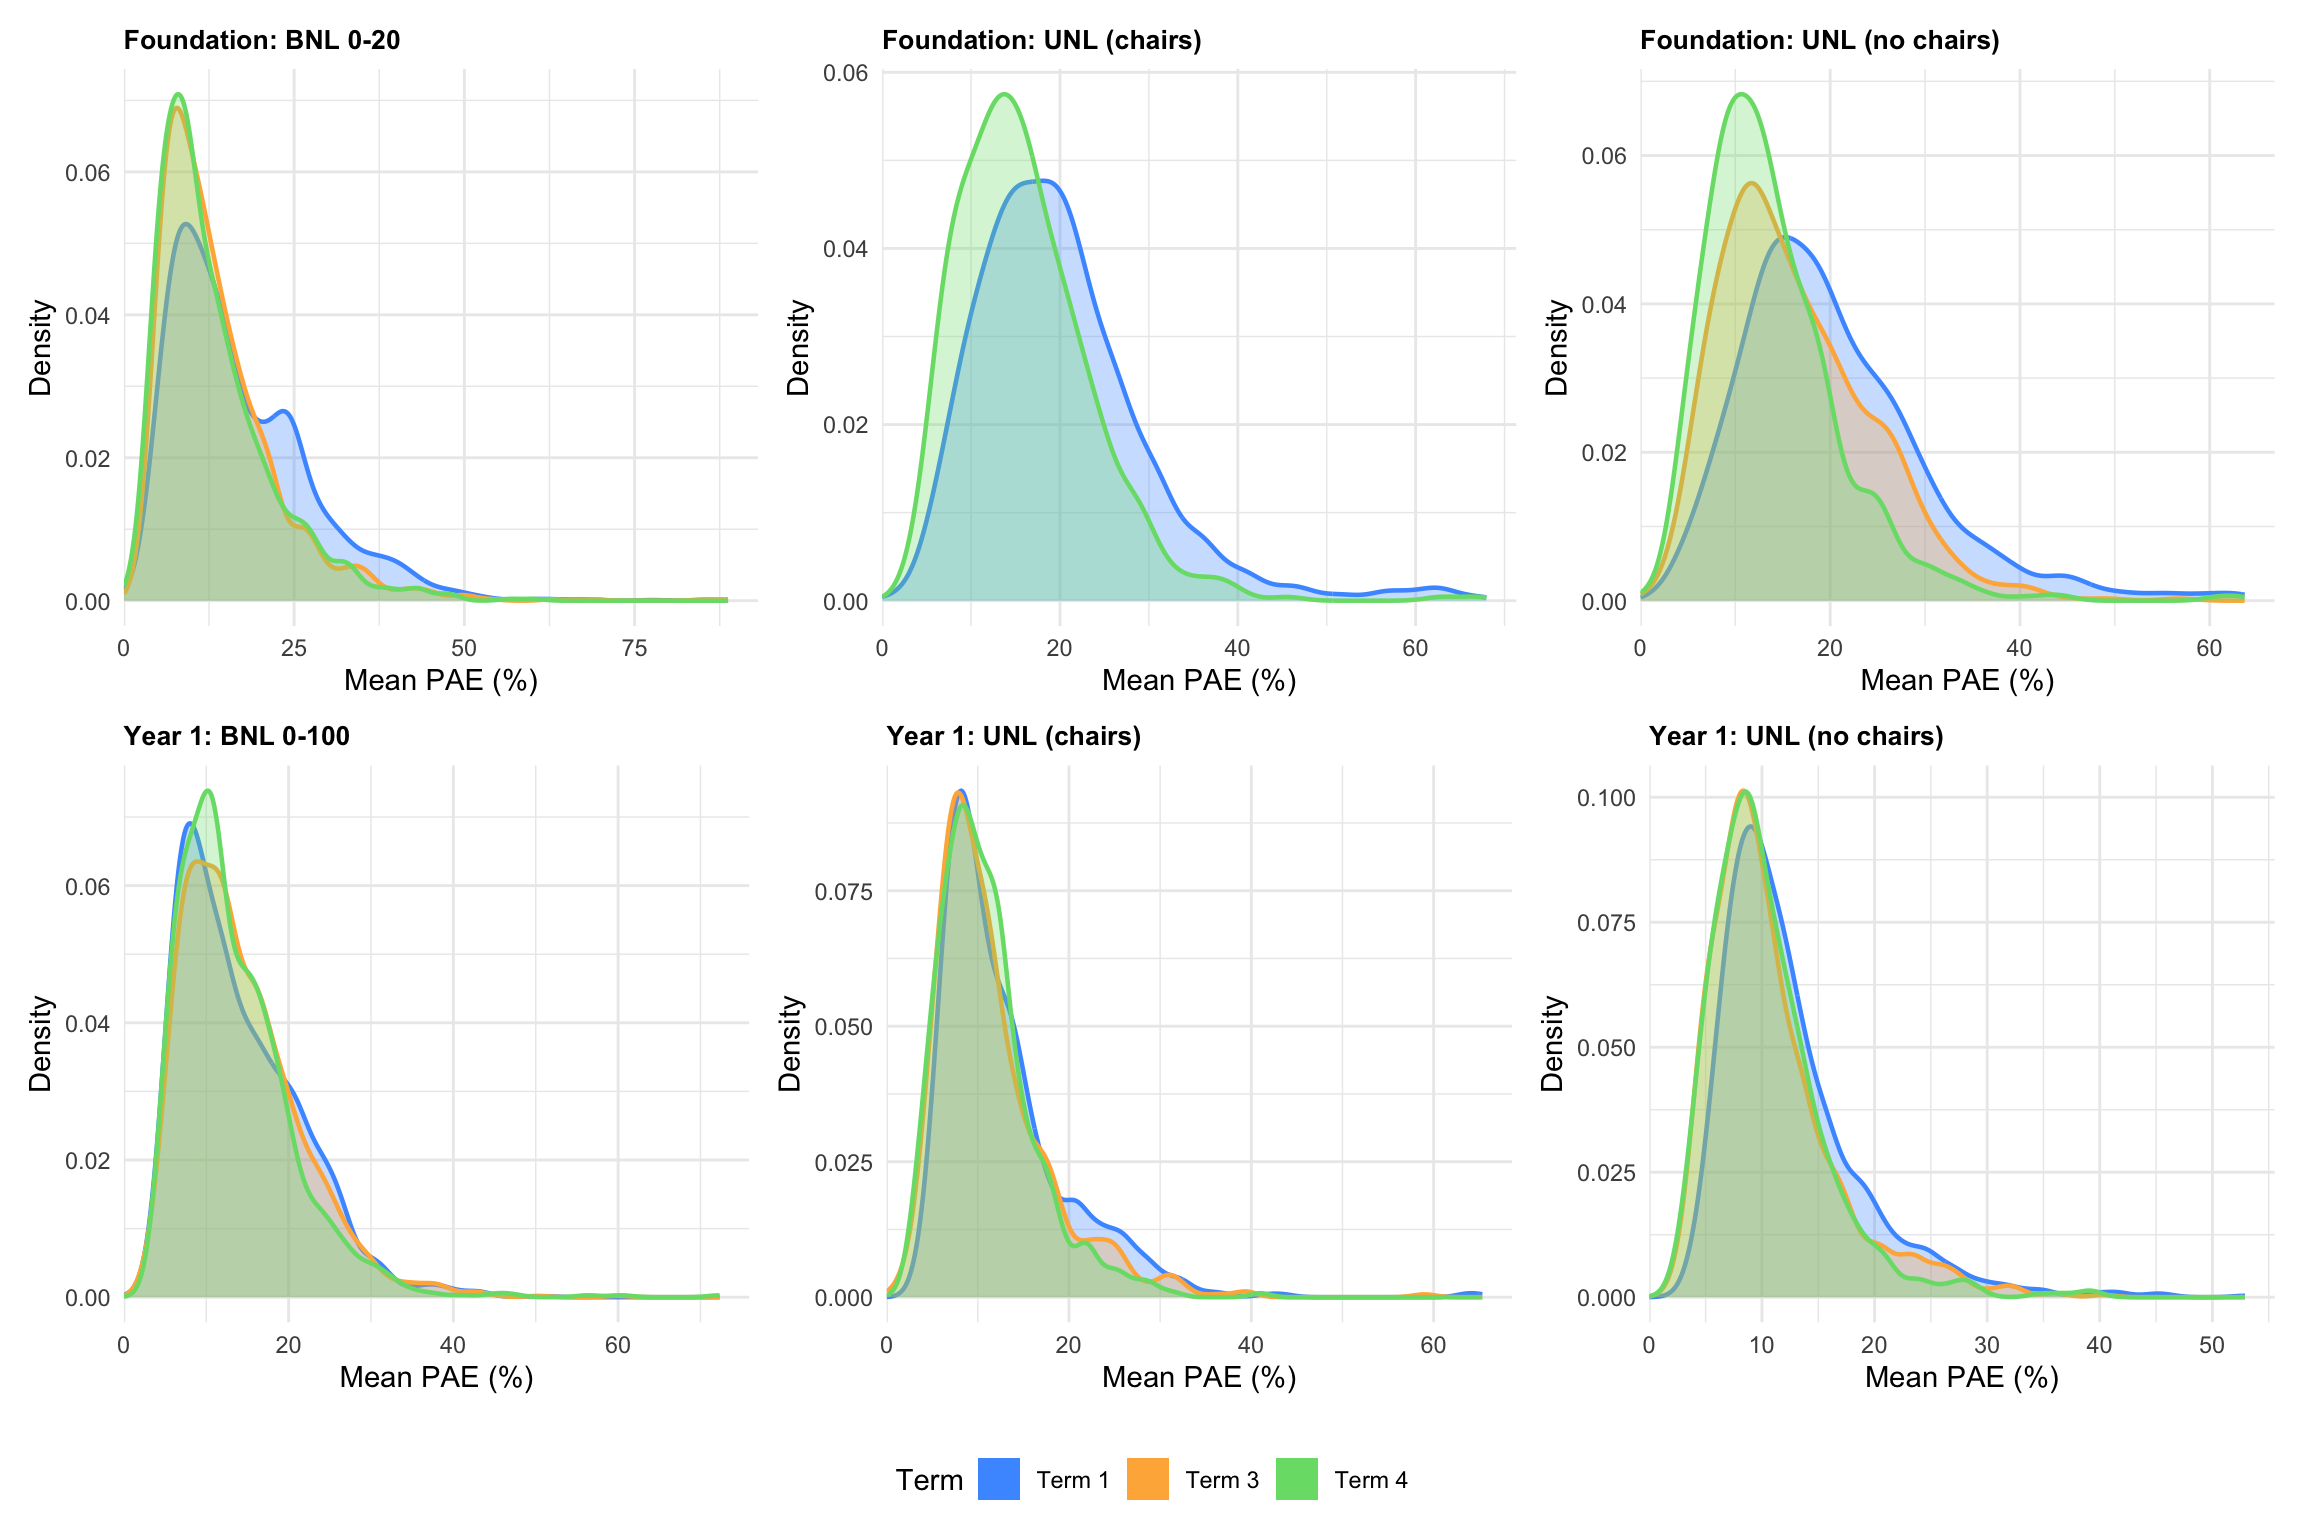
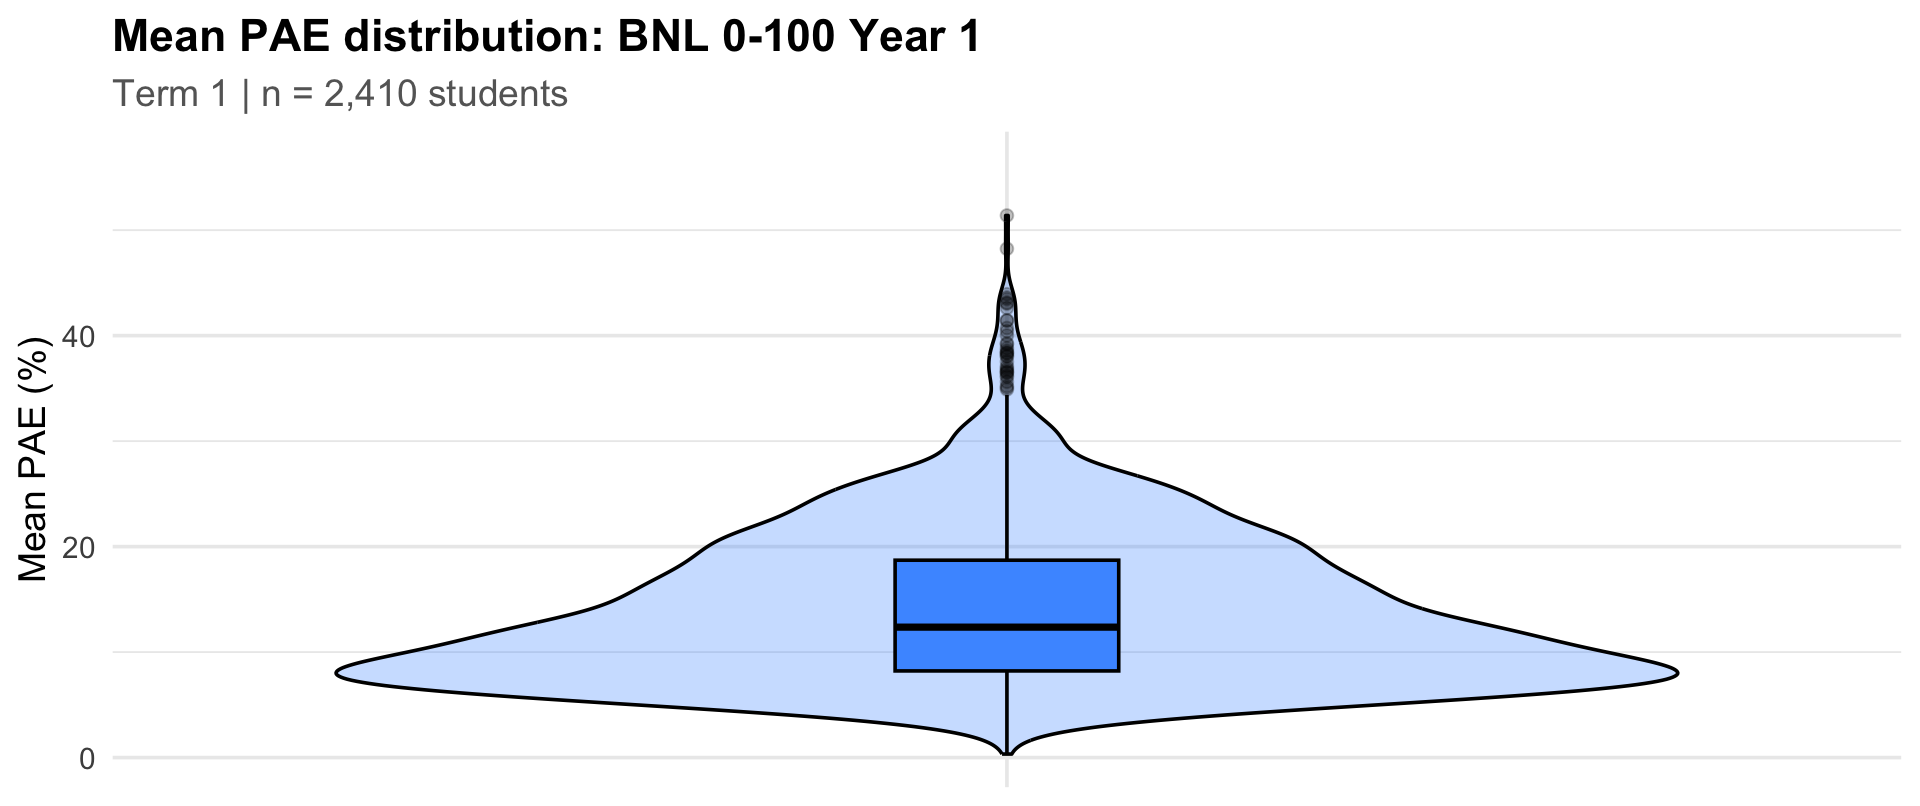
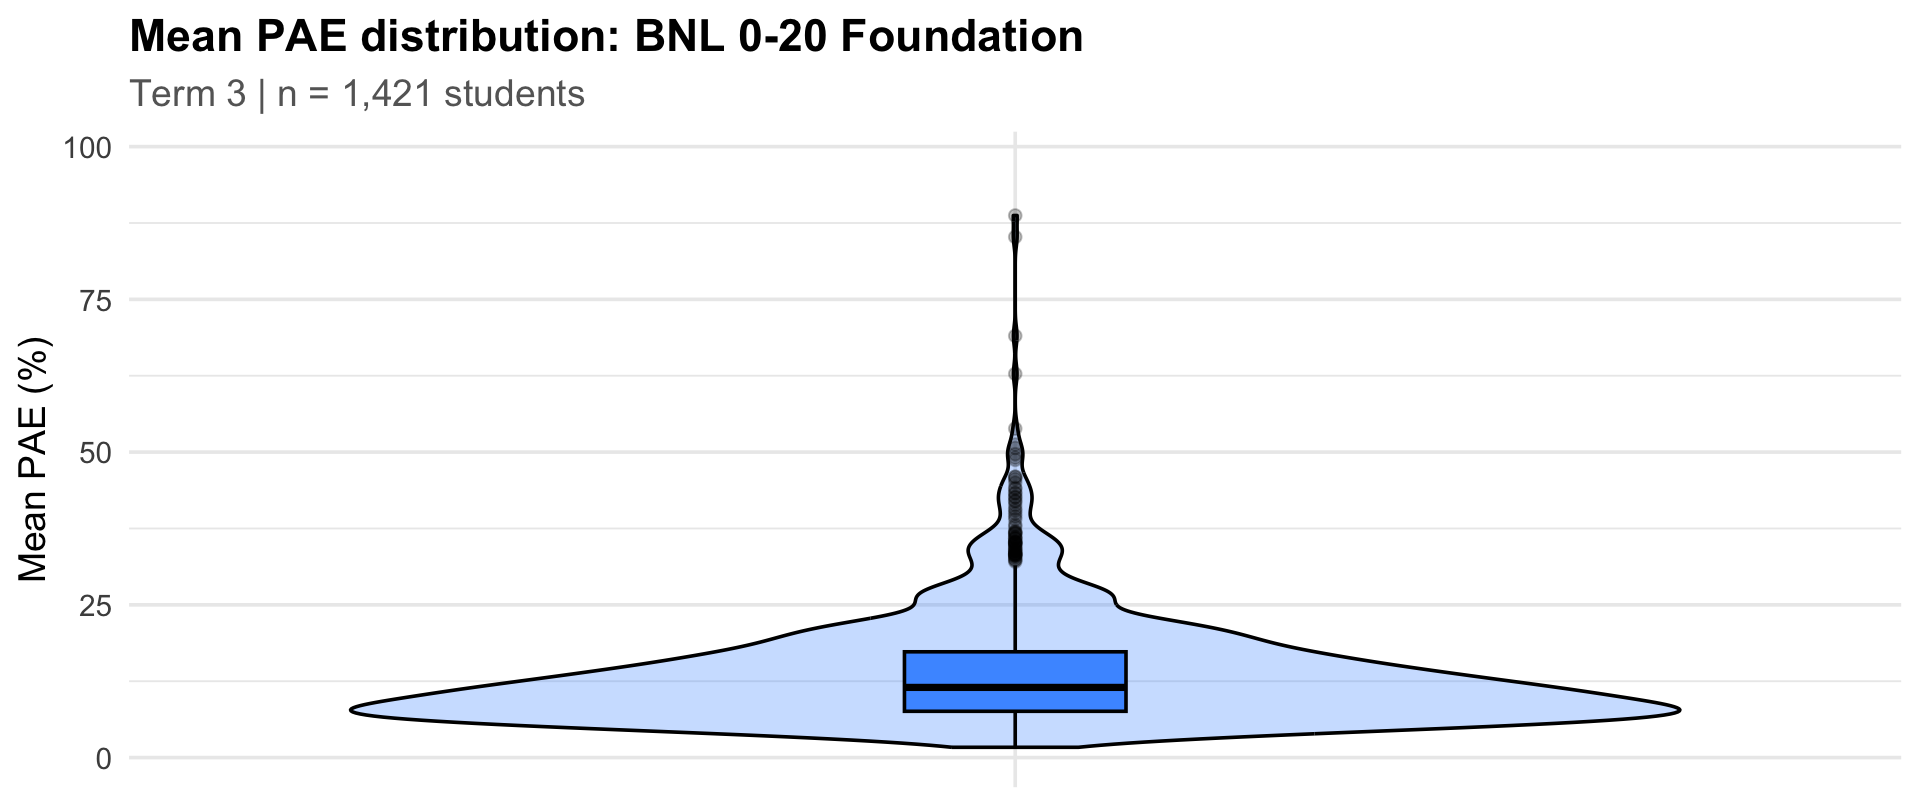
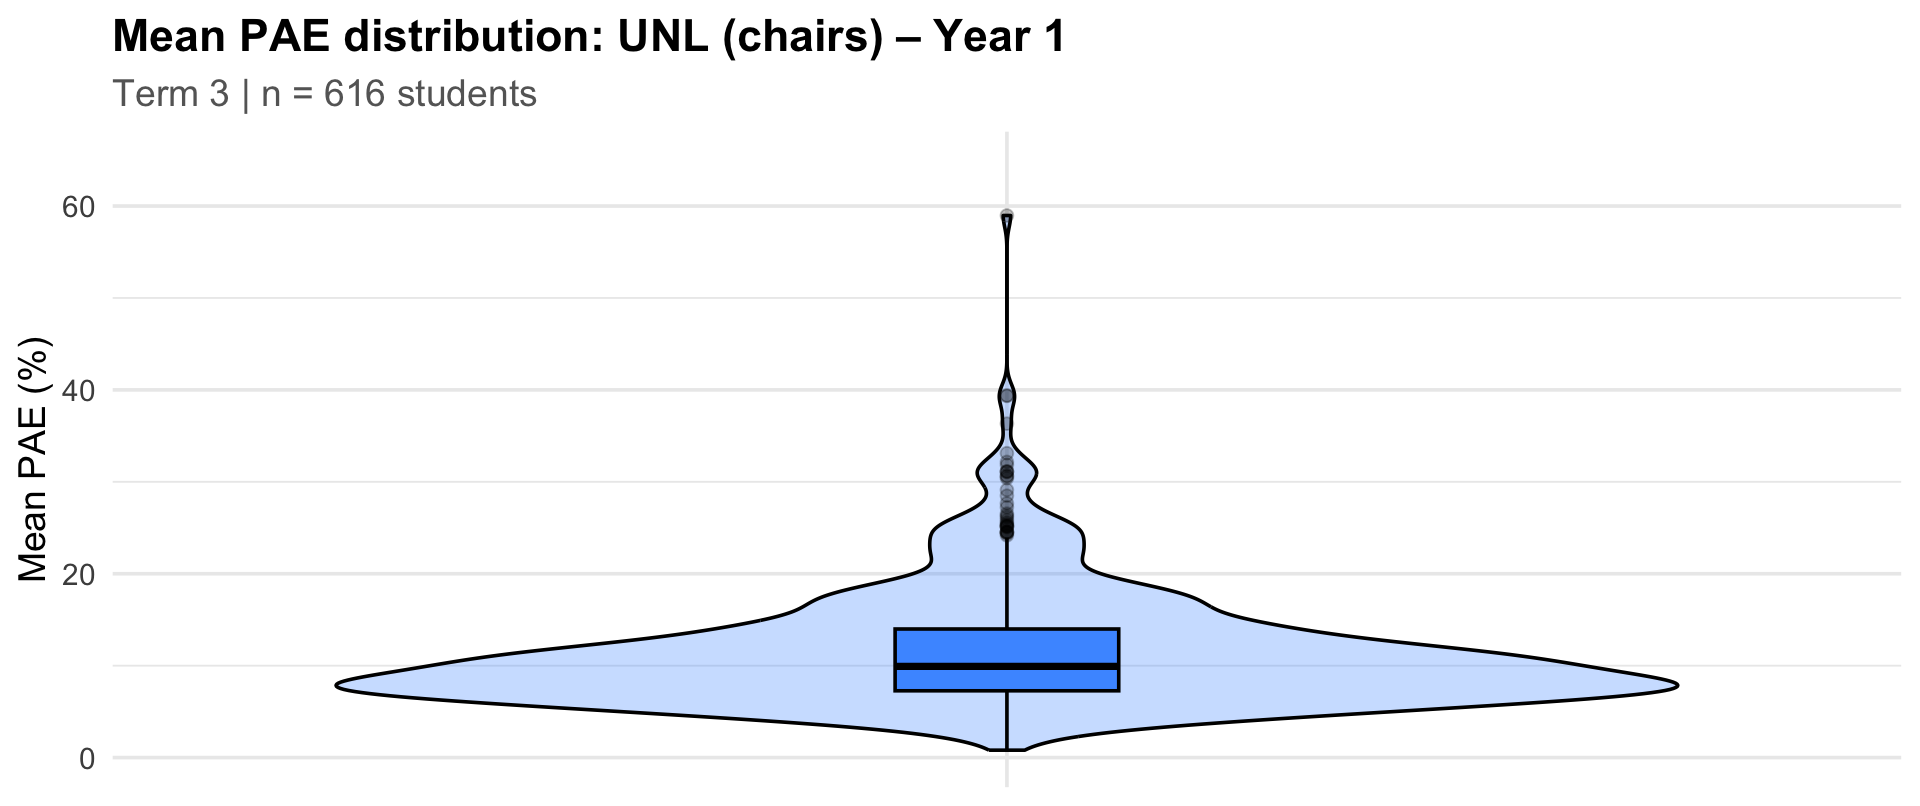
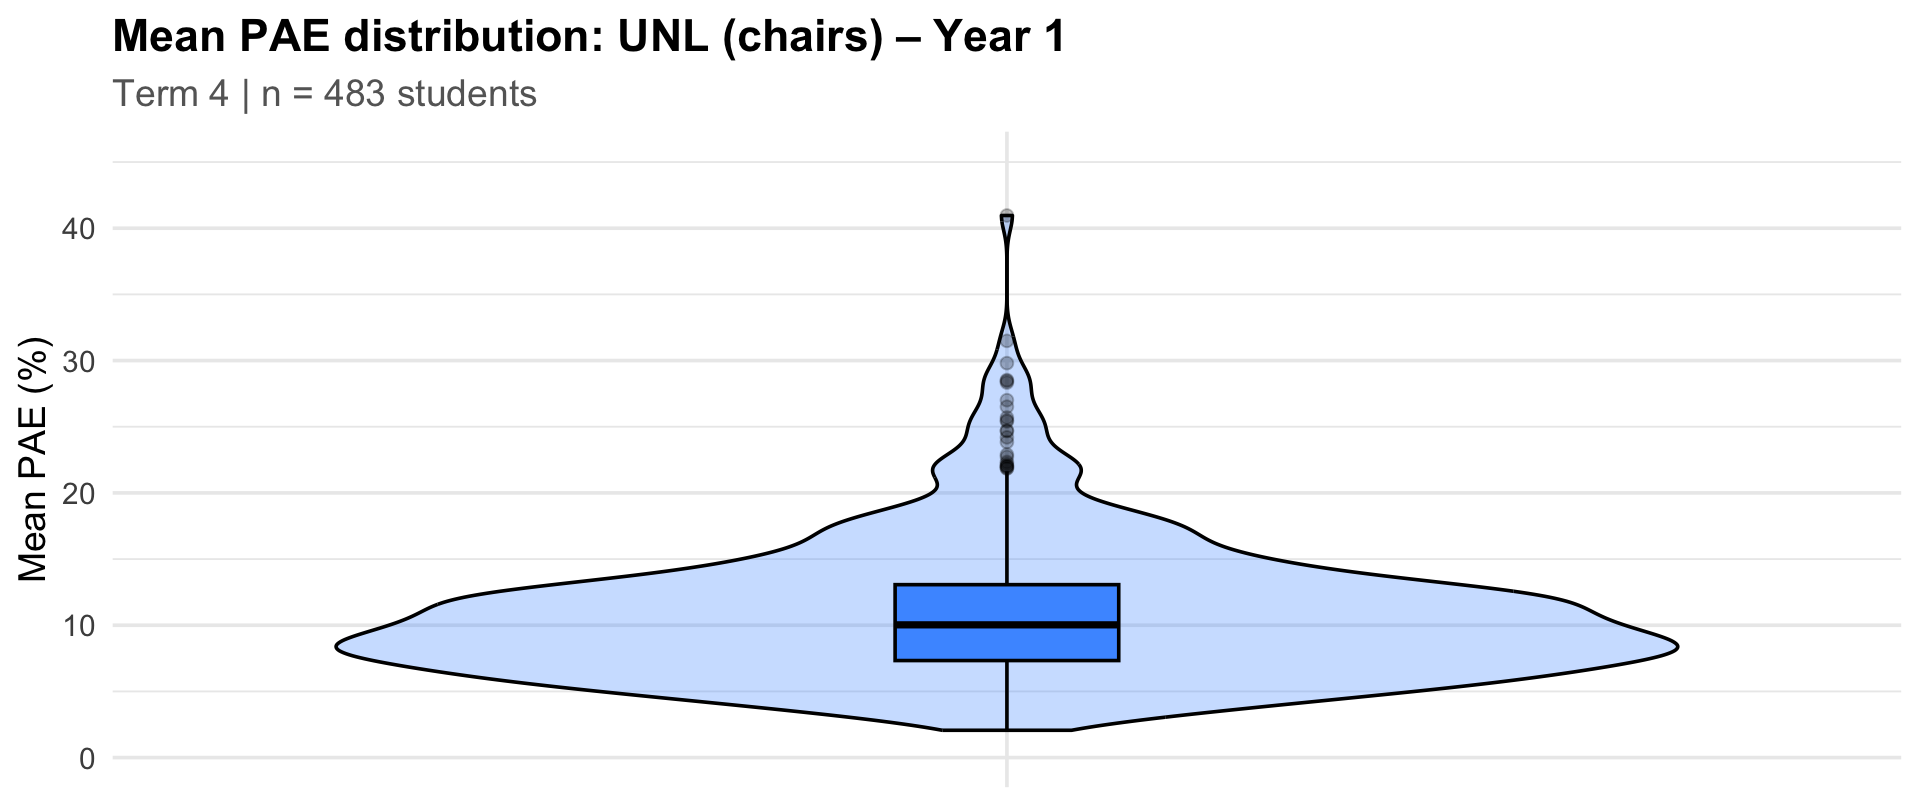
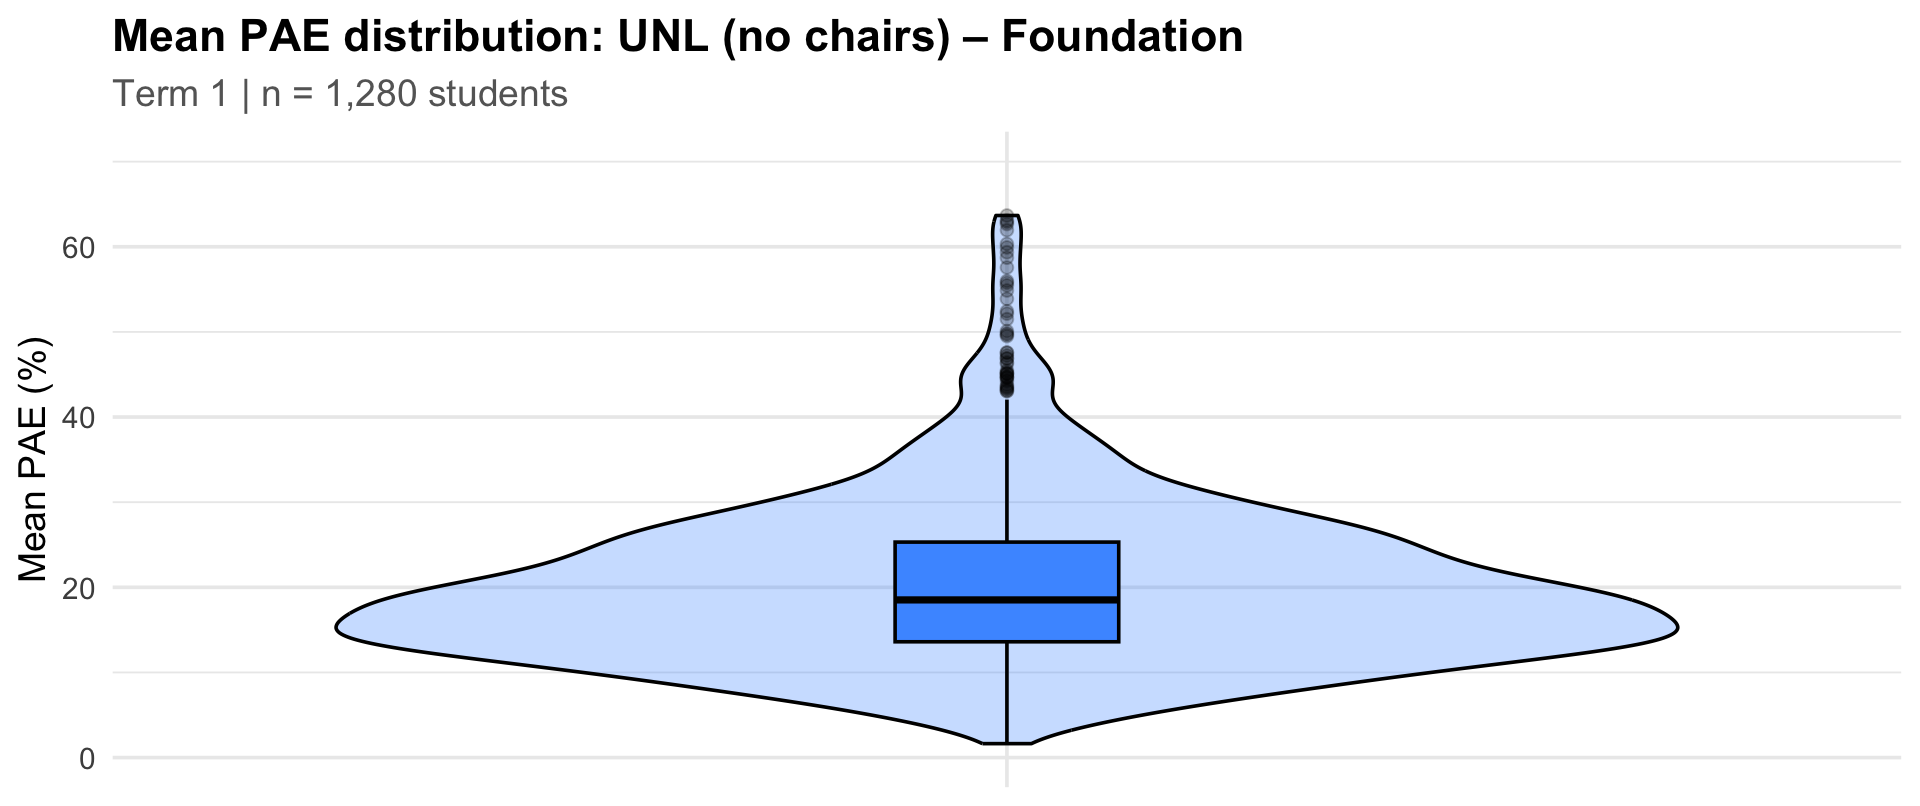
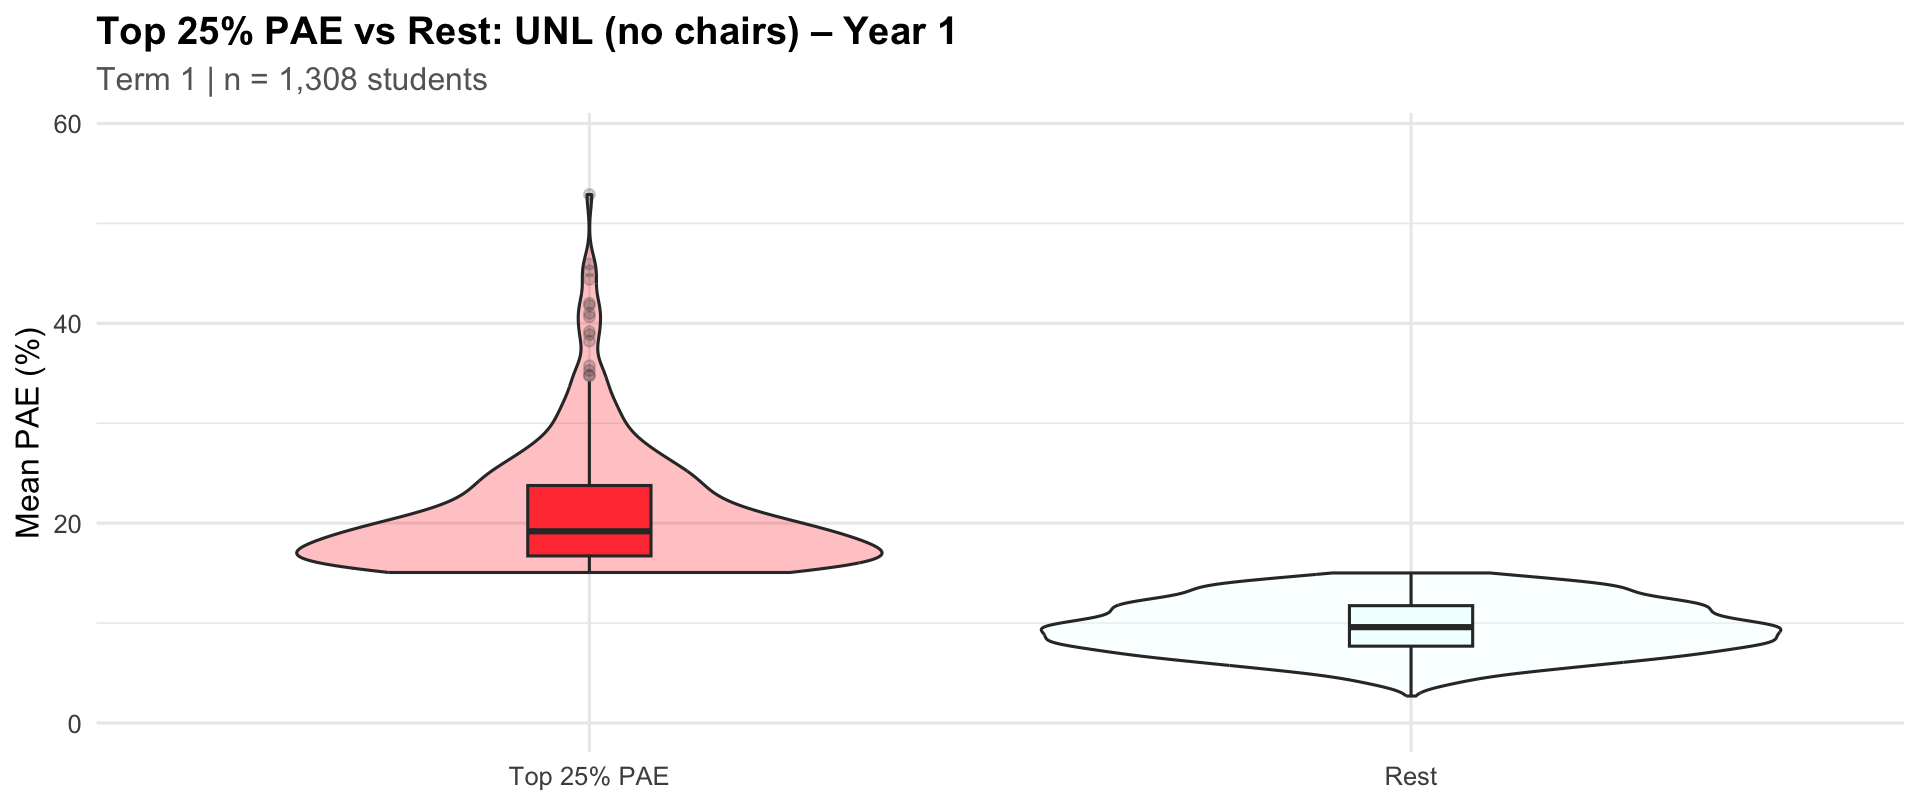
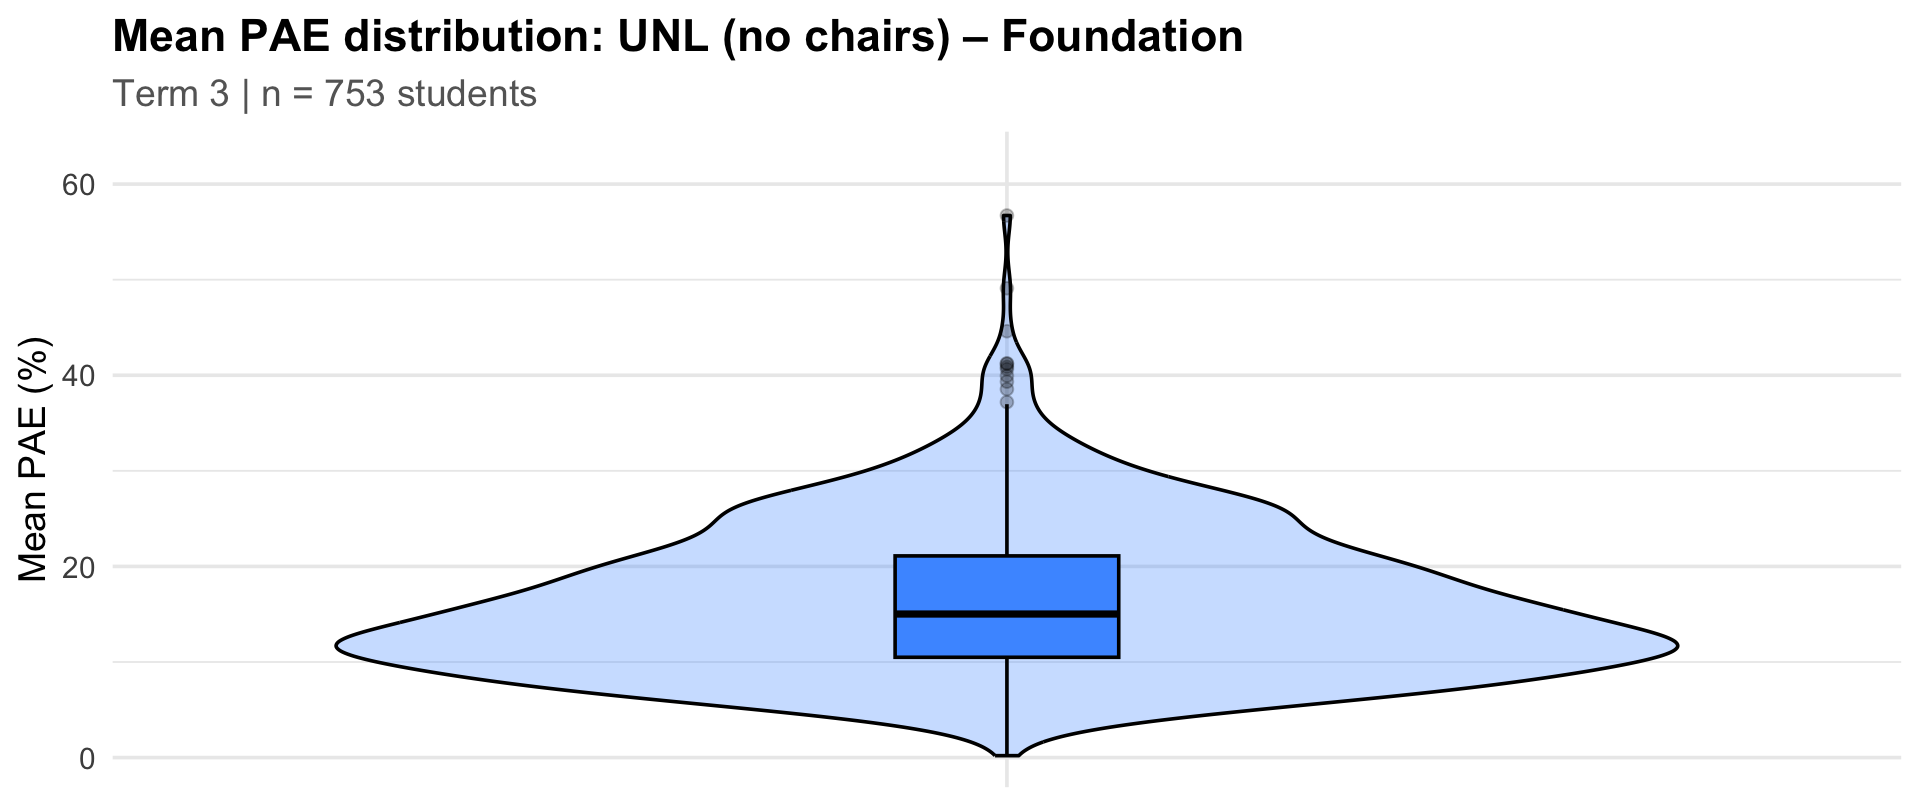
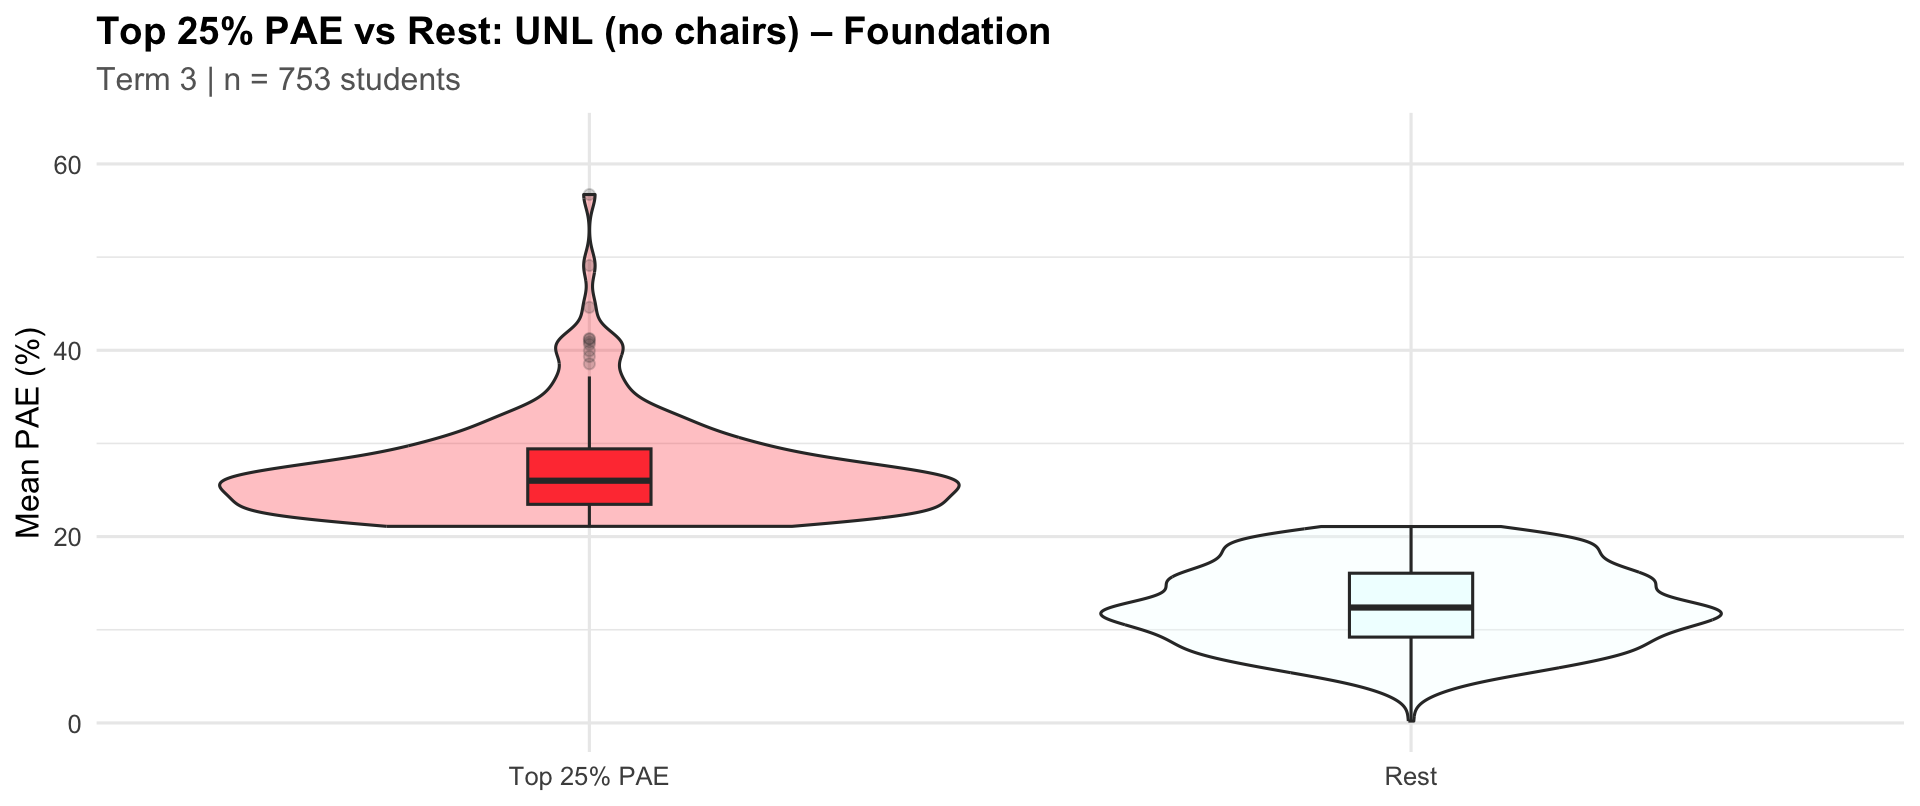
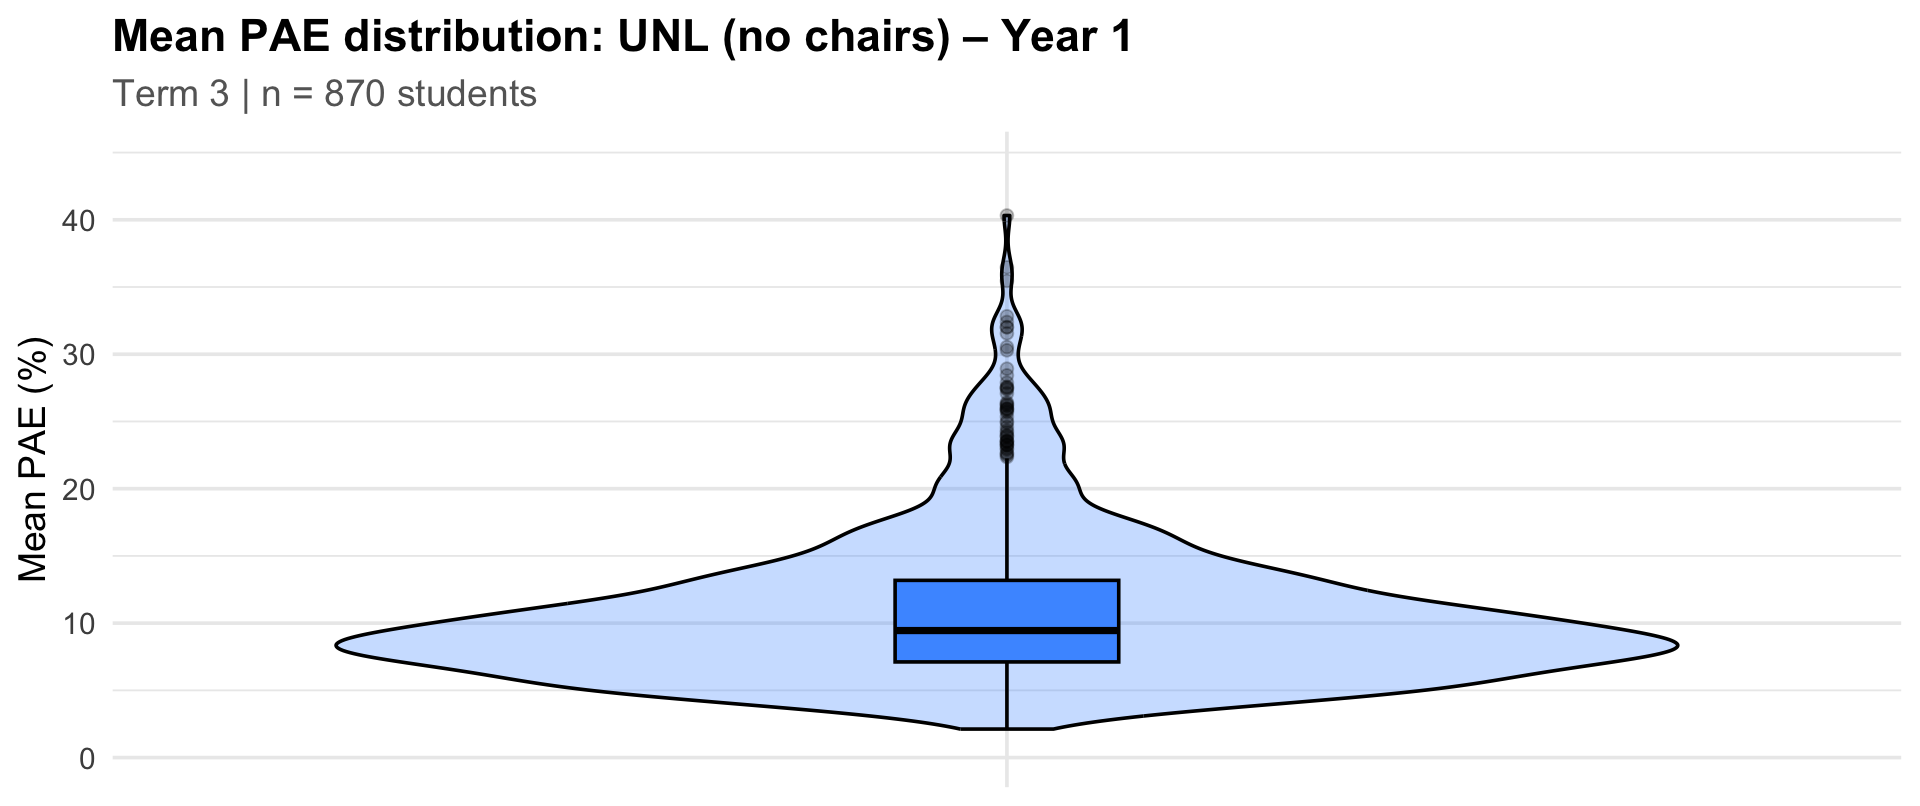
PAE distribution by term
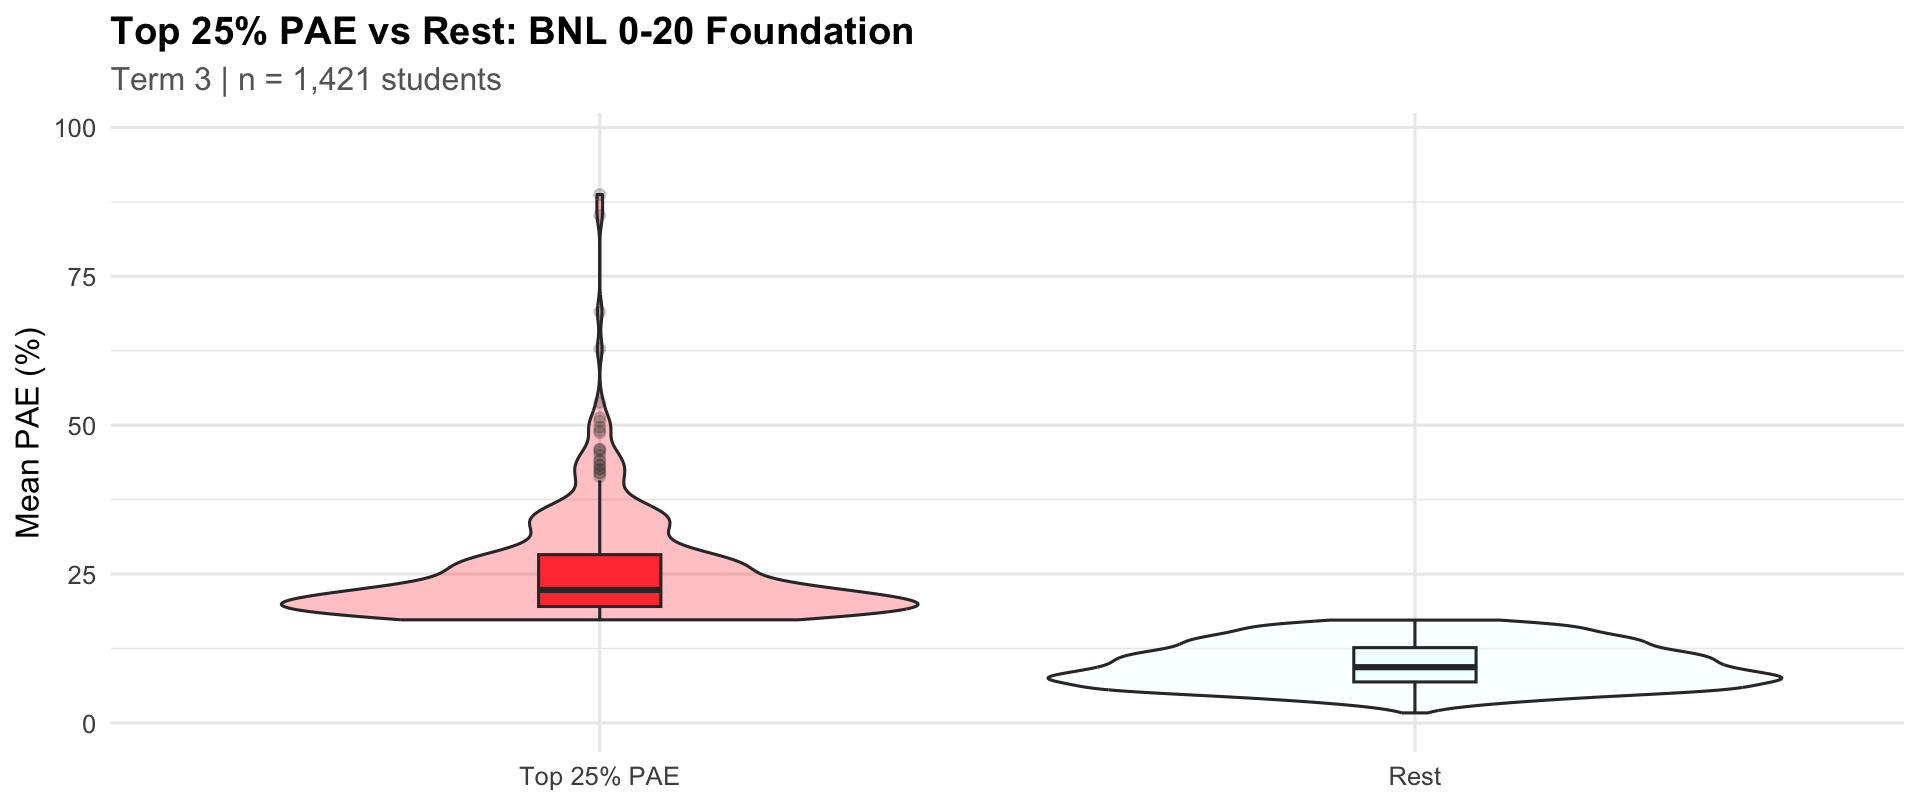
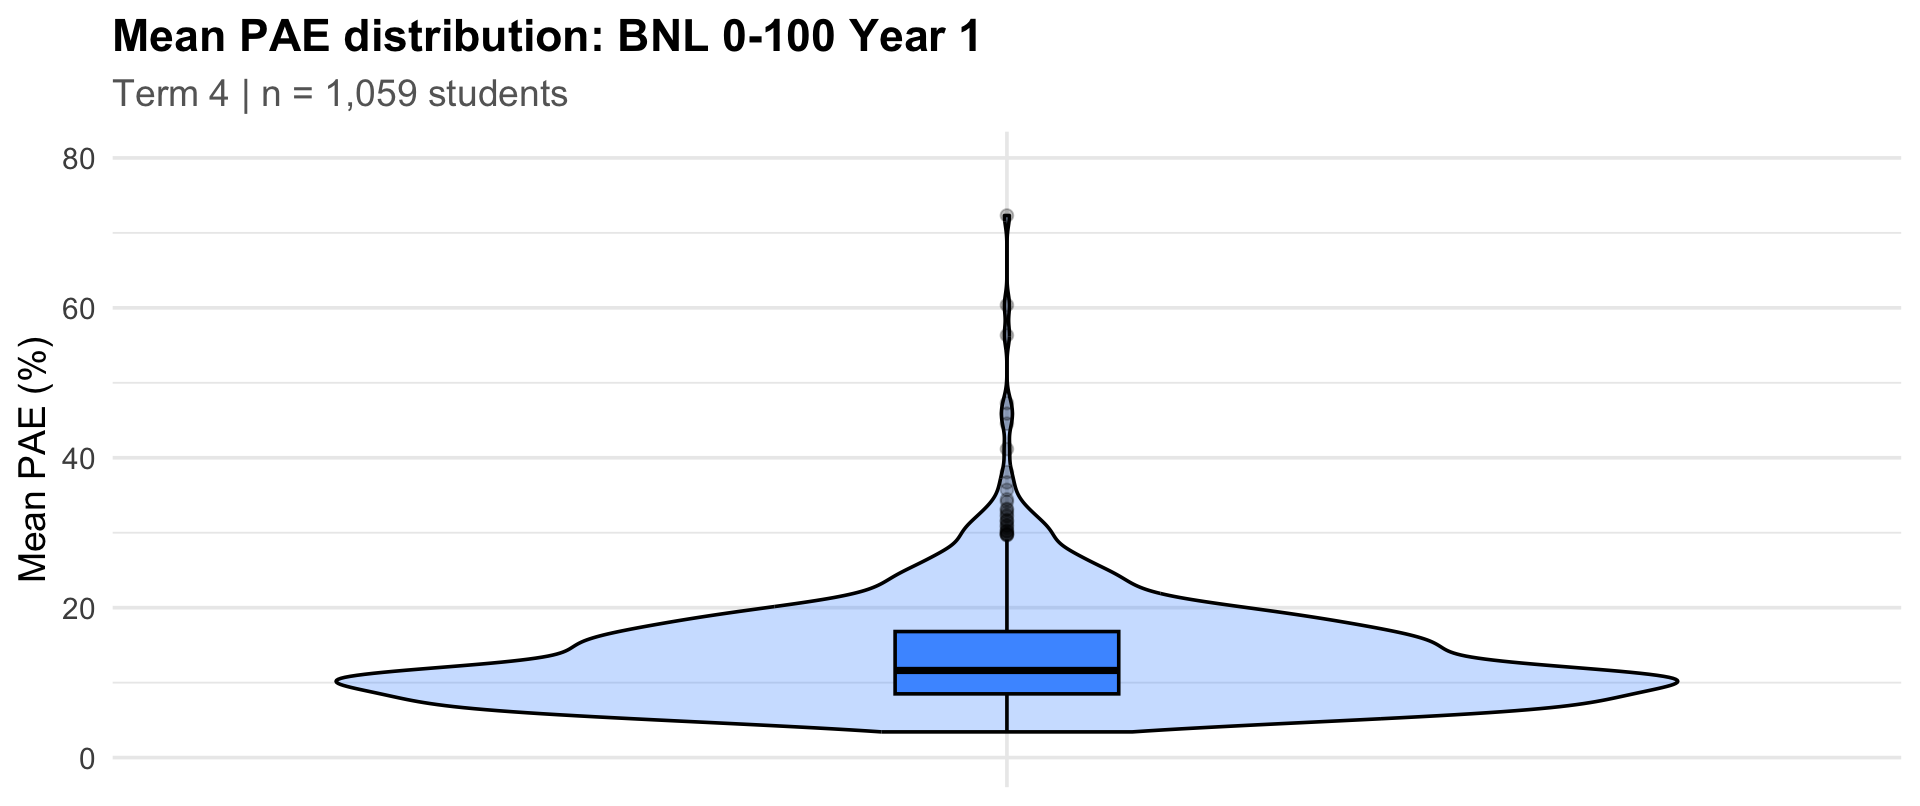
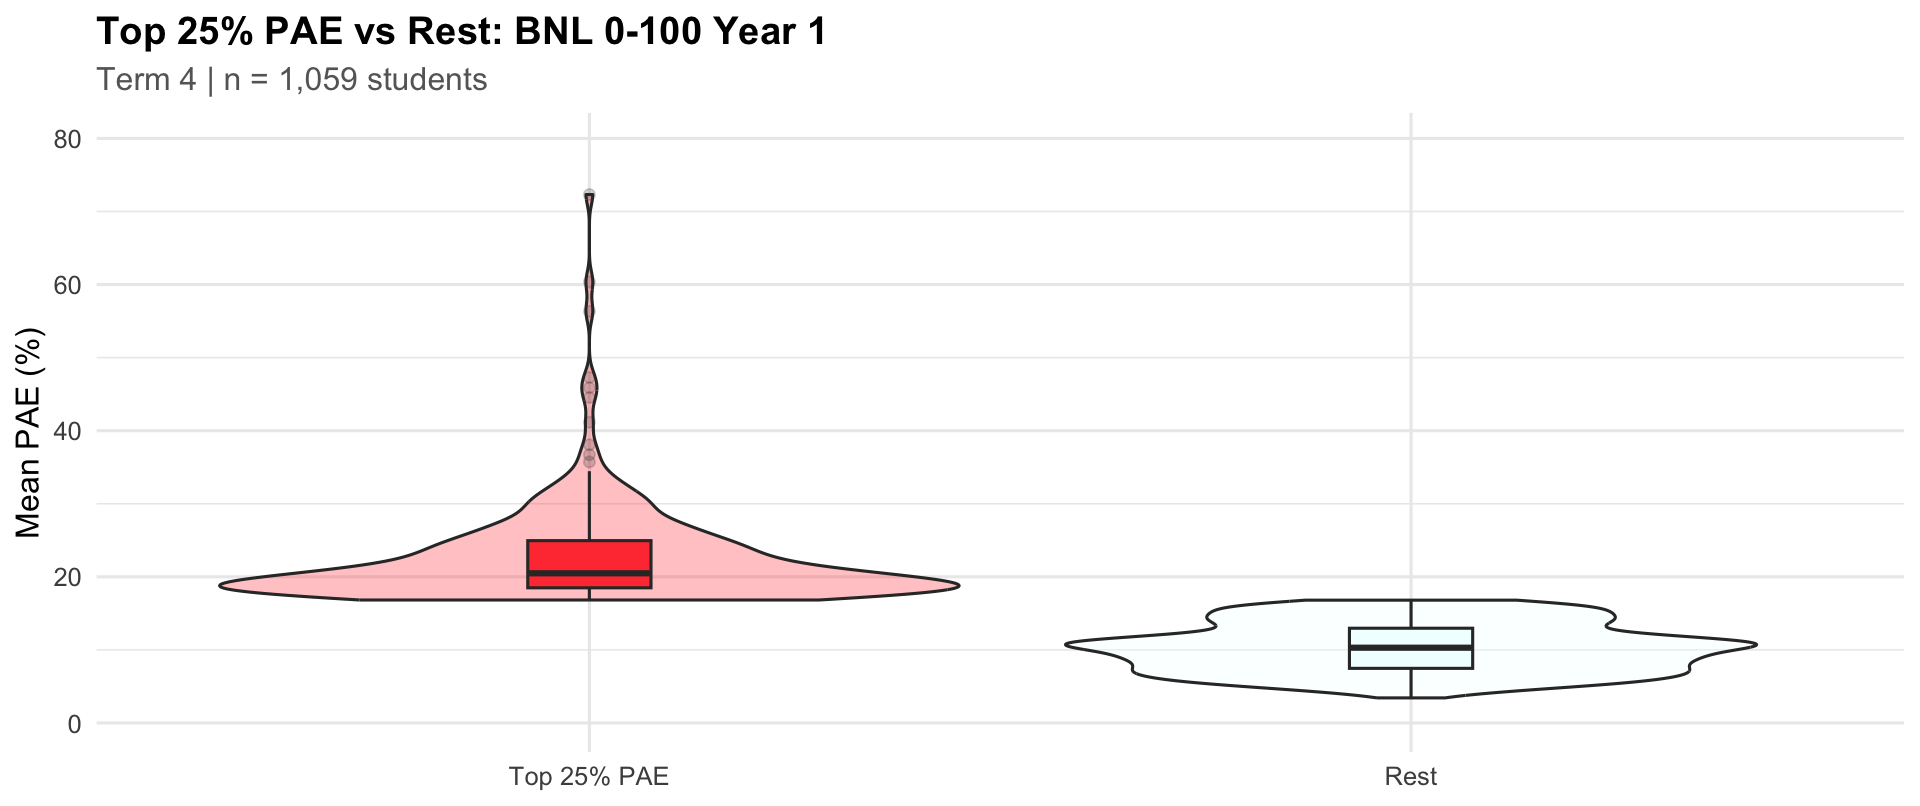
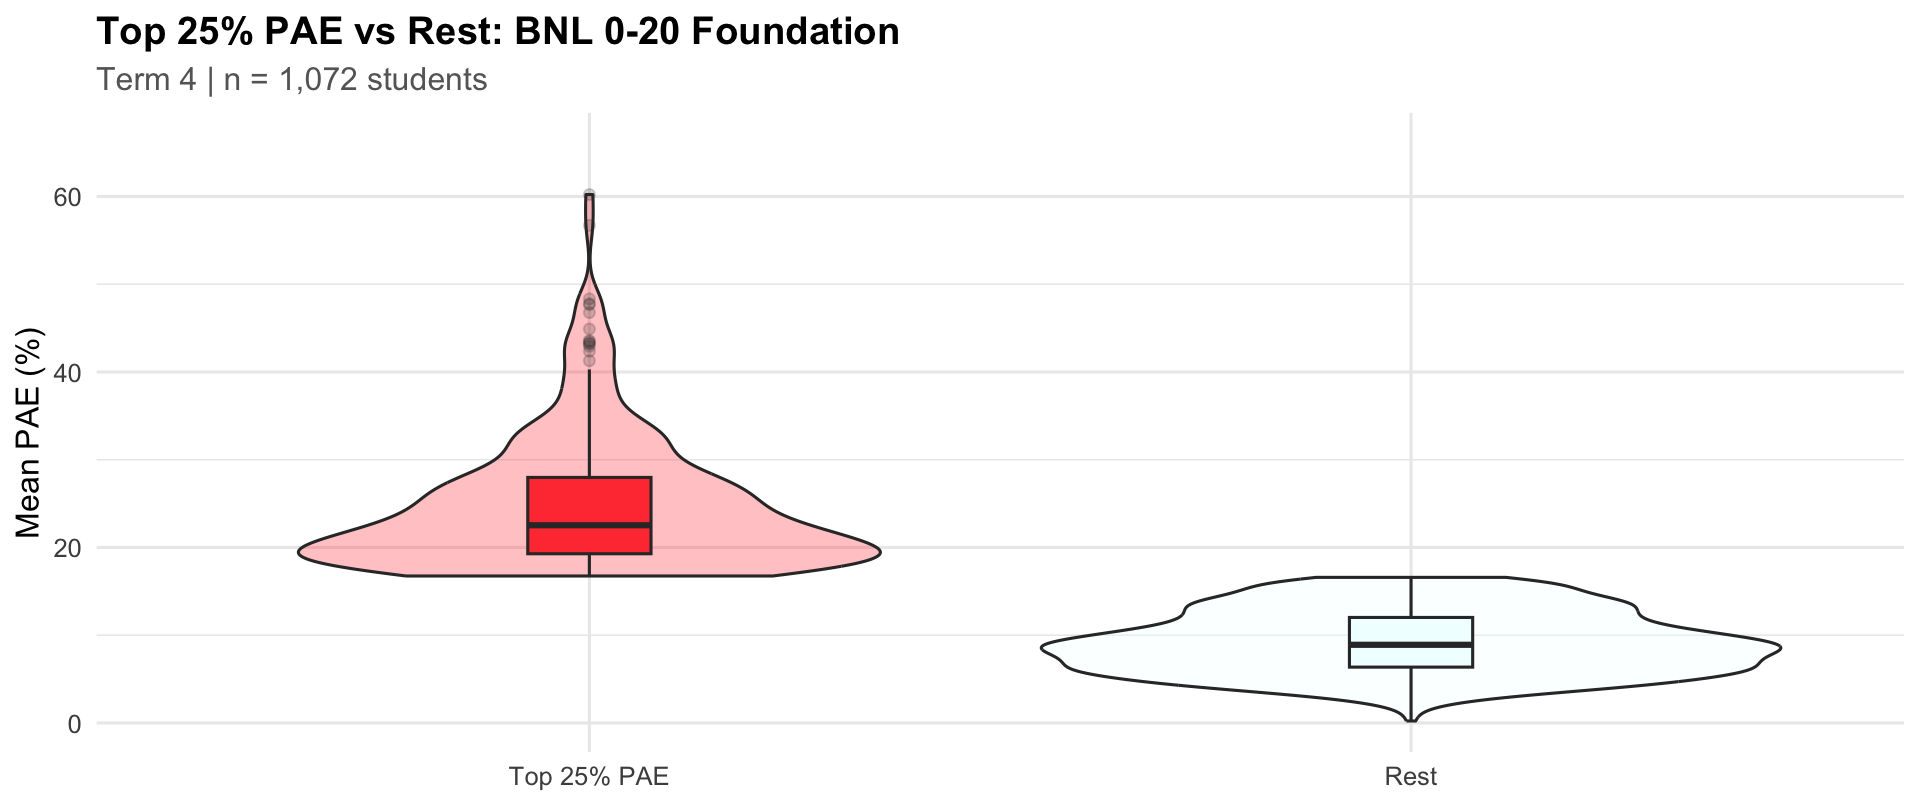
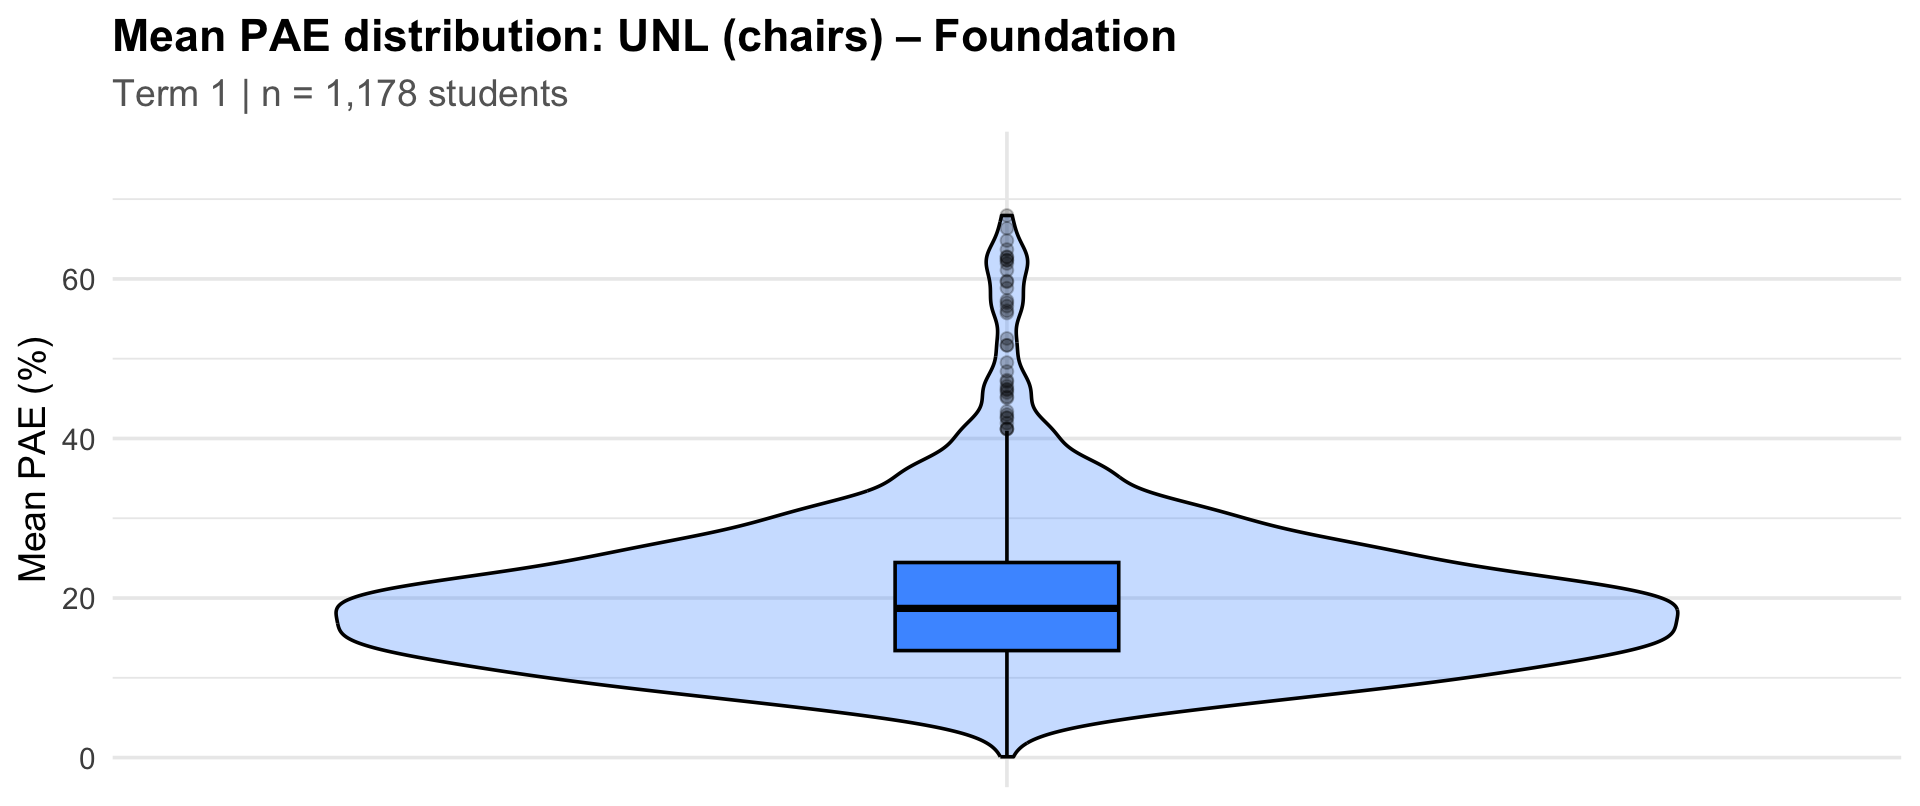
The density plots below show the distribution of mean PAE (Percentage Absolute Error) per student across terms for each test type and year level. Lower PAE values indicate better performance.
3. PAE distribution
3.1 Bounded Number Line (BNL)
PAE distribution (per student)
|
Students
|
25th %ile
|
Median
|
75th %ile
|
|
2415
|
8.2
|
12.35
|
18.71
|
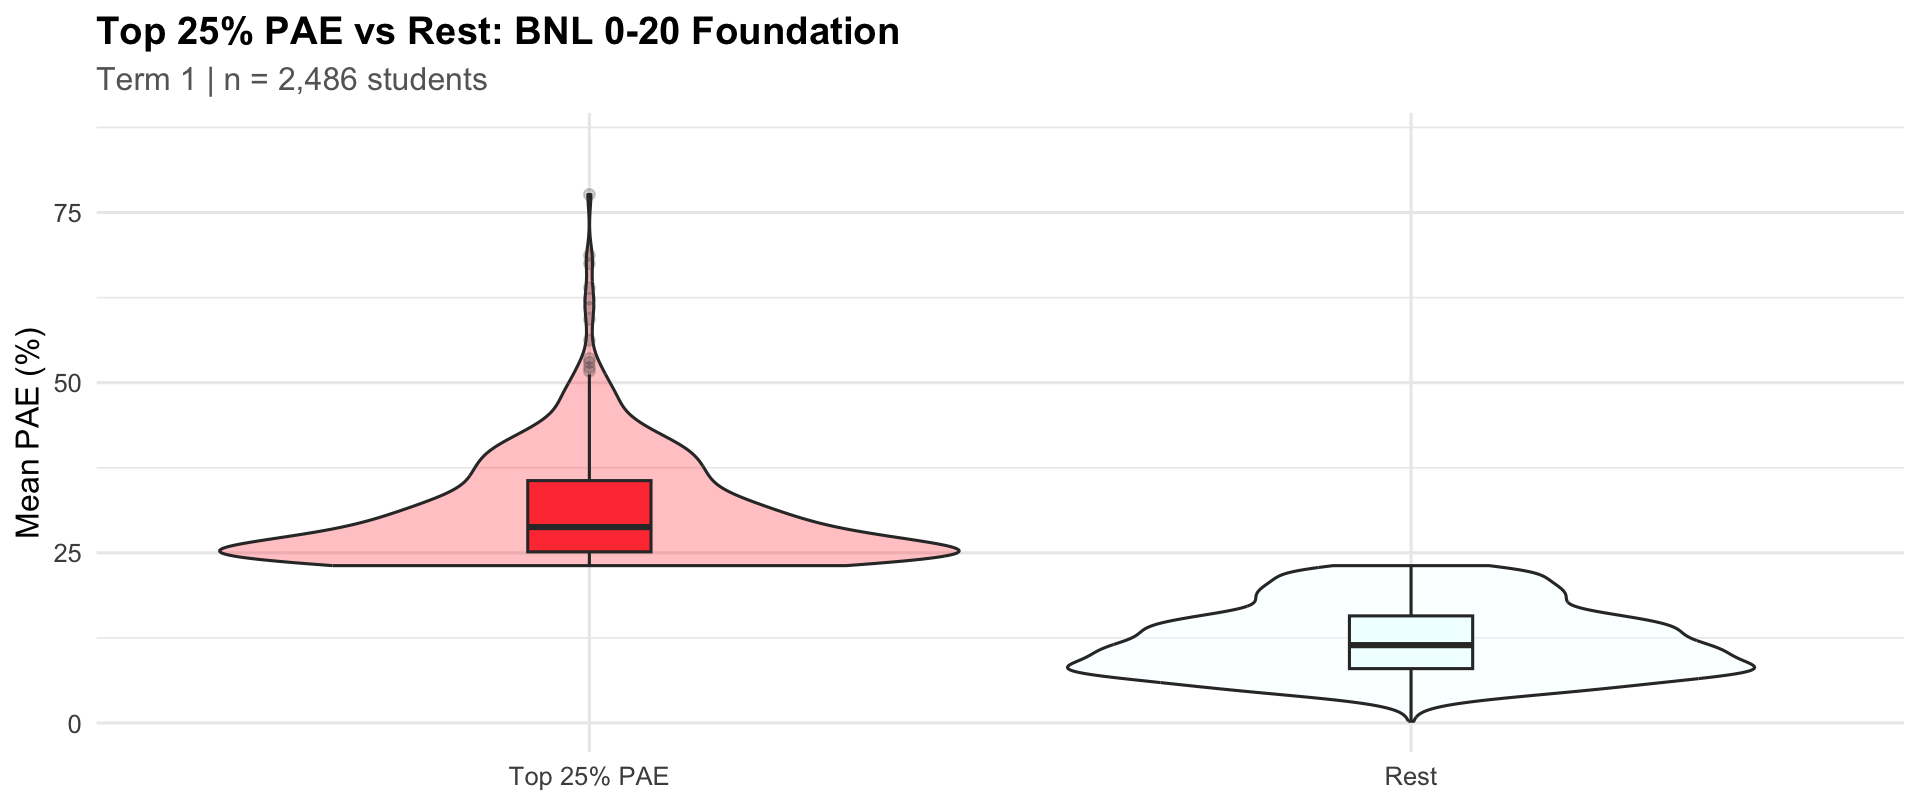
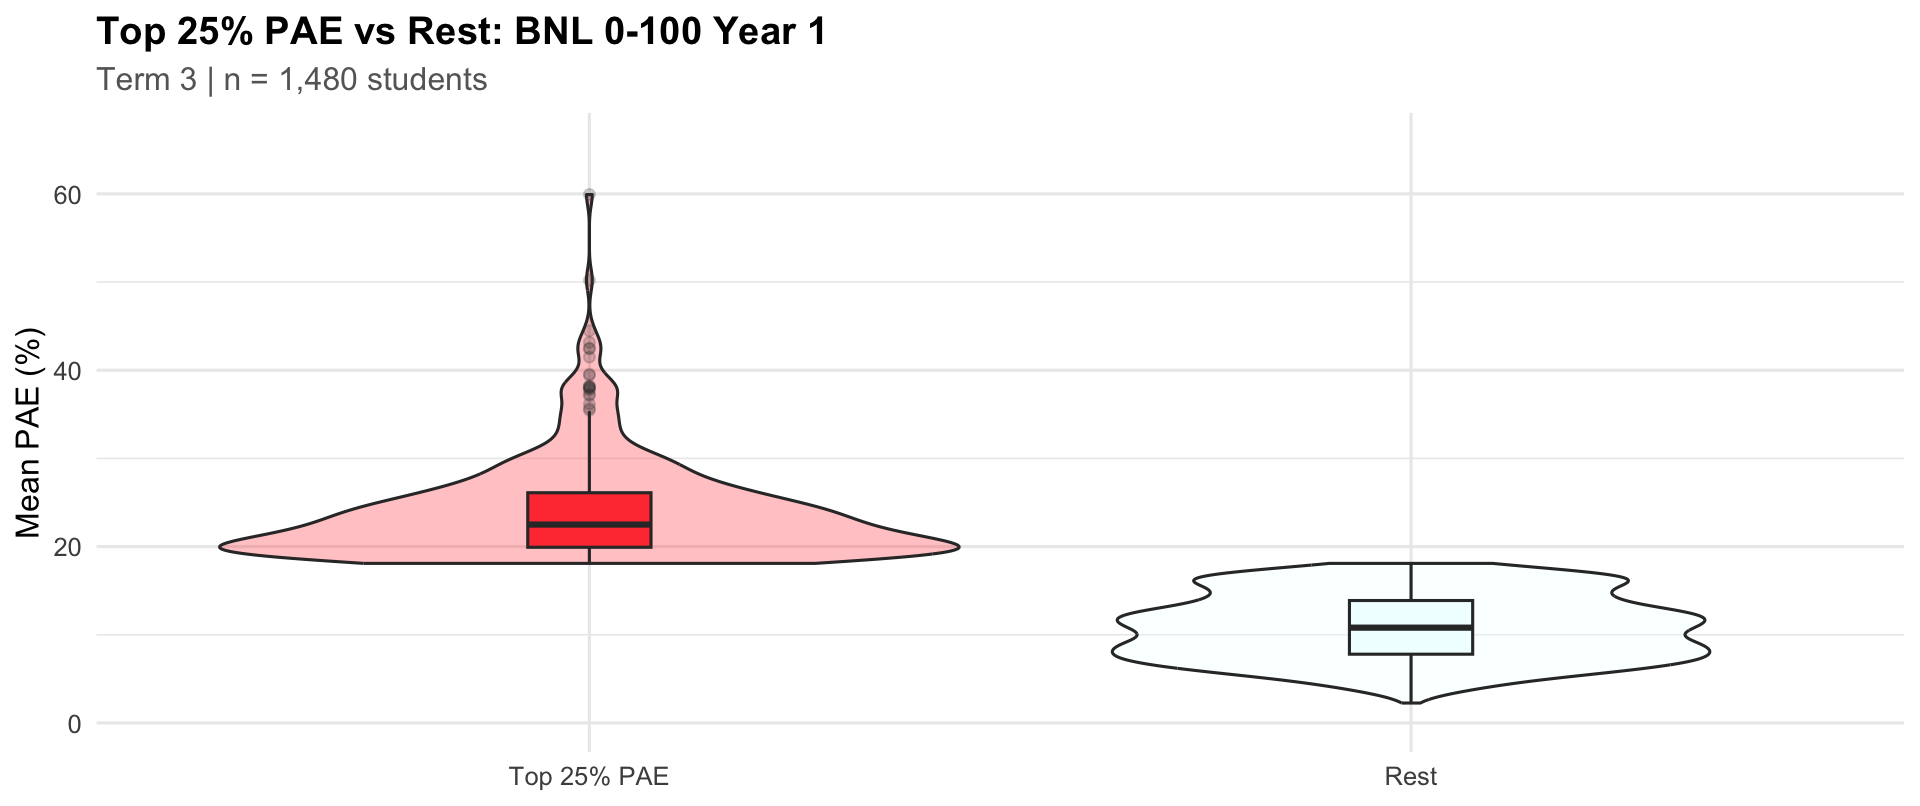
Top quartile (highest PAE) vs rest

|
Group
|
Students
|
25th %ile
|
Median
|
75th %ile
|
|
Top 25% PAE
|
604
|
20.69
|
23.10
|
26.29
|
|
Rest
|
1811
|
7.41
|
10.08
|
13.71
|
PAE distribution (per student)

|
Students
|
25th %ile
|
Median
|
75th %ile
|
|
2486
|
9.08
|
14.24
|
23.11
|
Top quartile (highest PAE) vs rest
|
Group
|
Students
|
25th %ile
|
Median
|
75th %ile
|
|
Top 25% PAE
|
622
|
25.14
|
28.78
|
35.61
|
|
Rest
|
1864
|
7.98
|
11.43
|
15.73
|
PAE distribution (per student)

|
Students
|
25th %ile
|
Median
|
75th %ile
|
|
1482
|
8.78
|
12.62
|
18.09
|
Top quartile (highest PAE) vs rest
|
Group
|
Students
|
25th %ile
|
Median
|
75th %ile
|
|
Top 25% PAE
|
371
|
19.93
|
22.50
|
26.20
|
|
Rest
|
1111
|
7.80
|
10.81
|
13.89
|
PAE distribution (per student)
|
Students
|
25th %ile
|
Median
|
75th %ile
|
|
1424
|
7.58
|
11.49
|
17.33
|
Top quartile (highest PAE) vs rest
|
Group
|
Students
|
25th %ile
|
Median
|
75th %ile
|
|
Top 25% PAE
|
356
|
19.61
|
22.36
|
28.30
|
|
Rest
|
1068
|
6.89
|
9.38
|
12.65
|
PAE distribution (per student)
|
Students
|
25th %ile
|
Median
|
75th %ile
|
|
1059
|
8.5
|
11.62
|
16.82
|
Top quartile (highest PAE) vs rest
|
Group
|
Students
|
25th %ile
|
Median
|
75th %ile
|
|
Top 25% PAE
|
265
|
18.49
|
20.48
|
24.95
|
|
Rest
|
794
|
7.47
|
10.30
|
12.96
|
PAE distribution (per student)

|
Students
|
25th %ile
|
Median
|
75th %ile
|
|
1072
|
7.26
|
10.72
|
16.63
|
Top quartile (highest PAE) vs rest
|
Group
|
Students
|
25th %ile
|
Median
|
75th %ile
|
|
Top 25% PAE
|
268
|
19.28
|
22.53
|
27.98
|
|
Rest
|
804
|
6.36
|
8.91
|
12.02
|
3.2 Unbounded Number Line – Chairs
PAE distribution (per student)
|
Students
|
25th %ile
|
Median
|
75th %ile
|
|
1178
|
13.41
|
18.7
|
24.45
|
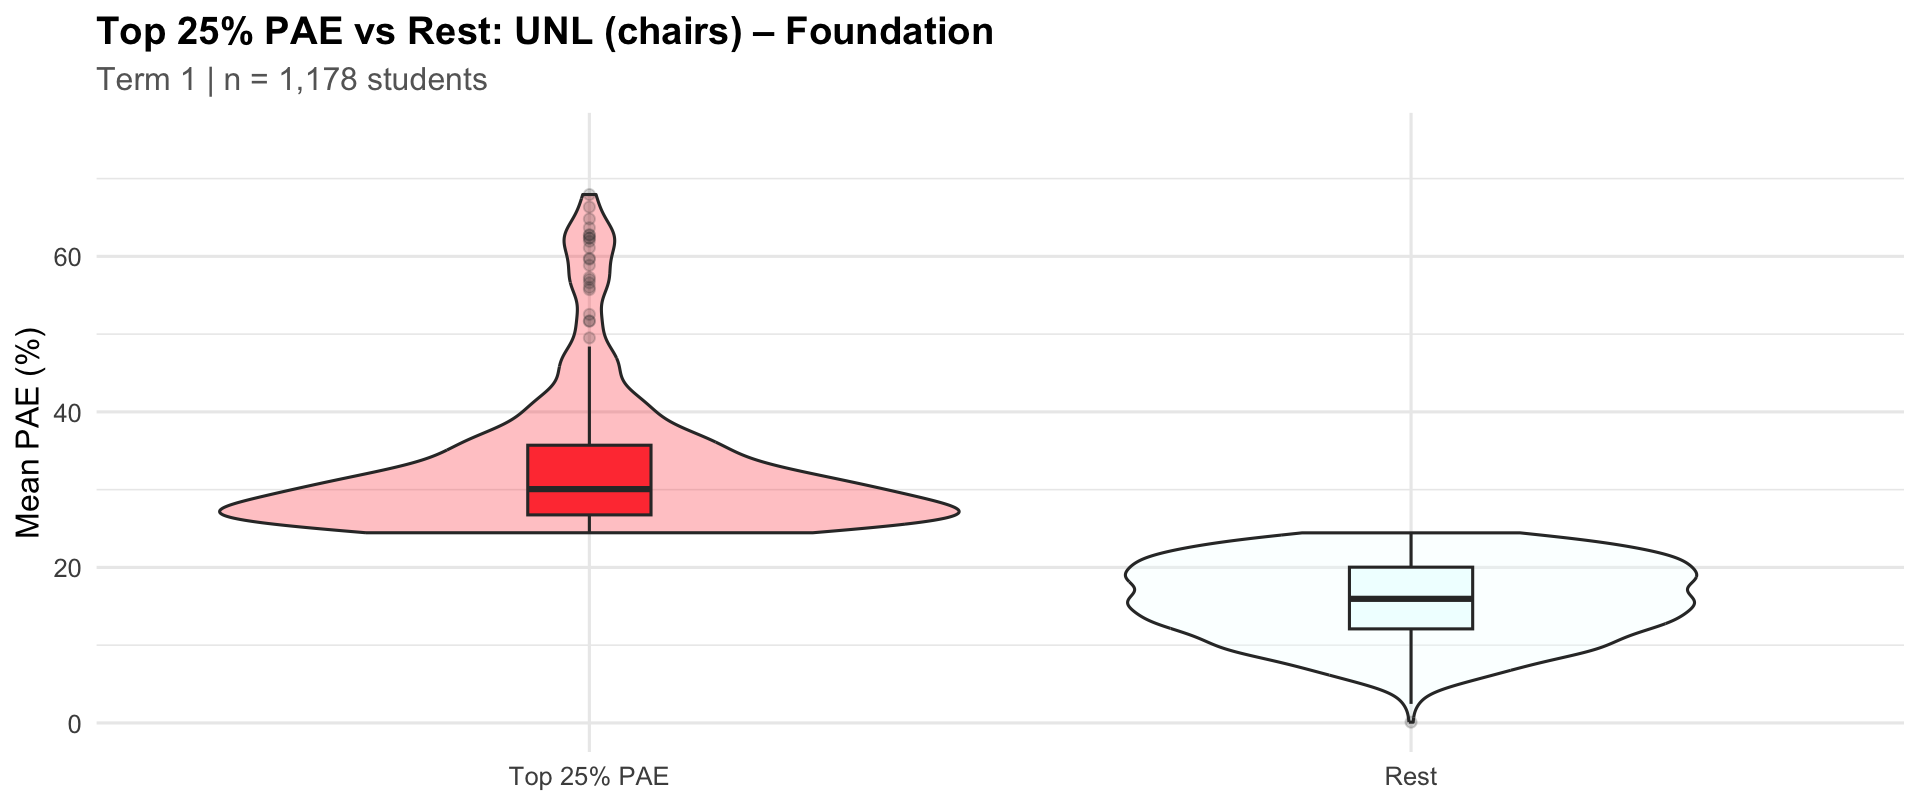
Top quartile (highest PAE) vs rest
|
Group
|
Students
|
25th %ile
|
Median
|
75th %ile
|
|
Top 25% PAE
|
295
|
26.75
|
30.07
|
35.71
|
|
Rest
|
883
|
12.09
|
15.96
|
20.03
|
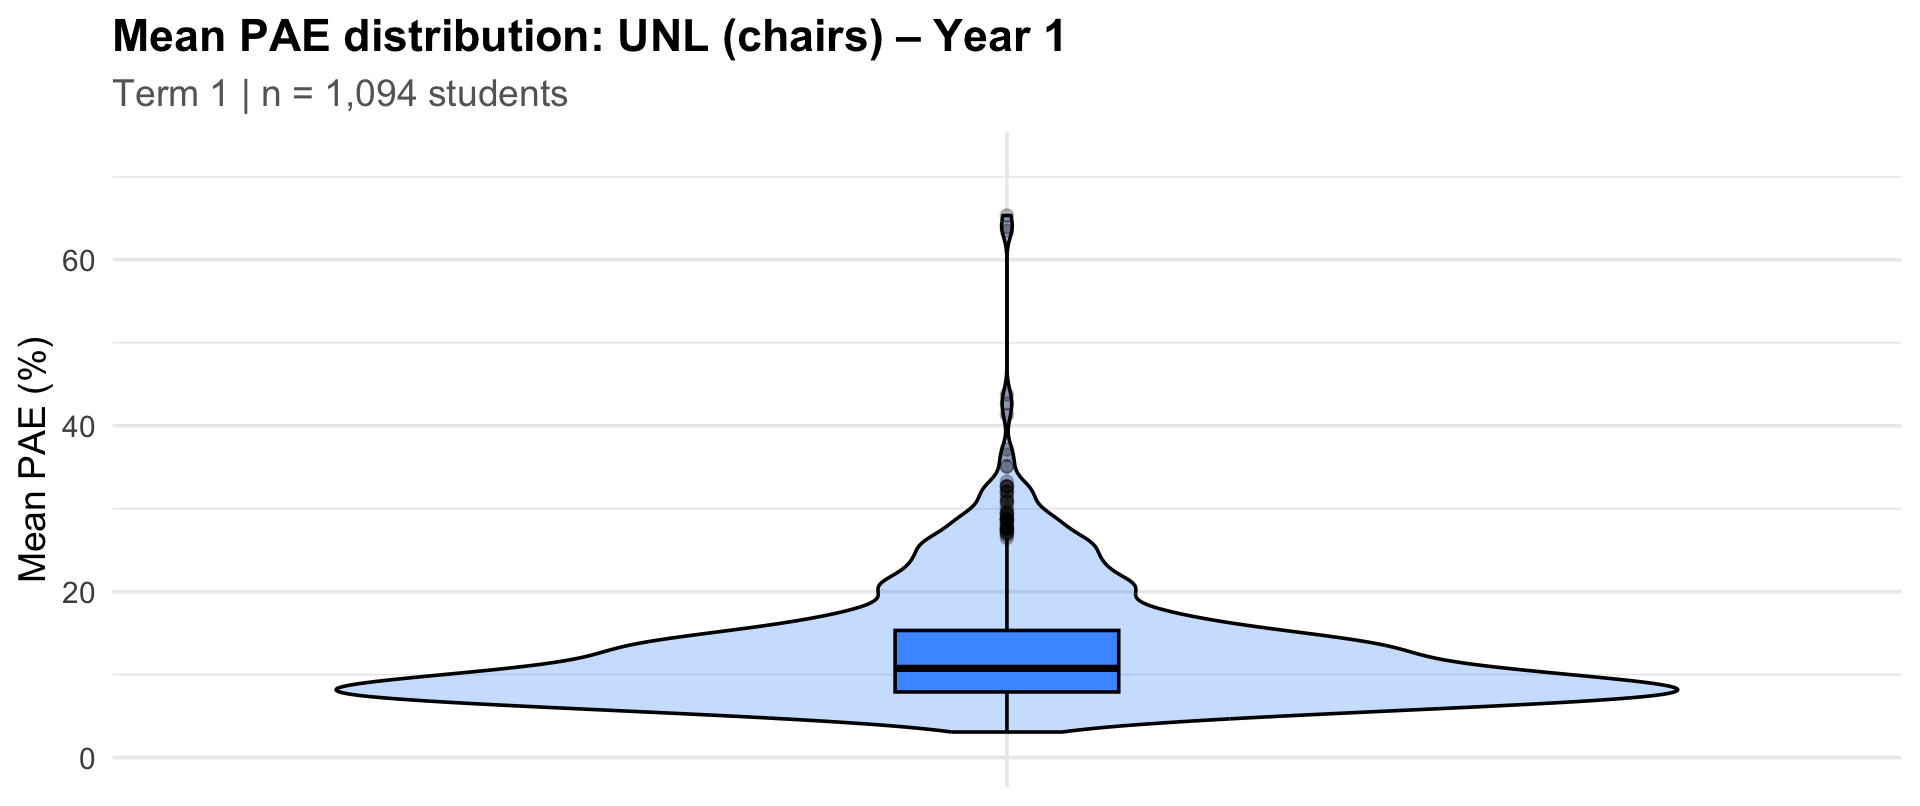
PAE distribution (per student)
|
Students
|
25th %ile
|
Median
|
75th %ile
|
|
1096
|
7.91
|
10.75
|
15.29
|
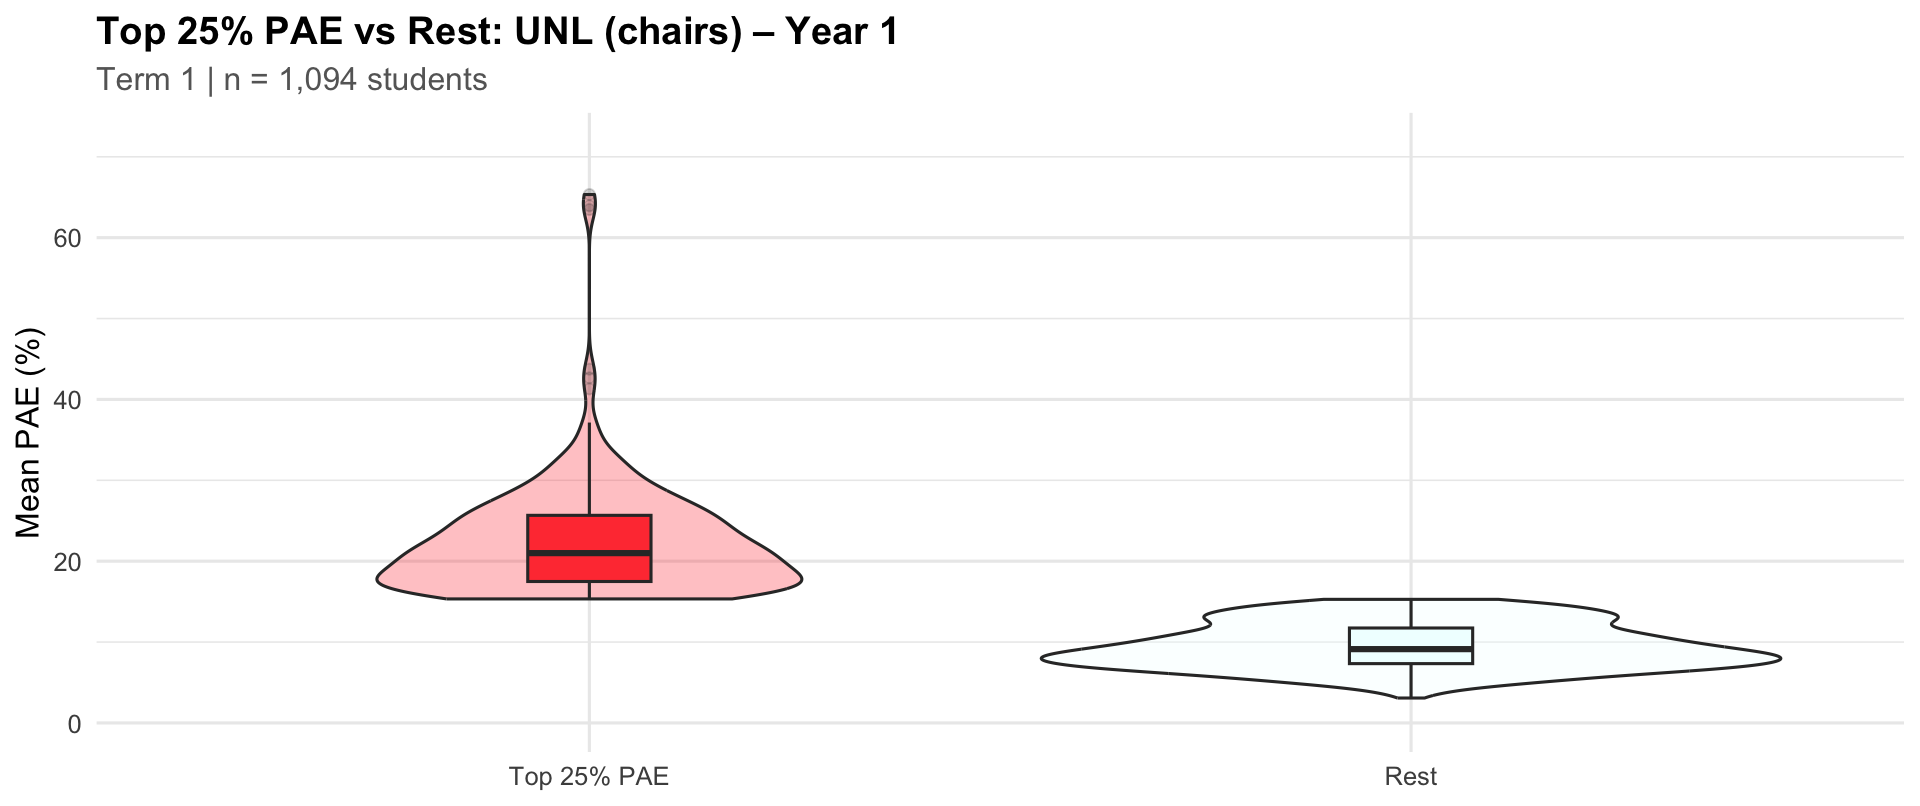
Top quartile (highest PAE) vs rest
|
Group
|
Students
|
25th %ile
|
Median
|
75th %ile
|
|
Top 25% PAE
|
274
|
17.49
|
20.99
|
25.67
|
|
Rest
|
822
|
7.34
|
9.13
|
11.74
|
PAE distribution (per student)
|
Students
|
25th %ile
|
Median
|
75th %ile
|
|
616
|
7.27
|
9.92
|
13.99
|
Top quartile (highest PAE) vs rest
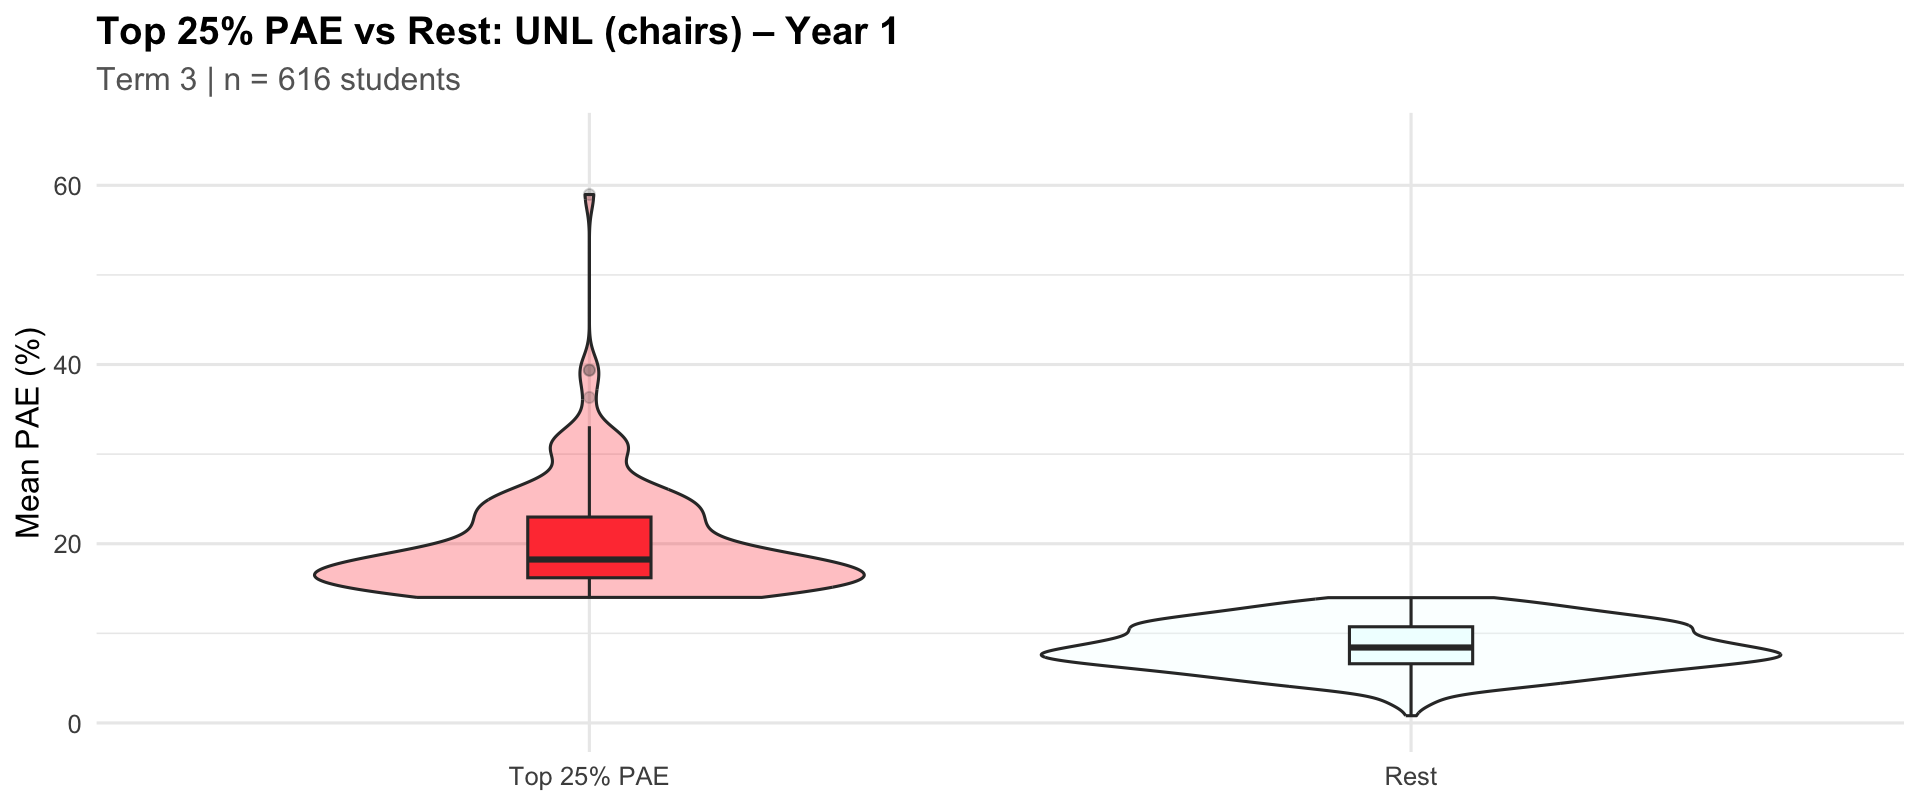
|
Group
|
Students
|
25th %ile
|
Median
|
75th %ile
|
|
Top 25% PAE
|
154
|
16.20
|
18.24
|
22.98
|
|
Rest
|
462
|
6.61
|
8.42
|
10.73
|
PAE distribution (per student)
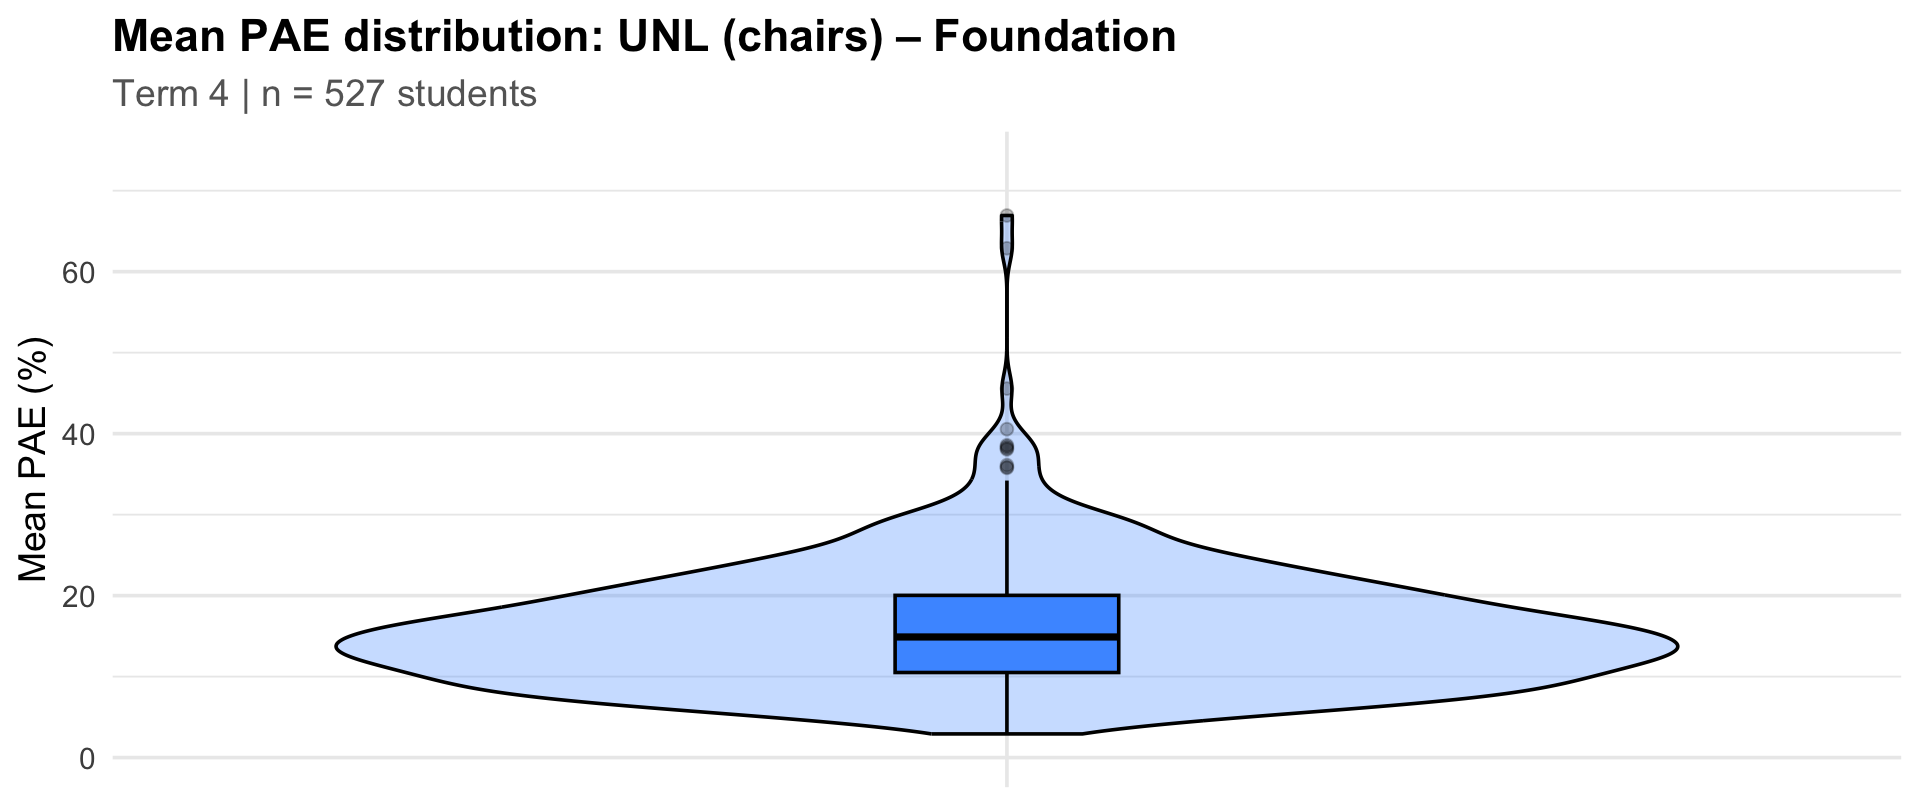
|
Students
|
25th %ile
|
Median
|
75th %ile
|
|
527
|
10.5
|
14.89
|
20.03
|
Top quartile (highest PAE) vs rest
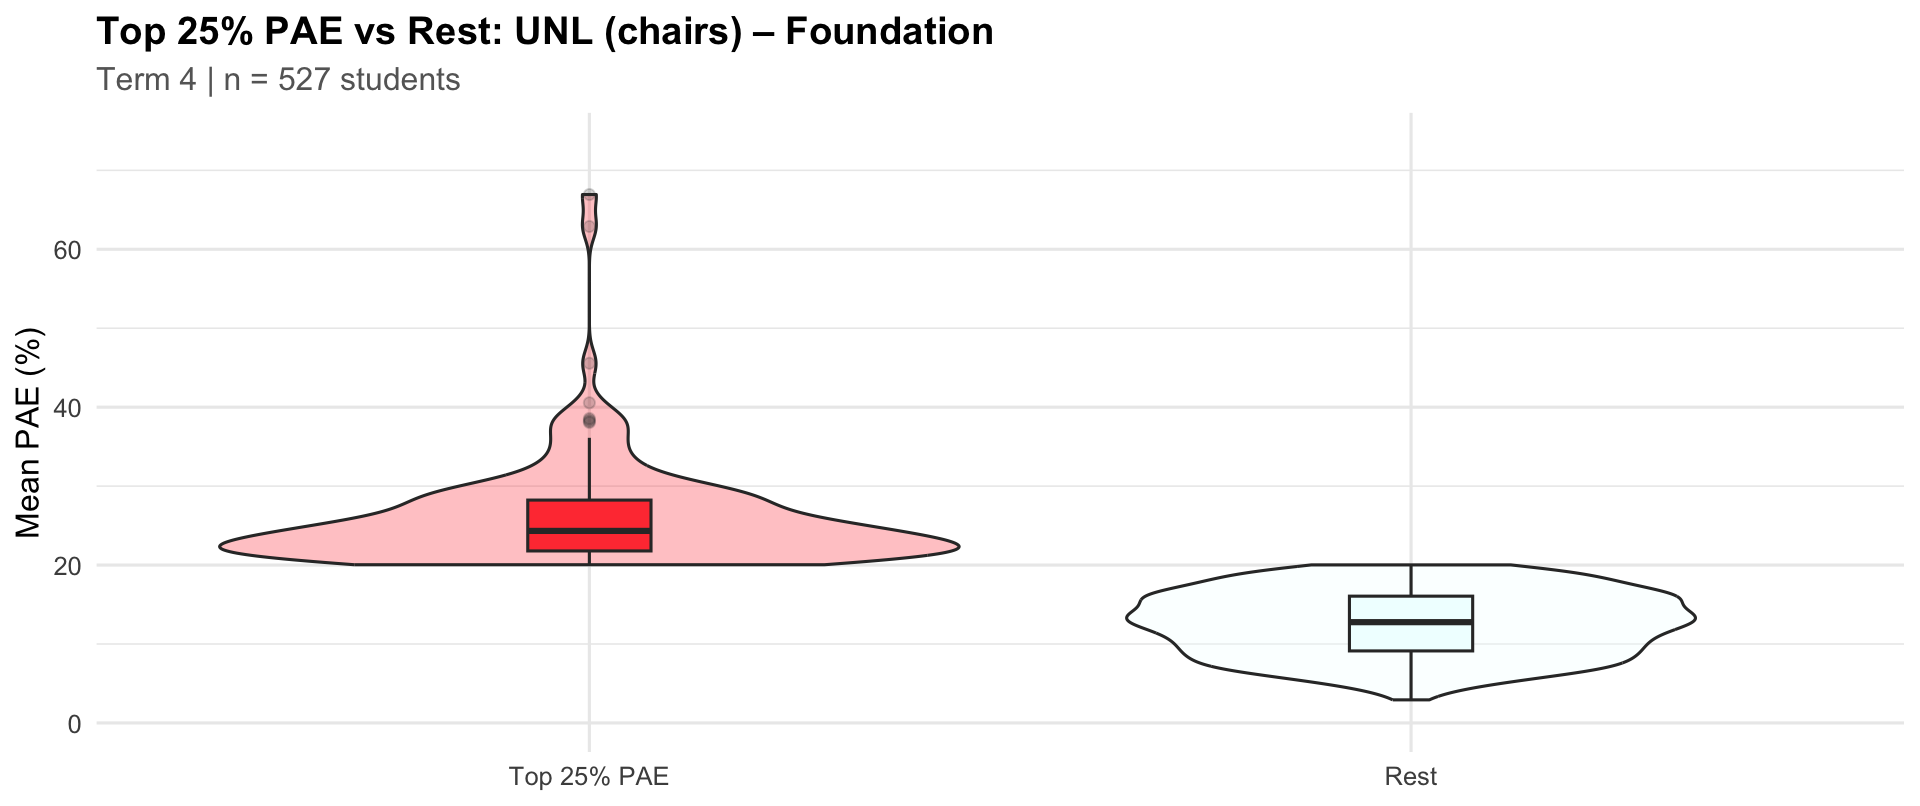
|
Group
|
Students
|
25th %ile
|
Median
|
75th %ile
|
|
Top 25% PAE
|
132
|
21.79
|
24.32
|
28.23
|
|
Rest
|
395
|
9.12
|
12.76
|
16.06
|
PAE distribution (per student)
|
Students
|
25th %ile
|
Median
|
75th %ile
|
|
483
|
7.33
|
10.03
|
13.07
|
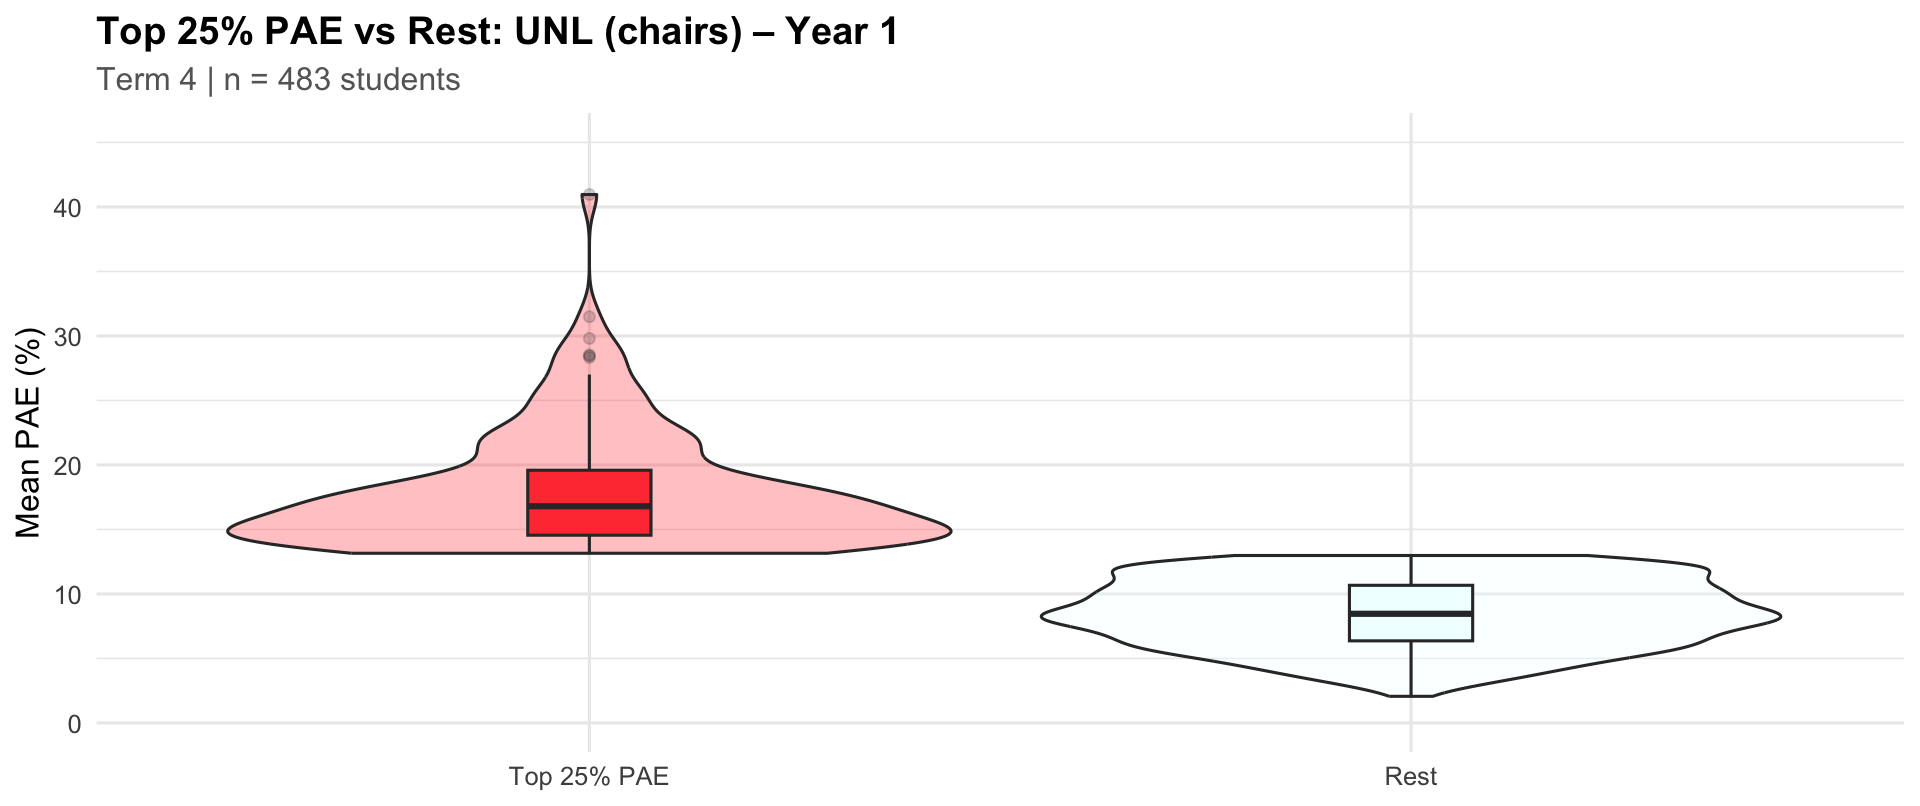
Top quartile (highest PAE) vs rest
|
Group
|
Students
|
25th %ile
|
Median
|
75th %ile
|
|
Top 25% PAE
|
121
|
14.55
|
16.80
|
19.59
|
|
Rest
|
362
|
6.36
|
8.46
|
10.67
|
3.3 Unbounded Number Line – No Chairs
PAE distribution (per student)
|
Students
|
25th %ile
|
Median
|
75th %ile
|
|
1280
|
13.6
|
18.52
|
25.31
|
Top quartile (highest PAE) vs rest

|
Group
|
Students
|
25th %ile
|
Median
|
75th %ile
|
|
Top 25% PAE
|
320
|
27.43
|
30.51
|
36.81
|
|
Rest
|
960
|
12.12
|
15.82
|
19.92
|
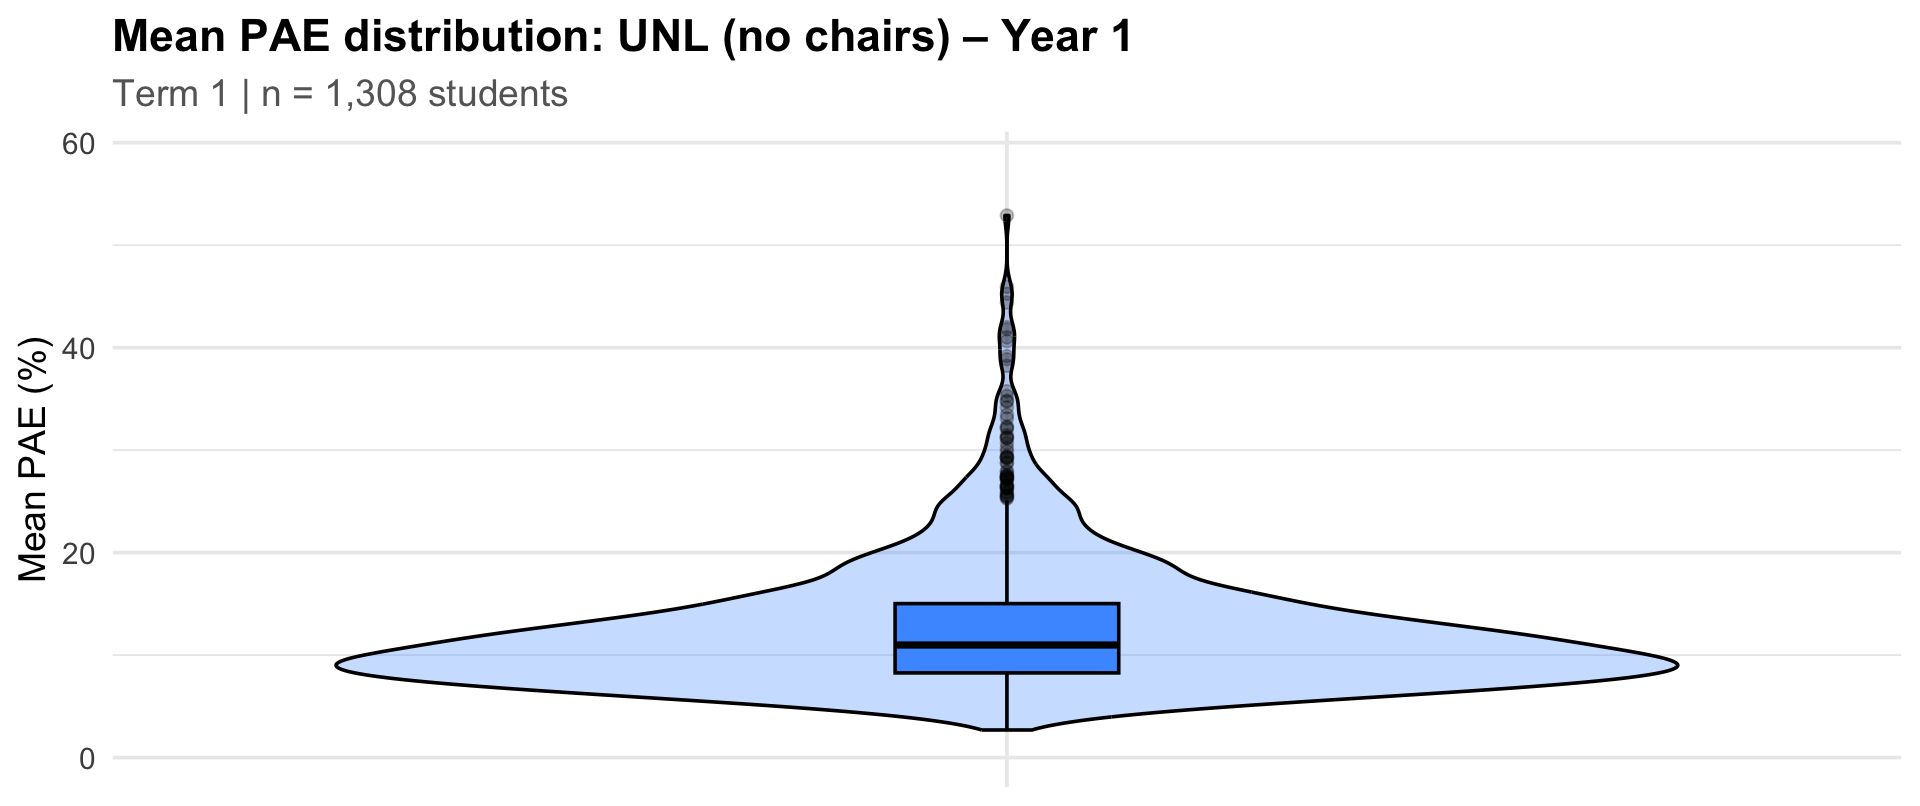
PAE distribution (per student)
|
Students
|
25th %ile
|
Median
|
75th %ile
|
|
1308
|
8.26
|
10.99
|
15.02
|
Top quartile (highest PAE) vs rest
|
Group
|
Students
|
25th %ile
|
Median
|
75th %ile
|
|
Top 25% PAE
|
327
|
16.72
|
19.18
|
23.77
|
|
Rest
|
981
|
7.69
|
9.59
|
11.74
|
PAE distribution (per student)
|
Students
|
25th %ile
|
Median
|
75th %ile
|
|
756
|
10.55
|
15.06
|
21.15
|
Top quartile (highest PAE) vs rest
|
Group
|
Students
|
25th %ile
|
Median
|
75th %ile
|
|
Top 25% PAE
|
189
|
23.61
|
26.16
|
29.46
|
|
Rest
|
567
|
9.22
|
12.41
|
16.13
|
PAE distribution (per student)
|
Students
|
25th %ile
|
Median
|
75th %ile
|
|
872
|
7.1
|
9.45
|
13.2
|
Top quartile (highest PAE) vs rest
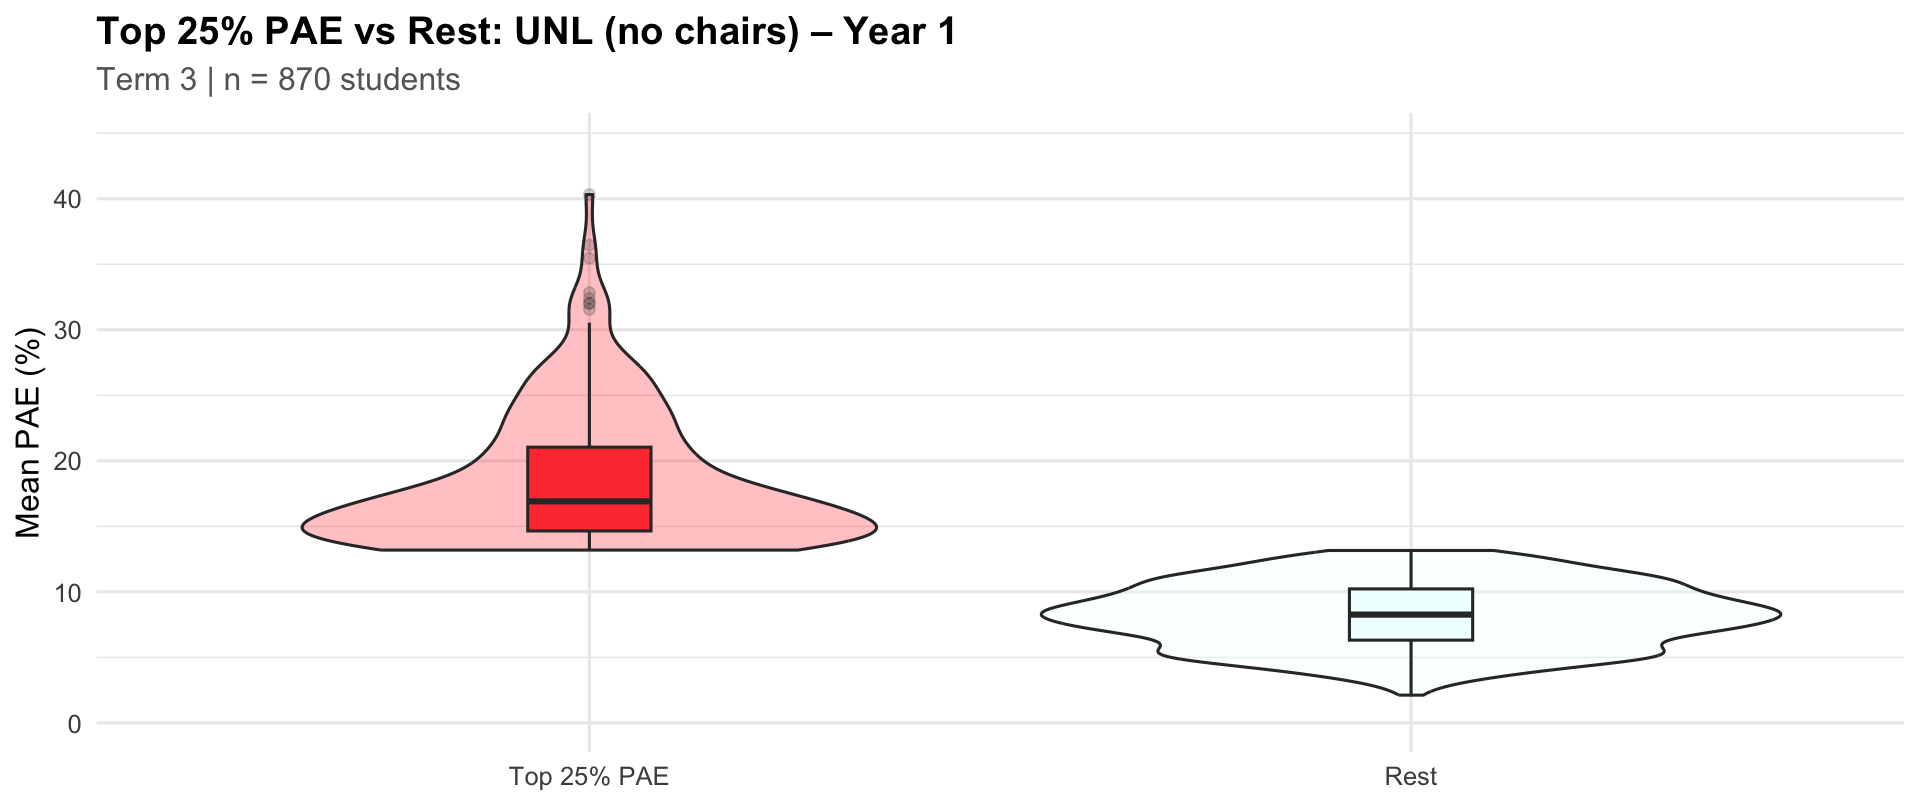
|
Group
|
Students
|
25th %ile
|
Median
|
75th %ile
|
|
Top 25% PAE
|
218
|
14.68
|
17.00
|
21.28
|
|
Rest
|
654
|
6.33
|
8.27
|
10.24
|
PAE distribution (per student)
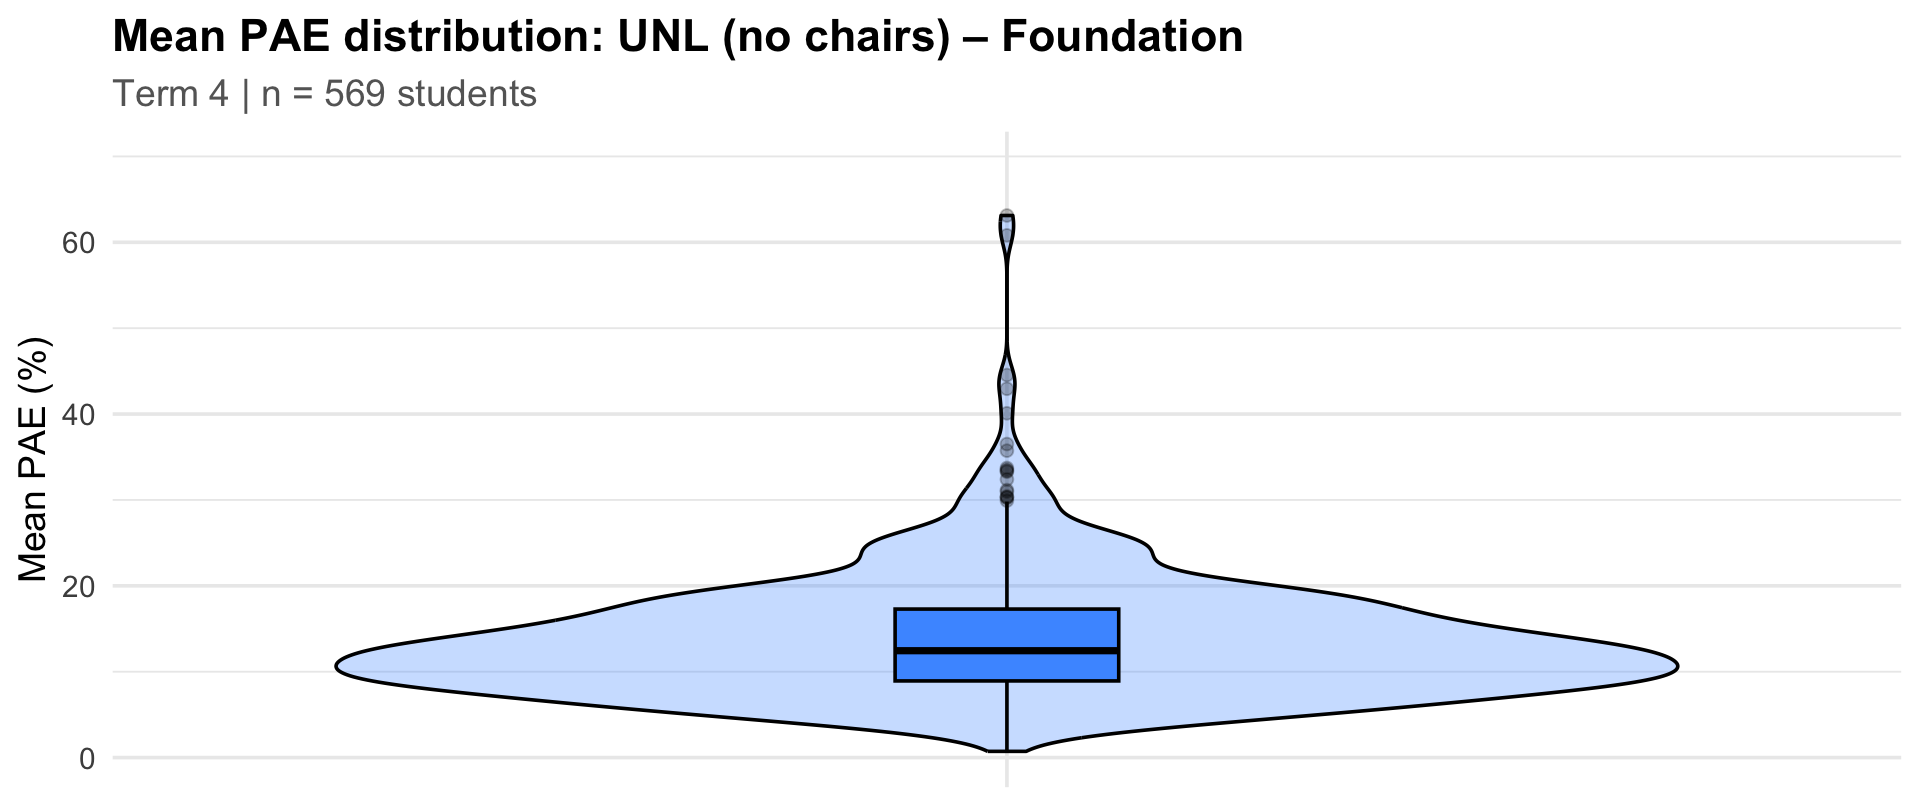
|
Students
|
25th %ile
|
Median
|
75th %ile
|
|
569
|
8.93
|
12.44
|
17.29
|
Top quartile (highest PAE) vs rest
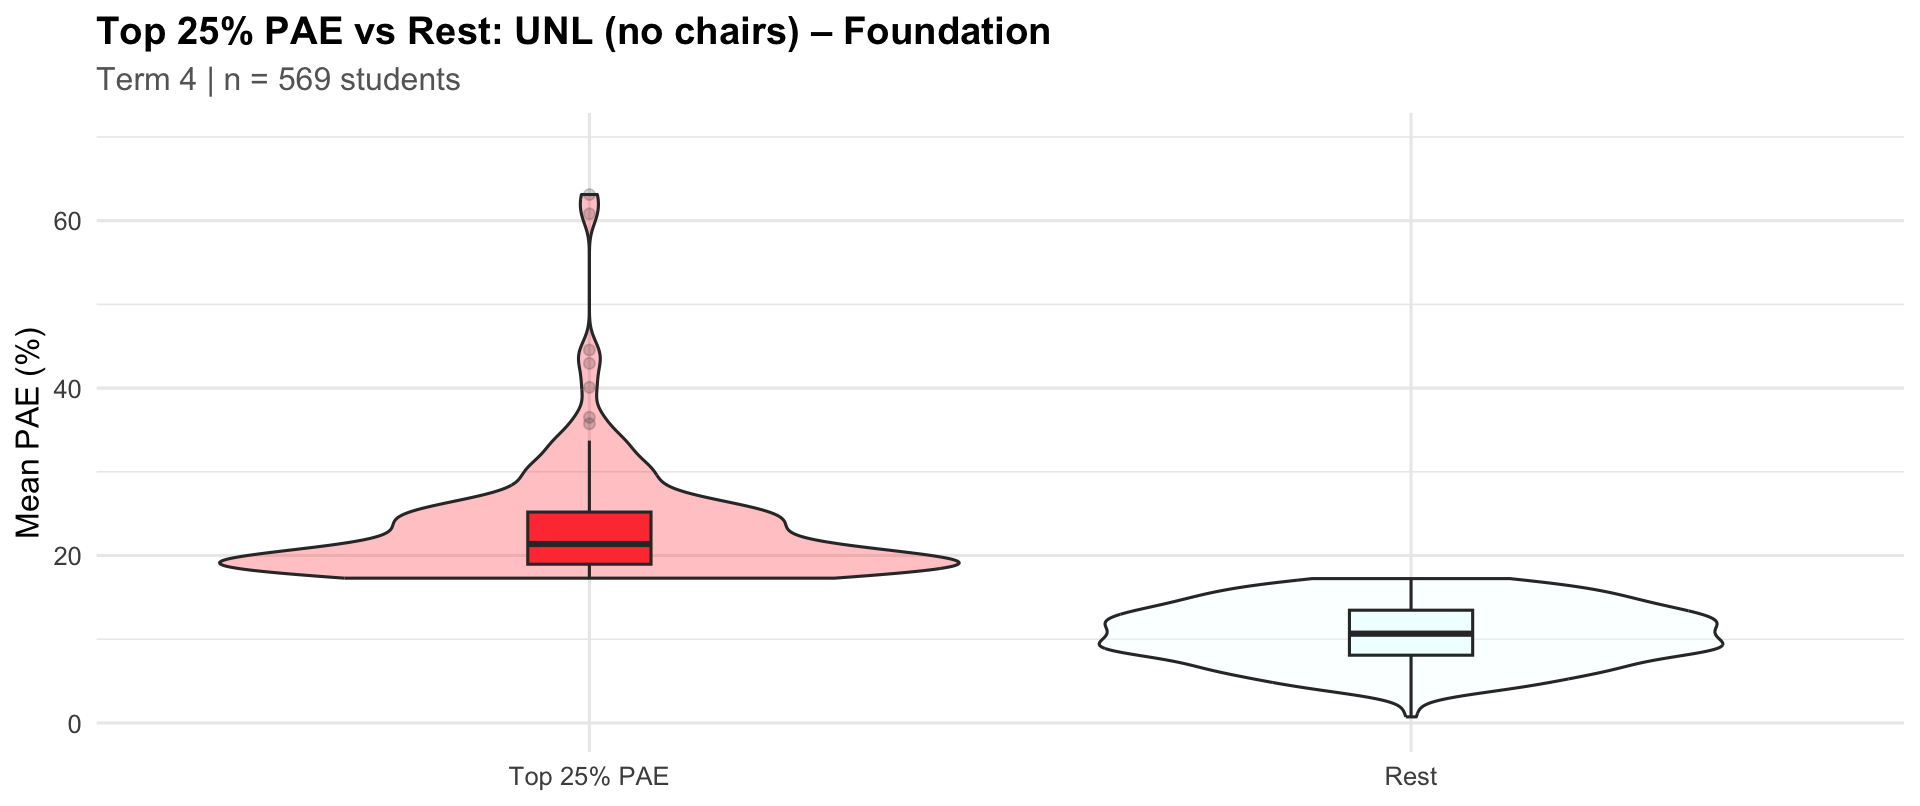
|
Group
|
Students
|
25th %ile
|
Median
|
75th %ile
|
|
Top 25% PAE
|
143
|
18.96
|
21.37
|
25.19
|
|
Rest
|
426
|
8.09
|
10.66
|
13.47
|
PAE distribution (per student)
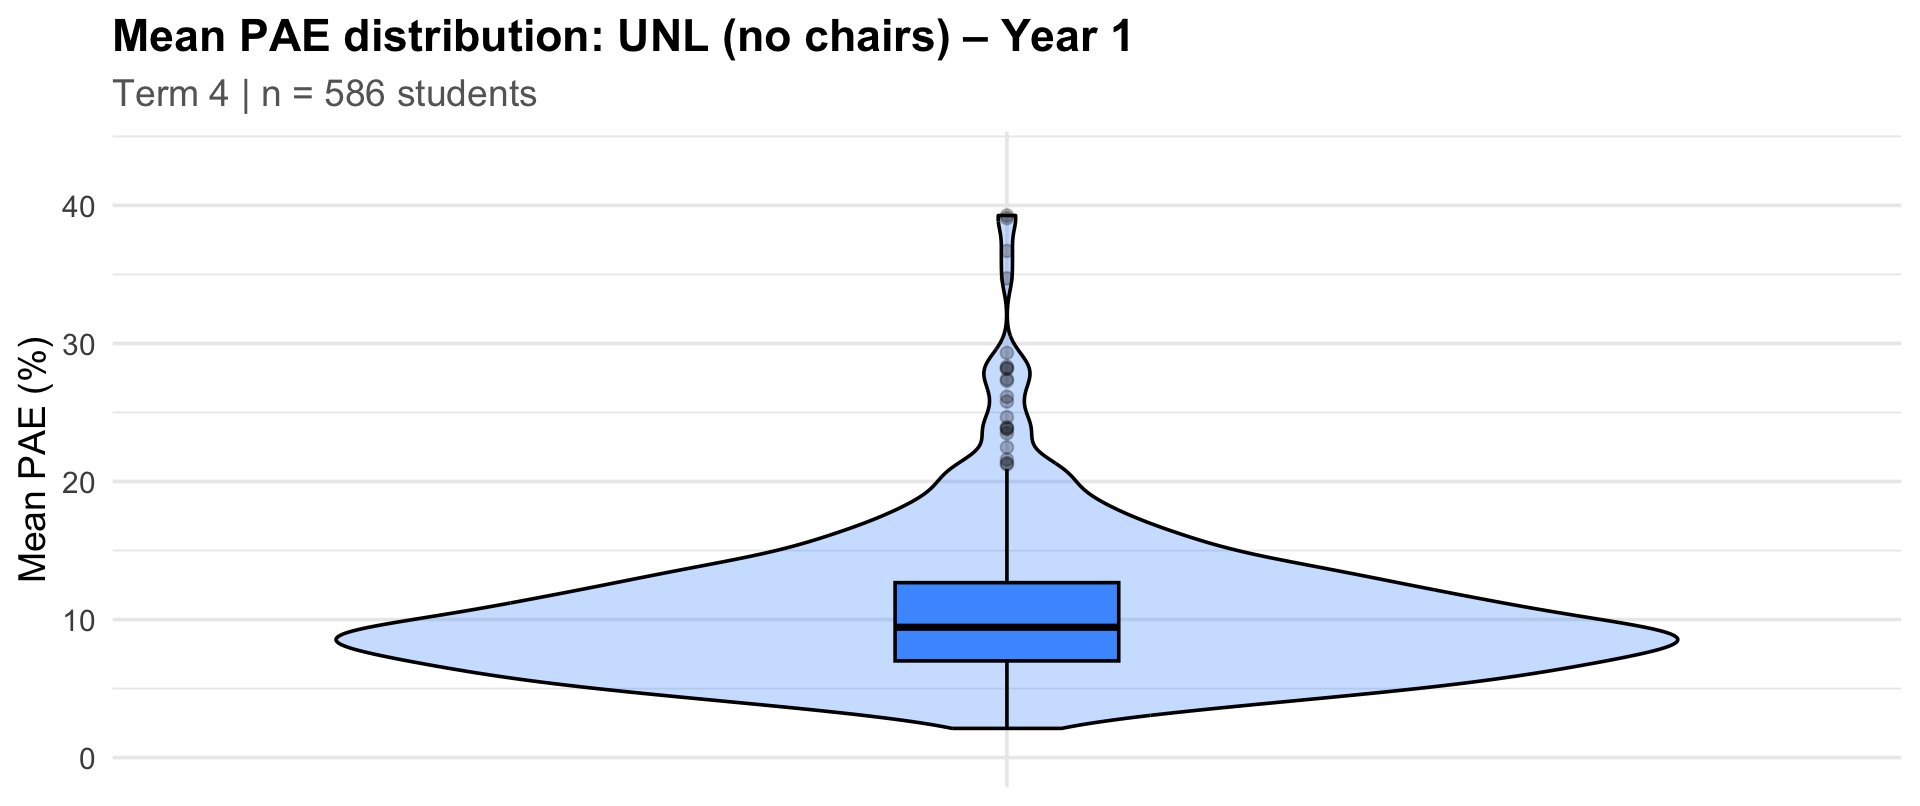
|
Students
|
25th %ile
|
Median
|
75th %ile
|
|
586
|
7
|
9.44
|
12.67
|
Top quartile (highest PAE) vs rest

|
Group
|
Students
|
25th %ile
|
Median
|
75th %ile
|
|
Top 25% PAE
|
147
|
13.87
|
15.65
|
18.61
|
|
Rest
|
439
|
6.25
|
8.28
|
10.05
|
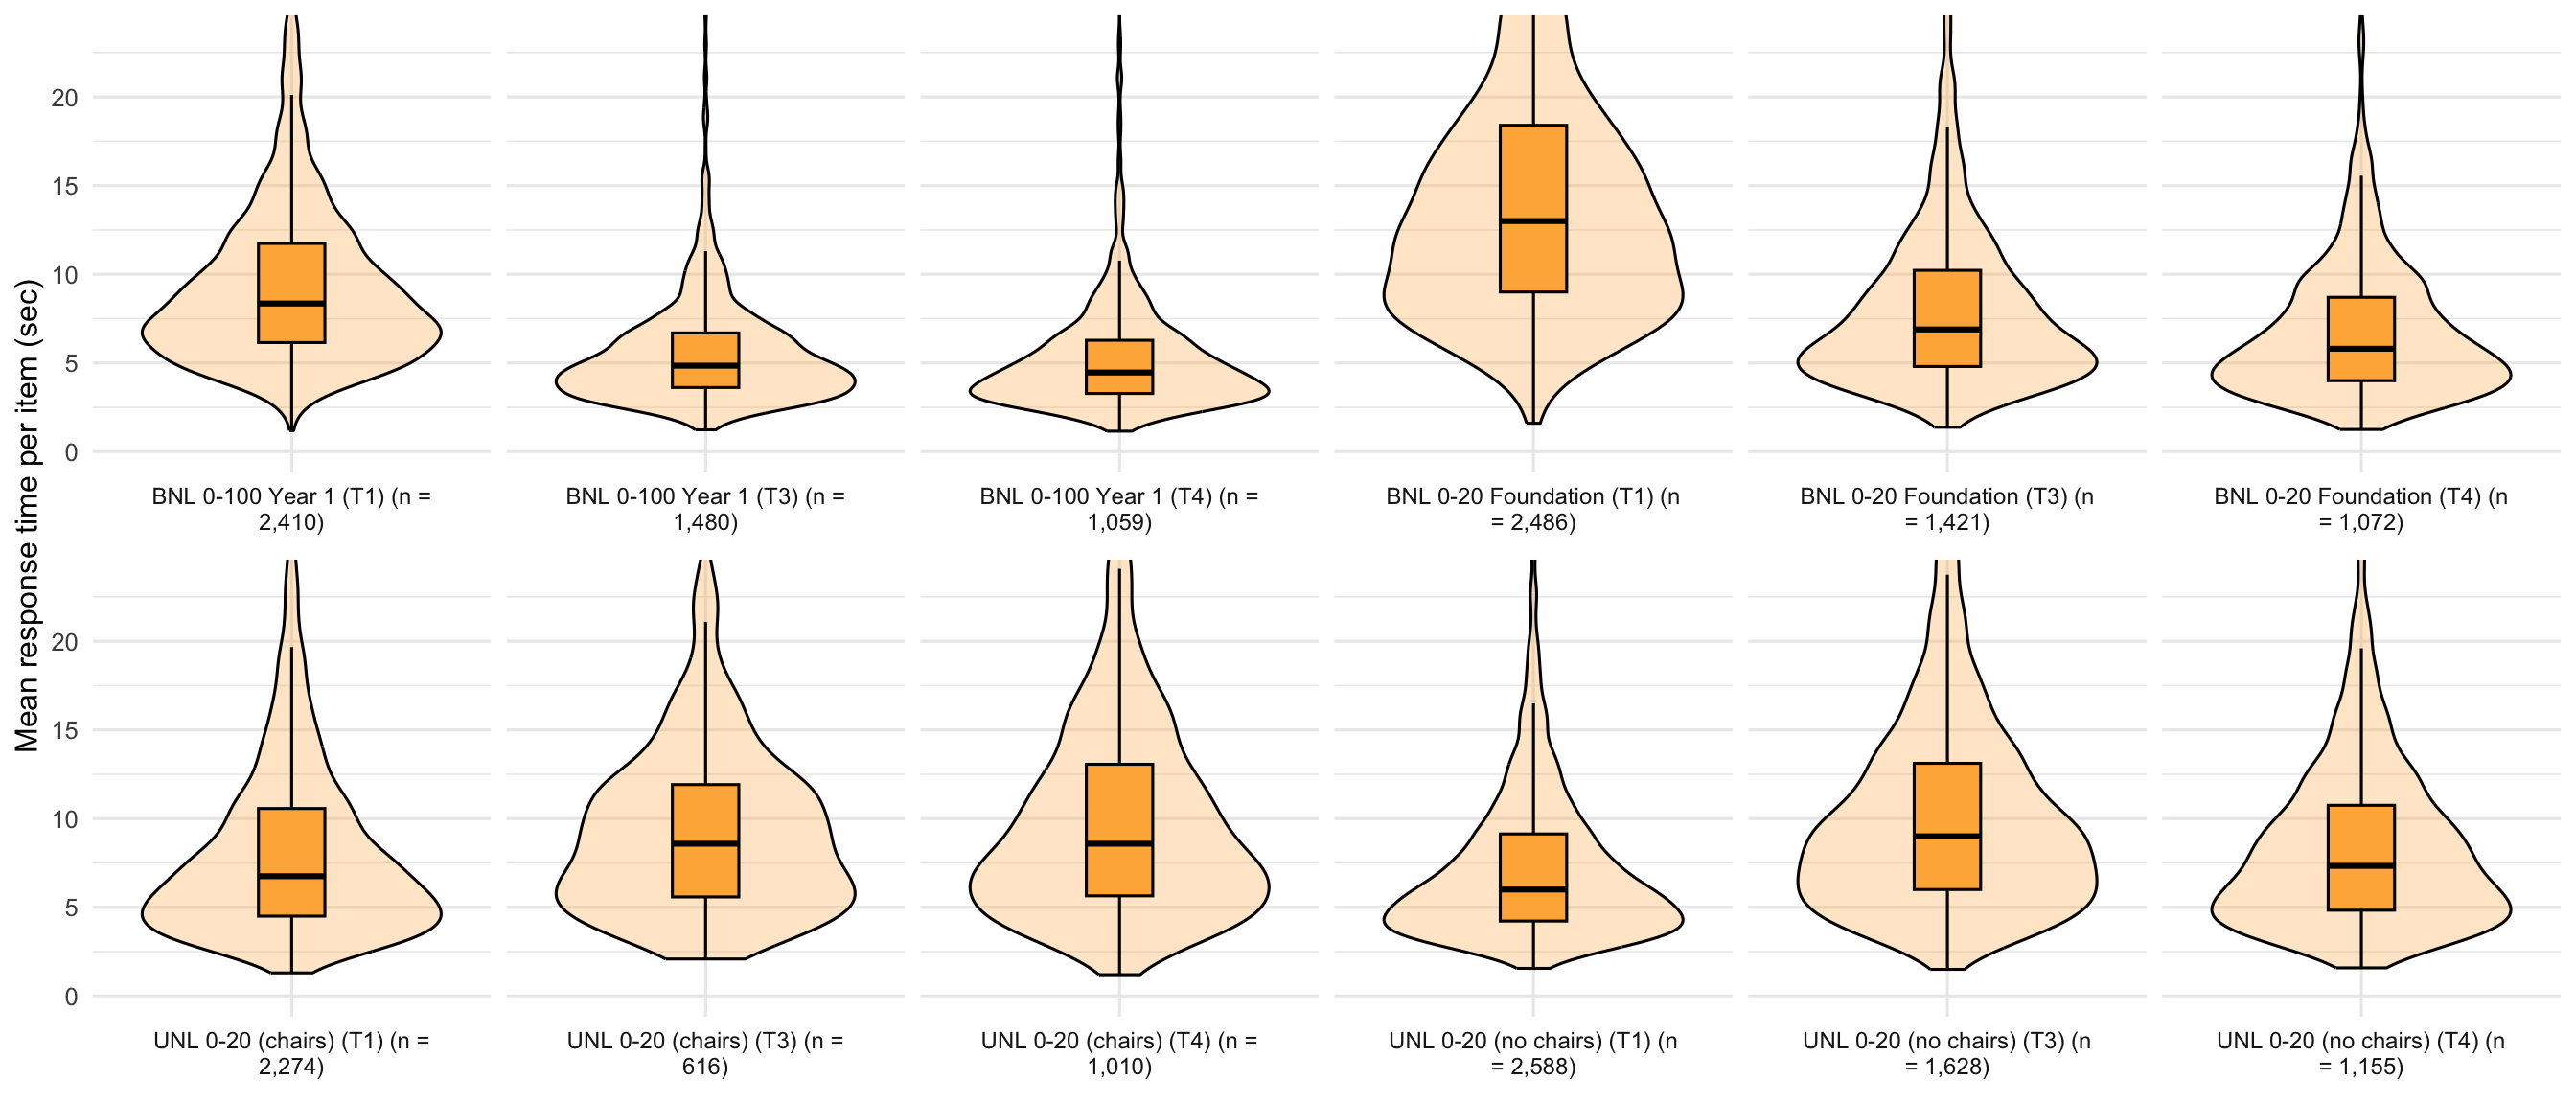
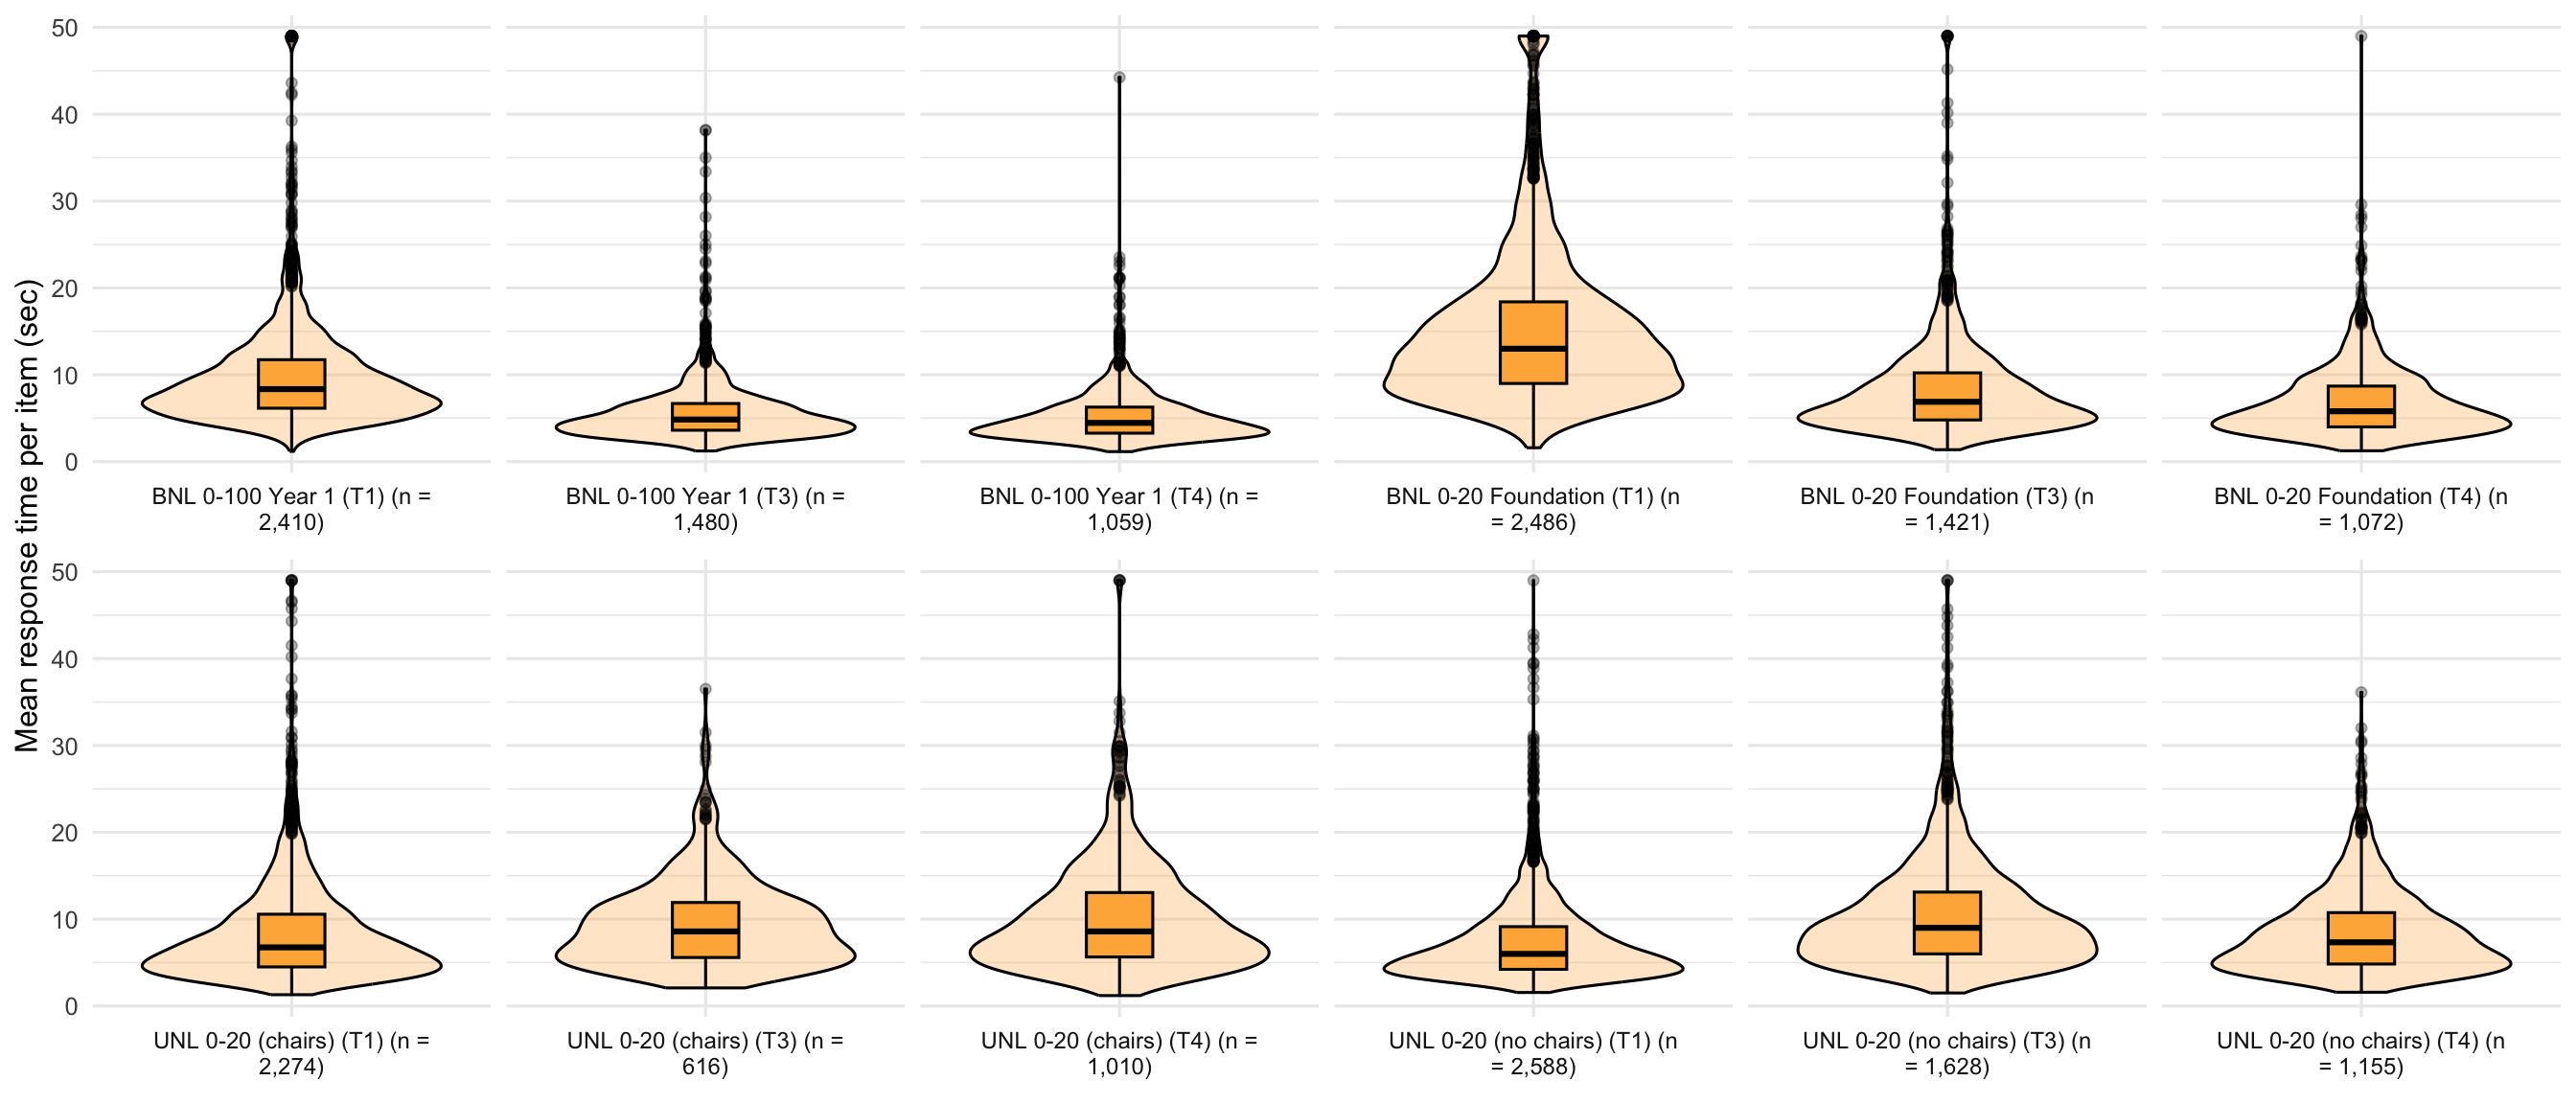
4. Response time distribution
Response times are capped at the 99th percentile across all Number Line probes (49 seconds) to reduce the influence of extreme outliers.
Y-axis truncated at 95th percentile for visibility.
Response times capped at 99th percentile (49 sec).
5. Item statistics
Item discrimination is computed as the Spearman correlation between each item’s score (1 − PAE/100) and the mean score on the remaining items (“rest score”). We correlate pupils’ performance on this item with their performance on the rest of the probe (excluding this item). Spearman uses rank-order, so it is robust to skew and outliers. Higher values mean the item better separates higher- and lower-performing pupils. Students with fewer than 3 valid items are excluded from discrimination calculations.
5.1 Bounded Number Line (BNL)
|
|
|
PAE (%)
|
Response time (sec)
|
|
|
Q#
|
Target
|
N
|
Median PAE
|
Mean PAE
|
SD PAE
|
Median RT
|
95th RT
|
Item discrim.
|
|
1
|
59
|
2336
|
5.78
|
8.60
|
8.74
|
22
|
78.00
|
0.36
|
|
2
|
20
|
2306
|
14.01
|
17.04
|
13.72
|
13
|
47.00
|
0.56
|
|
3
|
46
|
2324
|
7.48
|
10.31
|
9.45
|
10
|
37.85
|
0.33
|
|
4
|
13
|
2336
|
12.99
|
16.66
|
14.37
|
8
|
28.00
|
0.62
|
|
5
|
72
|
2324
|
7.80
|
11.31
|
11.46
|
7
|
28.00
|
0.45
|
|
6
|
31
|
2327
|
9.22
|
12.93
|
12.06
|
7
|
24.00
|
0.46
|
|
7
|
97
|
2345
|
14.08
|
20.11
|
17.43
|
7
|
26.00
|
0.64
|
|
8
|
85
|
2328
|
14.38
|
16.88
|
13.32
|
6
|
21.00
|
0.50
|
|
9
|
68
|
2320
|
10.08
|
12.87
|
11.19
|
6
|
20.00
|
0.36
|
|
10
|
4
|
2359
|
6.10
|
9.06
|
12.06
|
6
|
17.00
|
0.54
|
|
11
|
13
|
2312
|
14.50
|
17.83
|
14.51
|
5
|
18.00
|
0.58
|
|
12
|
68
|
2310
|
9.52
|
12.67
|
11.29
|
5
|
17.00
|
0.34
|
|
13
|
85
|
2296
|
12.82
|
17.08
|
15.02
|
5
|
16.00
|
0.55
|
|
14
|
31
|
2301
|
9.68
|
13.31
|
12.11
|
5
|
15.00
|
0.41
|
|
15
|
72
|
2293
|
8.89
|
12.73
|
12.04
|
5
|
15.00
|
0.42
|
|
16
|
97
|
2287
|
13.59
|
19.92
|
17.91
|
5
|
16.00
|
0.66
|
|
17
|
20
|
2320
|
12.32
|
16.53
|
14.97
|
4
|
15.00
|
0.61
|
|
18
|
59
|
2318
|
7.64
|
10.63
|
9.58
|
5
|
16.00
|
0.31
|
|
19
|
4
|
2351
|
6.57
|
9.87
|
12.75
|
4
|
12.00
|
0.52
|
|
20
|
46
|
2316
|
10.16
|
12.50
|
10.10
|
5
|
17.00
|
0.15
|
|
|
|
PAE (%)
|
Response time (sec)
|
|
|
Q#
|
Target
|
N
|
Median PAE
|
Mean PAE
|
SD PAE
|
Median RT
|
95th RT
|
Item discrim.
|
|
1
|
2
|
2346
|
4.42
|
10.89
|
16.89
|
22
|
81.75
|
0.33
|
|
2
|
5
|
2189
|
10.00
|
12.51
|
12.14
|
15
|
47.00
|
0.43
|
|
3
|
16
|
2264
|
15.22
|
20.91
|
18.39
|
15
|
52.00
|
0.47
|
|
4
|
9
|
2310
|
11.15
|
14.92
|
12.62
|
11
|
38.00
|
0.32
|
|
5
|
13
|
2314
|
14.07
|
17.17
|
13.73
|
10
|
39.00
|
0.42
|
|
6
|
7
|
2331
|
11.75
|
14.27
|
12.30
|
8
|
28.00
|
0.43
|
|
7
|
4
|
2347
|
8.11
|
12.20
|
13.70
|
7
|
23.00
|
0.43
|
|
8
|
19
|
2328
|
17.32
|
25.04
|
24.16
|
8
|
33.00
|
0.54
|
|
9
|
18
|
2291
|
13.60
|
22.38
|
22.58
|
7
|
25.00
|
0.55
|
|
10
|
11
|
2315
|
12.95
|
16.20
|
13.33
|
7
|
24.00
|
0.32
|
|
|
|
PAE (%)
|
Response time (sec)
|
|
|
Q#
|
Target
|
N
|
Median PAE
|
Mean PAE
|
SD PAE
|
Median RT
|
95th RT
|
Item discrim.
|
|
1
|
59
|
1457
|
6.95
|
9.22
|
8.54
|
8
|
33.20
|
0.30
|
|
2
|
20
|
1444
|
12.72
|
15.33
|
12.84
|
4
|
17.85
|
0.55
|
|
3
|
46
|
1438
|
7.52
|
10.17
|
9.51
|
4
|
17.00
|
0.27
|
|
4
|
13
|
1439
|
11.53
|
15.31
|
14.55
|
4
|
14.00
|
0.60
|
|
5
|
72
|
1444
|
8.26
|
11.28
|
11.01
|
4
|
14.00
|
0.35
|
|
6
|
34
|
1436
|
8.13
|
11.32
|
10.80
|
4
|
14.00
|
0.41
|
|
7
|
91
|
1445
|
14.55
|
20.49
|
19.12
|
4
|
13.00
|
0.50
|
|
8
|
85
|
1439
|
17.04
|
19.19
|
12.91
|
4
|
12.00
|
0.38
|
|
9
|
68
|
1430
|
12.82
|
15.02
|
11.01
|
4
|
12.00
|
0.24
|
|
10
|
7
|
1450
|
8.65
|
12.31
|
13.39
|
3
|
9.00
|
0.57
|
|
11
|
41
|
1437
|
7.79
|
10.64
|
9.77
|
3
|
11.00
|
0.27
|
|
12
|
17
|
1422
|
11.94
|
15.72
|
13.85
|
3
|
10.00
|
0.57
|
|
13
|
24
|
1436
|
13.65
|
16.43
|
12.96
|
3
|
10.00
|
0.53
|
|
|
|
PAE (%)
|
Response time (sec)
|
|
|
Q#
|
Target
|
N
|
Median PAE
|
Mean PAE
|
SD PAE
|
Median RT
|
95th RT
|
Item discrim.
|
|
1
|
2
|
1377
|
3.32
|
5.91
|
13.17
|
9
|
31.0
|
0.23
|
|
2
|
5
|
1289
|
8.53
|
10.66
|
11.61
|
6
|
21.0
|
0.30
|
|
3
|
16
|
1357
|
12.83
|
17.44
|
15.51
|
6
|
27.0
|
0.32
|
|
4
|
9
|
1345
|
12.67
|
14.92
|
12.02
|
6
|
21.0
|
0.38
|
|
5
|
13
|
1340
|
13.57
|
16.40
|
12.52
|
5
|
22.0
|
0.39
|
|
6
|
7
|
1349
|
10.58
|
13.23
|
11.76
|
5
|
15.0
|
0.40
|
|
7
|
4
|
1359
|
7.31
|
10.41
|
13.06
|
4
|
15.0
|
0.36
|
|
8
|
19
|
1352
|
4.16
|
15.69
|
21.57
|
5
|
25.0
|
0.39
|
|
9
|
18
|
1324
|
5.23
|
14.71
|
18.74
|
4
|
18.0
|
0.42
|
|
10
|
11
|
1345
|
12.80
|
15.42
|
12.17
|
4
|
15.8
|
0.37
|
|
|
|
PAE (%)
|
Response time (sec)
|
|
|
Q#
|
Target
|
N
|
Median PAE
|
Mean PAE
|
SD PAE
|
Median RT
|
95th RT
|
Item discrim.
|
|
1
|
59
|
1042
|
6.12
|
8.59
|
8.49
|
7.0
|
29
|
0.29
|
|
2
|
20
|
1033
|
12.34
|
15.10
|
12.59
|
4.0
|
16
|
0.53
|
|
3
|
46
|
1035
|
6.99
|
9.68
|
9.06
|
4.0
|
16
|
0.19
|
|
4
|
13
|
1035
|
11.24
|
14.36
|
13.19
|
3.0
|
13
|
0.59
|
|
5
|
72
|
1036
|
6.85
|
10.24
|
10.10
|
4.0
|
14
|
0.36
|
|
6
|
34
|
1040
|
7.76
|
10.66
|
10.30
|
4.0
|
12
|
0.36
|
|
7
|
91
|
1043
|
13.55
|
19.17
|
18.18
|
4.0
|
13
|
0.49
|
|
8
|
85
|
1039
|
16.68
|
18.95
|
12.78
|
4.0
|
12
|
0.38
|
|
9
|
68
|
1022
|
12.09
|
14.20
|
10.22
|
3.5
|
11
|
0.27
|
|
10
|
7
|
1033
|
8.65
|
11.10
|
11.66
|
3.0
|
9
|
0.52
|
|
11
|
41
|
1035
|
7.54
|
9.88
|
9.28
|
3.0
|
11
|
0.23
|
|
12
|
17
|
1026
|
11.42
|
15.06
|
13.38
|
3.0
|
11
|
0.57
|
|
13
|
24
|
1026
|
13.02
|
15.19
|
12.05
|
3.0
|
10
|
0.52
|
|
|
|
PAE (%)
|
Response time (sec)
|
|
|
Q#
|
Target
|
N
|
Median PAE
|
Mean PAE
|
SD PAE
|
Median RT
|
95th RT
|
Item discrim.
|
|
1
|
2
|
1044
|
3.50
|
5.89
|
12.89
|
7
|
22.00
|
0.22
|
|
2
|
5
|
983
|
8.21
|
10.14
|
11.20
|
5
|
16.00
|
0.29
|
|
3
|
16
|
1023
|
12.38
|
17.49
|
15.86
|
6
|
22.00
|
0.41
|
|
4
|
9
|
1021
|
11.94
|
14.15
|
11.17
|
5
|
17.00
|
0.43
|
|
5
|
13
|
1027
|
13.75
|
16.02
|
11.91
|
5
|
19.70
|
0.41
|
|
6
|
7
|
1012
|
10.22
|
12.35
|
10.55
|
4
|
14.45
|
0.40
|
|
7
|
4
|
1031
|
7.40
|
9.84
|
11.59
|
4
|
11.00
|
0.35
|
|
8
|
19
|
1017
|
3.64
|
14.91
|
22.25
|
5
|
26.20
|
0.44
|
|
9
|
18
|
987
|
4.63
|
13.59
|
18.28
|
4
|
17.00
|
0.47
|
|
10
|
11
|
1013
|
11.93
|
14.39
|
11.60
|
4
|
14.00
|
0.39
|
5.2 Unbounded Number Line – Chairs
|
|
|
PAE (%)
|
Response time (sec)
|
|
|
Q#
|
Target
|
N
|
Median PAE
|
Mean PAE
|
SD PAE
|
Median RT
|
95th RT
|
Item discrim.
|
|
1
|
5
|
1133
|
5.86
|
11.70
|
16.27
|
15
|
49.0
|
0.40
|
|
2
|
16
|
1095
|
20.24
|
22.31
|
14.56
|
10
|
37.3
|
0.32
|
|
3
|
9
|
1115
|
16.53
|
20.97
|
17.79
|
7
|
26.3
|
0.56
|
|
4
|
13
|
1107
|
25.19
|
26.73
|
16.94
|
7
|
28.0
|
0.45
|
|
5
|
2
|
1105
|
2.87
|
10.02
|
19.61
|
5
|
19.0
|
0.26
|
|
6
|
7
|
1110
|
13.03
|
17.92
|
17.64
|
6
|
23.0
|
0.53
|
|
7
|
4
|
1112
|
6.54
|
13.11
|
17.62
|
5
|
19.0
|
0.40
|
|
8
|
19
|
1092
|
28.99
|
26.33
|
13.94
|
6
|
25.0
|
0.20
|
|
9
|
18
|
1073
|
26.46
|
25.57
|
14.00
|
5
|
23.4
|
0.23
|
|
10
|
11
|
1092
|
23.26
|
25.28
|
17.43
|
5
|
19.0
|
0.43
|
|
|
|
PAE (%)
|
Response time (sec)
|
|
|
Q#
|
Target
|
N
|
Median PAE
|
Mean PAE
|
SD PAE
|
Median RT
|
95th RT
|
Item discrim.
|
|
1
|
5
|
1069
|
4.55
|
7.22
|
10.21
|
10
|
31.00
|
0.30
|
|
2
|
16
|
1057
|
12.92
|
15.28
|
11.70
|
8
|
32.00
|
0.29
|
|
3
|
9
|
1055
|
7.47
|
10.58
|
11.47
|
6
|
20.00
|
0.47
|
|
4
|
13
|
1047
|
10.10
|
14.15
|
13.36
|
5
|
20.00
|
0.52
|
|
5
|
2
|
1059
|
1.82
|
4.86
|
12.16
|
4
|
13.00
|
0.19
|
|
6
|
7
|
1052
|
6.28
|
9.48
|
11.51
|
5
|
15.00
|
0.47
|
|
7
|
4
|
1053
|
4.24
|
7.00
|
10.01
|
4
|
14.00
|
0.37
|
|
8
|
19
|
1064
|
18.28
|
19.76
|
12.35
|
5
|
23.85
|
0.37
|
|
9
|
18
|
1049
|
17.88
|
18.72
|
11.40
|
4
|
17.00
|
0.38
|
|
10
|
10
|
1053
|
10.10
|
14.02
|
12.98
|
4
|
16.00
|
0.52
|
|
11
|
7
|
1052
|
7.68
|
11.33
|
12.71
|
4
|
12.00
|
0.51
|
|
12
|
19
|
1050
|
17.63
|
19.14
|
12.29
|
3
|
17.00
|
0.41
|
|
13
|
4
|
1054
|
4.85
|
9.25
|
13.36
|
3
|
10.00
|
0.36
|
|
14
|
9
|
1040
|
8.65
|
12.91
|
13.46
|
3
|
12.00
|
0.51
|
|
15
|
13
|
1047
|
10.43
|
14.06
|
12.67
|
3
|
14.00
|
0.49
|
|
16
|
5
|
1043
|
6.77
|
10.45
|
11.94
|
3
|
10.00
|
0.33
|
|
17
|
2
|
1050
|
2.12
|
6.48
|
13.25
|
3
|
9.00
|
0.28
|
|
18
|
16
|
1043
|
13.84
|
16.32
|
11.75
|
3
|
15.00
|
0.39
|
|
19
|
11
|
1036
|
10.68
|
13.67
|
12.19
|
3
|
12.00
|
0.50
|
|
20
|
18
|
1043
|
15.15
|
17.07
|
12.08
|
3
|
14.90
|
0.35
|
|
|
|
PAE (%)
|
Response time (sec)
|
|
|
Q#
|
Target
|
N
|
Median PAE
|
Mean PAE
|
SD PAE
|
Median RT
|
95th RT
|
Item discrim.
|
|
1
|
3
|
597
|
1.87
|
3.11
|
5.88
|
13
|
50.20
|
0.26
|
|
2
|
5
|
581
|
3.83
|
5.43
|
5.81
|
9
|
26.00
|
0.39
|
|
3
|
16
|
589
|
13.71
|
16.05
|
11.70
|
12
|
36.60
|
0.49
|
|
4
|
9
|
592
|
7.66
|
10.37
|
10.23
|
8
|
22.00
|
0.54
|
|
5
|
13
|
599
|
10.48
|
13.64
|
11.61
|
8
|
25.00
|
0.57
|
|
6
|
7
|
597
|
6.45
|
8.79
|
8.83
|
6
|
19.00
|
0.51
|
|
7
|
4
|
599
|
3.94
|
5.59
|
7.04
|
5
|
15.00
|
0.32
|
|
8
|
19
|
597
|
19.35
|
20.18
|
12.58
|
6
|
25.00
|
0.51
|
|
9
|
18
|
598
|
18.55
|
18.79
|
10.77
|
4
|
22.15
|
0.44
|
|
10
|
11
|
603
|
10.38
|
13.25
|
11.10
|
5
|
17.90
|
0.51
|
|
11
|
6
|
598
|
6.81
|
8.95
|
8.73
|
5
|
12.00
|
0.38
|
|
12
|
10
|
595
|
9.98
|
12.62
|
10.71
|
4
|
13.00
|
0.49
|
|
|
|
PAE (%)
|
Response time (sec)
|
|
|
Q#
|
Target
|
N
|
Median PAE
|
Mean PAE
|
SD PAE
|
Median RT
|
95th RT
|
Item discrim.
|
|
1
|
3
|
499
|
3.12
|
5.23
|
9.59
|
14
|
46.00
|
0.27
|
|
2
|
5
|
482
|
6.55
|
8.42
|
9.08
|
10
|
31.95
|
0.41
|
|
3
|
16
|
496
|
16.09
|
18.84
|
13.32
|
12
|
35.00
|
0.52
|
|
4
|
9
|
498
|
11.69
|
15.17
|
12.74
|
8
|
25.00
|
0.57
|
|
5
|
13
|
503
|
16.83
|
19.31
|
13.92
|
8
|
30.80
|
0.60
|
|
6
|
7
|
504
|
11.58
|
14.16
|
11.73
|
6
|
20.00
|
0.55
|
|
7
|
4
|
507
|
6.18
|
9.44
|
11.12
|
5
|
18.00
|
0.40
|
|
8
|
19
|
507
|
27.82
|
24.85
|
11.95
|
7
|
30.70
|
0.44
|
|
9
|
18
|
511
|
23.49
|
22.37
|
12.12
|
6
|
25.00
|
0.40
|
|
10
|
11
|
504
|
17.83
|
20.30
|
13.95
|
5
|
18.00
|
0.52
|
|
|
|
PAE (%)
|
Response time (sec)
|
|
|
Q#
|
Target
|
N
|
Median PAE
|
Mean PAE
|
SD PAE
|
Median RT
|
95th RT
|
Item discrim.
|
|
1
|
3
|
469
|
1.81
|
2.95
|
4.82
|
10
|
48.60
|
0.24
|
|
2
|
5
|
450
|
3.73
|
5.11
|
4.84
|
9
|
26.00
|
0.39
|
|
3
|
16
|
466
|
12.70
|
15.03
|
10.64
|
11
|
35.50
|
0.39
|
|
4
|
9
|
472
|
7.66
|
9.80
|
9.42
|
8
|
22.00
|
0.61
|
|
5
|
13
|
474
|
10.08
|
12.67
|
10.51
|
8
|
23.00
|
0.55
|
|
6
|
7
|
466
|
6.15
|
7.96
|
7.94
|
6
|
16.00
|
0.43
|
|
7
|
4
|
468
|
3.03
|
4.84
|
5.41
|
5
|
14.00
|
0.30
|
|
8
|
19
|
472
|
20.43
|
20.44
|
11.19
|
6
|
24.00
|
0.48
|
|
9
|
18
|
472
|
19.27
|
19.06
|
10.65
|
4
|
20.45
|
0.45
|
|
10
|
11
|
477
|
10.18
|
12.14
|
10.00
|
4
|
17.00
|
0.53
|
|
11
|
6
|
473
|
6.25
|
8.44
|
9.40
|
4
|
12.00
|
0.32
|
|
12
|
10
|
474
|
9.37
|
11.59
|
9.84
|
4
|
13.00
|
0.44
|
5.3 Unbounded Number Line – No Chairs
|
|
|
PAE (%)
|
Response time (sec)
|
|
|
Q#
|
Target
|
N
|
Median PAE
|
Mean PAE
|
SD PAE
|
Median RT
|
95th RT
|
Item discrim.
|
|
1
|
5
|
1245
|
6.15
|
12.14
|
17.07
|
12
|
40.80
|
0.42
|
|
2
|
16
|
1184
|
23.29
|
24.58
|
14.77
|
8
|
32.85
|
0.36
|
|
3
|
9
|
1213
|
17.24
|
21.93
|
18.35
|
7
|
23.00
|
0.53
|
|
4
|
13
|
1194
|
25.99
|
27.06
|
16.56
|
6
|
25.00
|
0.43
|
|
5
|
2
|
1213
|
1.92
|
9.82
|
21.47
|
5
|
16.00
|
0.27
|
|
6
|
7
|
1192
|
11.89
|
17.51
|
17.70
|
5
|
17.45
|
0.55
|
|
7
|
4
|
1192
|
5.69
|
12.48
|
18.55
|
5
|
15.00
|
0.39
|
|
8
|
19
|
1177
|
28.76
|
25.85
|
14.31
|
5
|
23.00
|
0.20
|
|
9
|
18
|
1184
|
26.66
|
25.13
|
13.93
|
5
|
19.00
|
0.23
|
|
10
|
11
|
1197
|
22.18
|
24.25
|
16.69
|
5
|
17.00
|
0.39
|
|
|
|
PAE (%)
|
Response time (sec)
|
|
|
Q#
|
Target
|
N
|
Median PAE
|
Mean PAE
|
SD PAE
|
Median RT
|
95th RT
|
Item discrim.
|
|
1
|
5
|
1289
|
3.43
|
5.24
|
7.69
|
9
|
26.00
|
0.30
|
|
2
|
16
|
1258
|
15.42
|
17.09
|
11.20
|
6
|
27.00
|
0.37
|
|
3
|
9
|
1255
|
8.06
|
10.97
|
12.02
|
5
|
18.00
|
0.48
|
|
4
|
13
|
1270
|
11.90
|
14.13
|
11.99
|
5
|
20.55
|
0.48
|
|
5
|
2
|
1265
|
1.11
|
3.50
|
11.44
|
4
|
12.00
|
0.22
|
|
6
|
7
|
1262
|
5.75
|
8.86
|
11.79
|
4
|
14.00
|
0.41
|
|
7
|
4
|
1256
|
2.74
|
5.62
|
10.43
|
4
|
13.00
|
0.29
|
|
8
|
19
|
1251
|
22.28
|
22.17
|
12.05
|
4
|
19.00
|
0.48
|
|
9
|
18
|
1249
|
21.77
|
21.60
|
11.64
|
4
|
15.60
|
0.47
|
|
10
|
11
|
1259
|
10.28
|
12.44
|
10.62
|
4
|
14.00
|
0.51
|
|
11
|
7
|
1243
|
6.55
|
9.19
|
10.57
|
3
|
11.00
|
0.40
|
|
12
|
19
|
1238
|
21.27
|
21.81
|
12.38
|
3
|
14.00
|
0.45
|
|
13
|
4
|
1249
|
3.33
|
7.45
|
13.18
|
3
|
10.00
|
0.26
|
|
14
|
9
|
1243
|
7.86
|
10.92
|
11.41
|
3
|
11.00
|
0.46
|
|
15
|
13
|
1238
|
10.89
|
13.41
|
11.24
|
3
|
12.00
|
0.49
|
|
16
|
5
|
1243
|
4.33
|
8.28
|
12.21
|
3
|
11.00
|
0.29
|
|
17
|
2
|
1236
|
1.31
|
5.08
|
13.58
|
3
|
9.00
|
0.24
|
|
18
|
16
|
1224
|
16.85
|
18.05
|
11.46
|
3
|
12.85
|
0.44
|
|
19
|
11
|
1236
|
9.98
|
12.80
|
11.46
|
3
|
11.00
|
0.50
|
|
20
|
18
|
1234
|
18.69
|
20.06
|
12.11
|
3
|
13.00
|
0.46
|
|
|
|
PAE (%)
|
Response time (sec)
|
|
|
Q#
|
Target
|
N
|
Median PAE
|
Mean PAE
|
SD PAE
|
Median RT
|
95th RT
|
Item discrim.
|
|
1
|
3
|
699
|
2.73
|
5.13
|
9.40
|
19
|
72.20
|
0.34
|
|
2
|
5
|
677
|
6.16
|
8.96
|
10.90
|
12
|
43.20
|
0.39
|
|
3
|
16
|
713
|
16.87
|
20.11
|
14.78
|
12
|
42.00
|
0.41
|
|
4
|
9
|
712
|
12.57
|
17.91
|
16.31
|
9
|
29.00
|
0.58
|
|
5
|
13
|
724
|
17.11
|
20.25
|
14.88
|
8
|
31.85
|
0.56
|
|
6
|
7
|
725
|
11.40
|
15.38
|
14.42
|
7
|
21.00
|
0.56
|
|
7
|
4
|
720
|
5.96
|
9.87
|
13.17
|
6
|
17.00
|
0.42
|
|
8
|
19
|
722
|
24.75
|
22.94
|
12.88
|
6
|
26.00
|
0.33
|
|
9
|
18
|
718
|
22.31
|
21.62
|
12.55
|
5
|
25.00
|
0.35
|
|
10
|
11
|
729
|
16.77
|
20.54
|
15.56
|
5
|
18.00
|
0.49
|
|
|
|
PAE (%)
|
Response time (sec)
|
|
|
Q#
|
Target
|
N
|
Median PAE
|
Mean PAE
|
SD PAE
|
Median RT
|
95th RT
|
Item discrim.
|
|
1
|
3
|
827
|
1.62
|
2.43
|
4.62
|
12.0
|
40.7
|
0.21
|
|
2
|
5
|
820
|
3.43
|
4.93
|
5.97
|
8.5
|
28.0
|
0.24
|
|
3
|
16
|
858
|
13.65
|
15.56
|
11.30
|
10.0
|
33.0
|
0.41
|
|
4
|
9
|
860
|
6.97
|
9.43
|
9.35
|
7.0
|
20.0
|
0.52
|
|
5
|
13
|
858
|
10.10
|
12.81
|
11.07
|
7.0
|
25.0
|
0.56
|
|
6
|
7
|
855
|
5.96
|
8.00
|
7.94
|
5.0
|
18.0
|
0.44
|
|
7
|
4
|
859
|
2.73
|
4.08
|
5.10
|
5.0
|
16.0
|
0.33
|
|
8
|
19
|
854
|
21.87
|
20.57
|
11.59
|
6.0
|
25.0
|
0.47
|
|
9
|
18
|
844
|
20.30
|
19.54
|
10.96
|
4.0
|
22.0
|
0.50
|
|
10
|
11
|
851
|
10.00
|
12.54
|
10.80
|
5.0
|
16.0
|
0.53
|
|
11
|
6
|
840
|
5.03
|
7.58
|
8.62
|
4.0
|
12.0
|
0.35
|
|
12
|
10
|
850
|
8.89
|
11.64
|
10.47
|
4.0
|
14.0
|
0.48
|
|
|
|
PAE (%)
|
Response time (sec)
|
|
|
Q#
|
Target
|
N
|
Median PAE
|
Mean PAE
|
SD PAE
|
Median RT
|
95th RT
|
Item discrim.
|
|
1
|
3
|
551
|
1.82
|
3.55
|
8.61
|
14
|
42.50
|
0.24
|
|
2
|
5
|
529
|
3.64
|
6.18
|
8.87
|
10
|
30.60
|
0.29
|
|
3
|
16
|
545
|
15.47
|
17.53
|
12.53
|
10
|
33.80
|
0.41
|
|
4
|
9
|
550
|
9.90
|
13.33
|
12.94
|
7
|
24.00
|
0.62
|
|
5
|
13
|
551
|
13.74
|
17.48
|
14.28
|
6
|
24.00
|
0.58
|
|
6
|
7
|
558
|
8.48
|
12.34
|
12.22
|
5
|
17.15
|
0.55
|
|
7
|
4
|
561
|
4.75
|
7.57
|
10.27
|
5
|
15.00
|
0.35
|
|
8
|
19
|
557
|
26.57
|
22.31
|
11.17
|
5
|
23.20
|
0.30
|
|
9
|
18
|
551
|
22.32
|
20.95
|
10.53
|
4
|
21.00
|
0.39
|
|
10
|
11
|
555
|
12.93
|
16.80
|
14.56
|
5
|
15.00
|
0.51
|
|
|
|
PAE (%)
|
Response time (sec)
|
|
|
Q#
|
Target
|
N
|
Median PAE
|
Mean PAE
|
SD PAE
|
Median RT
|
95th RT
|
Item discrim.
|
|
1
|
3
|
574
|
1.40
|
1.99
|
2.81
|
10
|
33.0
|
0.12
|
|
2
|
5
|
560
|
3.43
|
4.37
|
3.91
|
7
|
22.0
|
0.22
|
|
3
|
16
|
569
|
14.34
|
15.34
|
10.23
|
8
|
27.0
|
0.33
|
|
4
|
9
|
573
|
7.17
|
9.02
|
8.65
|
6
|
18.0
|
0.53
|
|
5
|
13
|
580
|
9.85
|
12.19
|
10.39
|
5
|
20.1
|
0.50
|
|
6
|
7
|
575
|
5.56
|
7.27
|
7.40
|
5
|
14.0
|
0.43
|
|
7
|
4
|
573
|
2.63
|
4.51
|
6.59
|
4
|
12.0
|
0.33
|
|
8
|
19
|
574
|
22.27
|
20.79
|
11.30
|
5
|
22.0
|
0.52
|
|
9
|
18
|
576
|
19.80
|
19.24
|
10.60
|
3
|
17.0
|
0.49
|
|
10
|
11
|
577
|
9.19
|
11.82
|
10.55
|
4
|
14.0
|
0.52
|
|
11
|
6
|
571
|
5.31
|
7.76
|
8.82
|
4
|
11.0
|
0.35
|
|
12
|
10
|
581
|
8.18
|
10.71
|
10.19
|
3
|
11.0
|
0.49
|
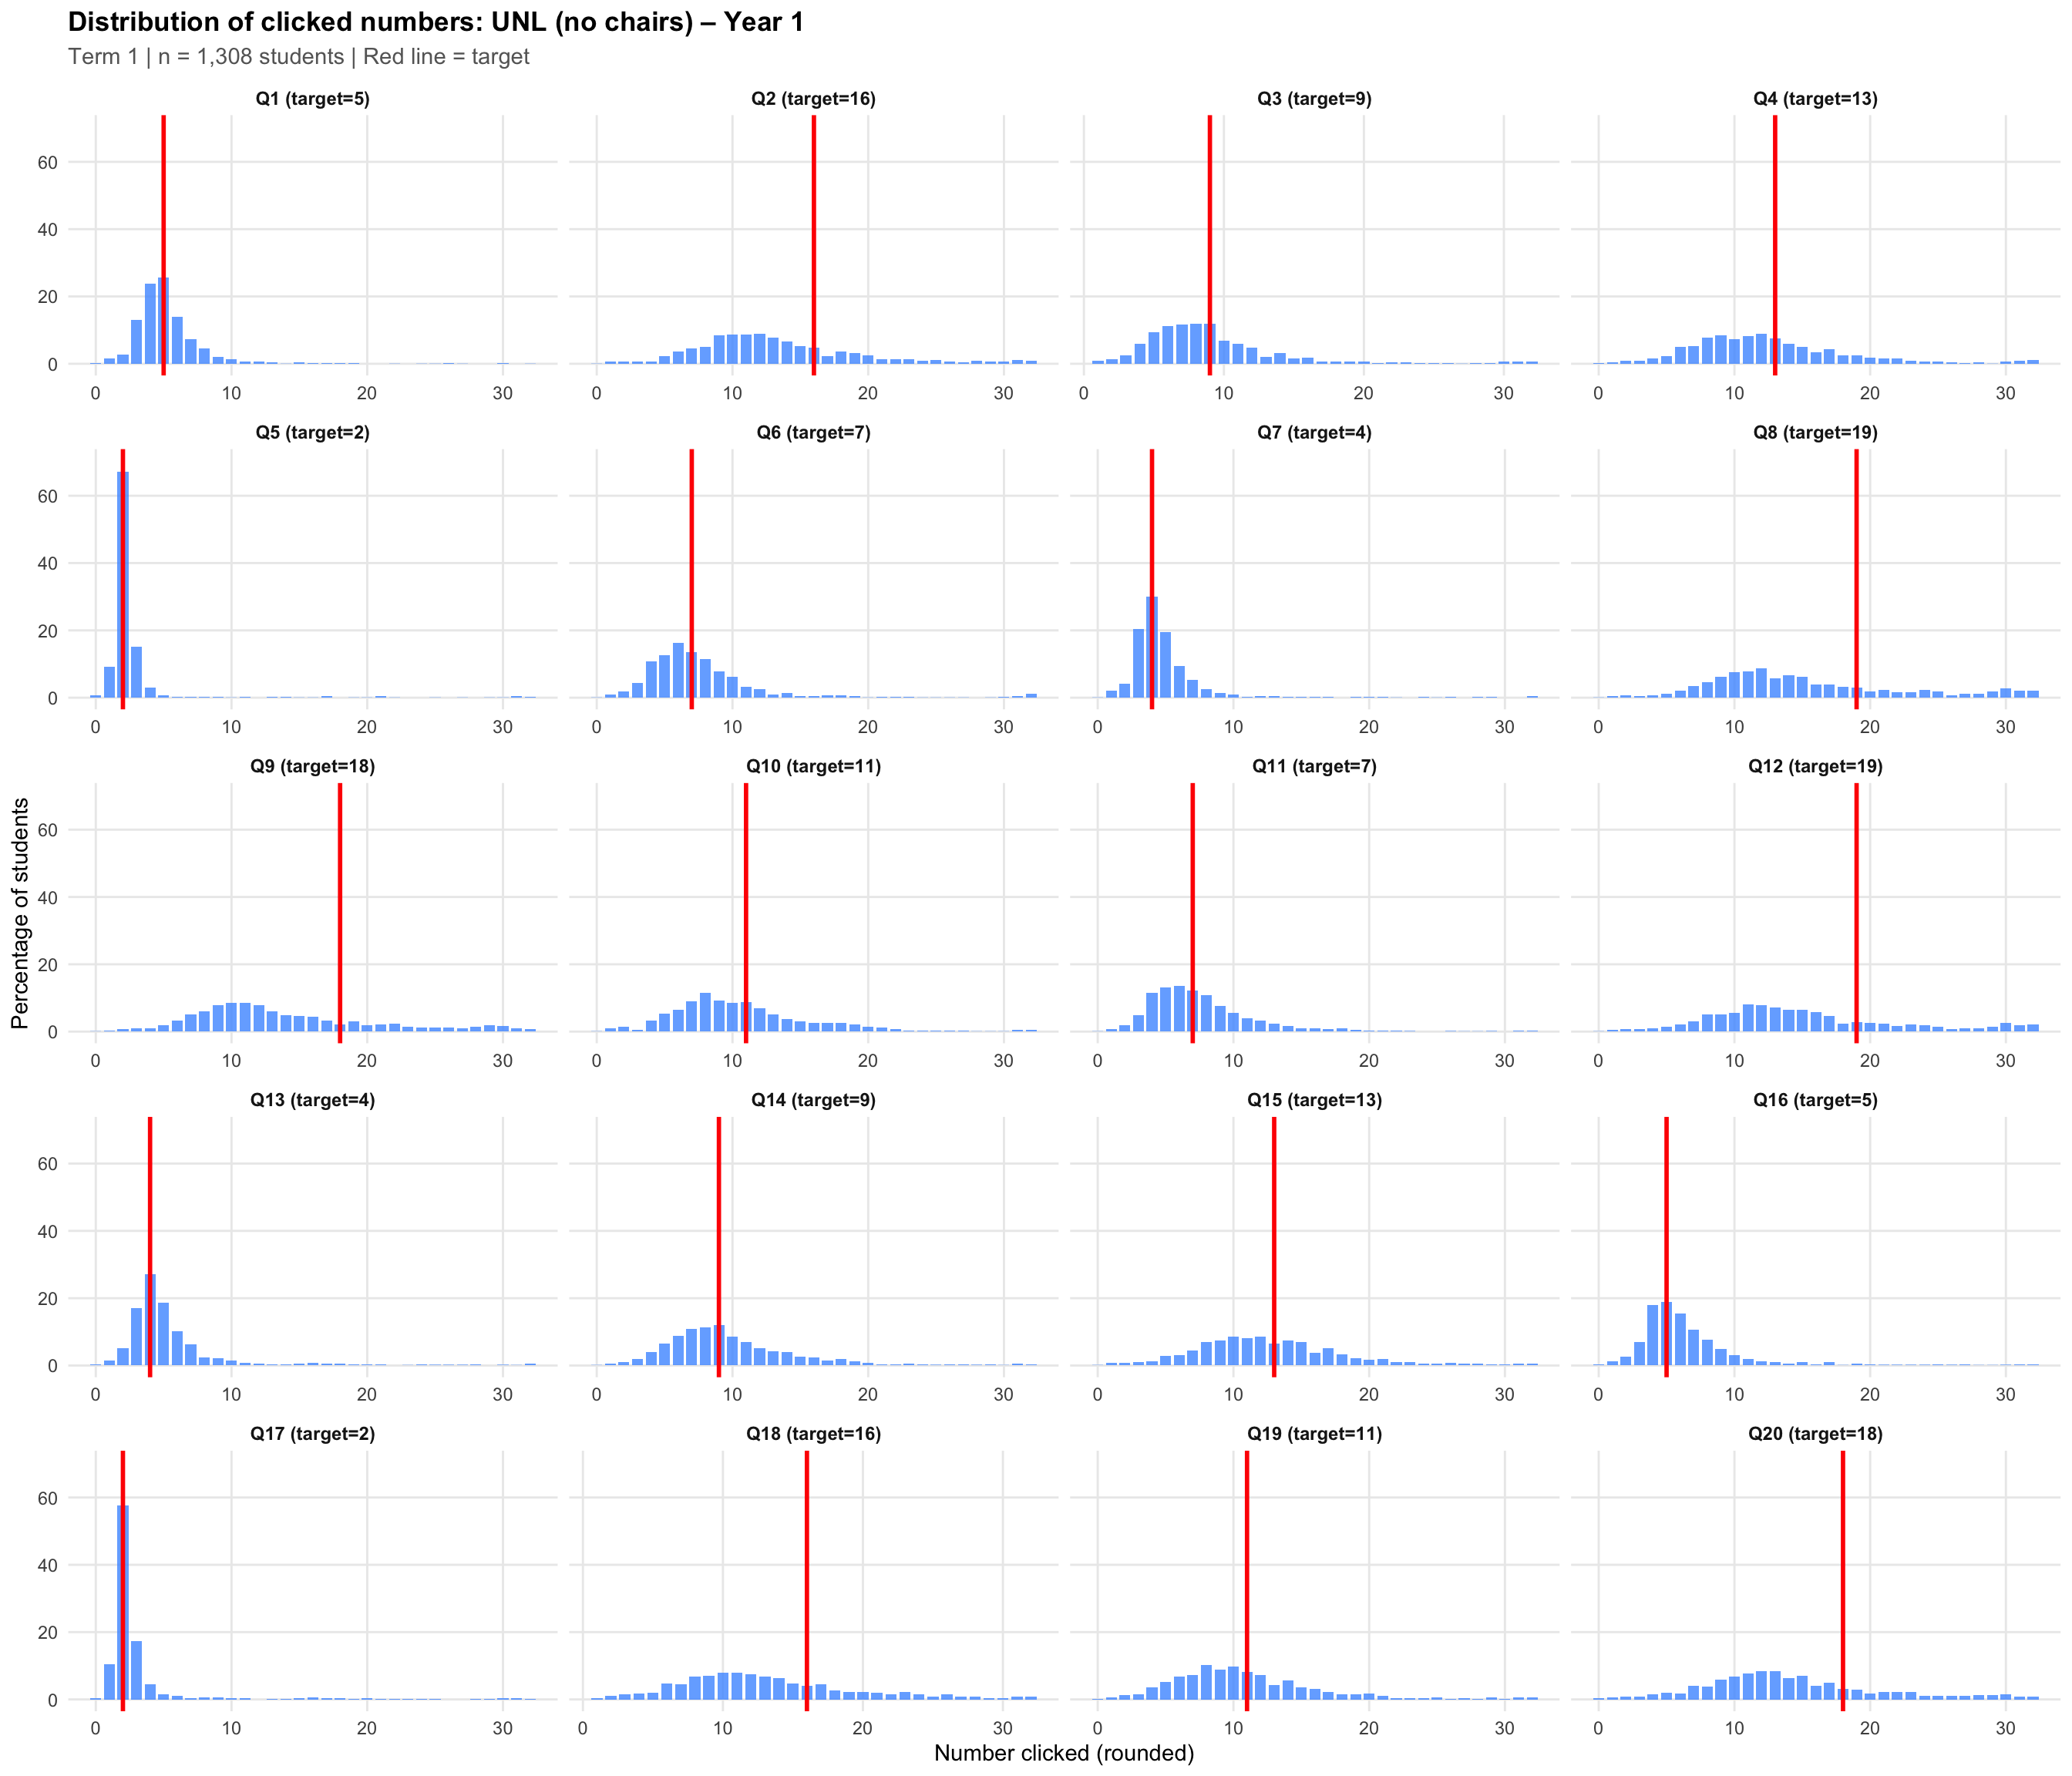
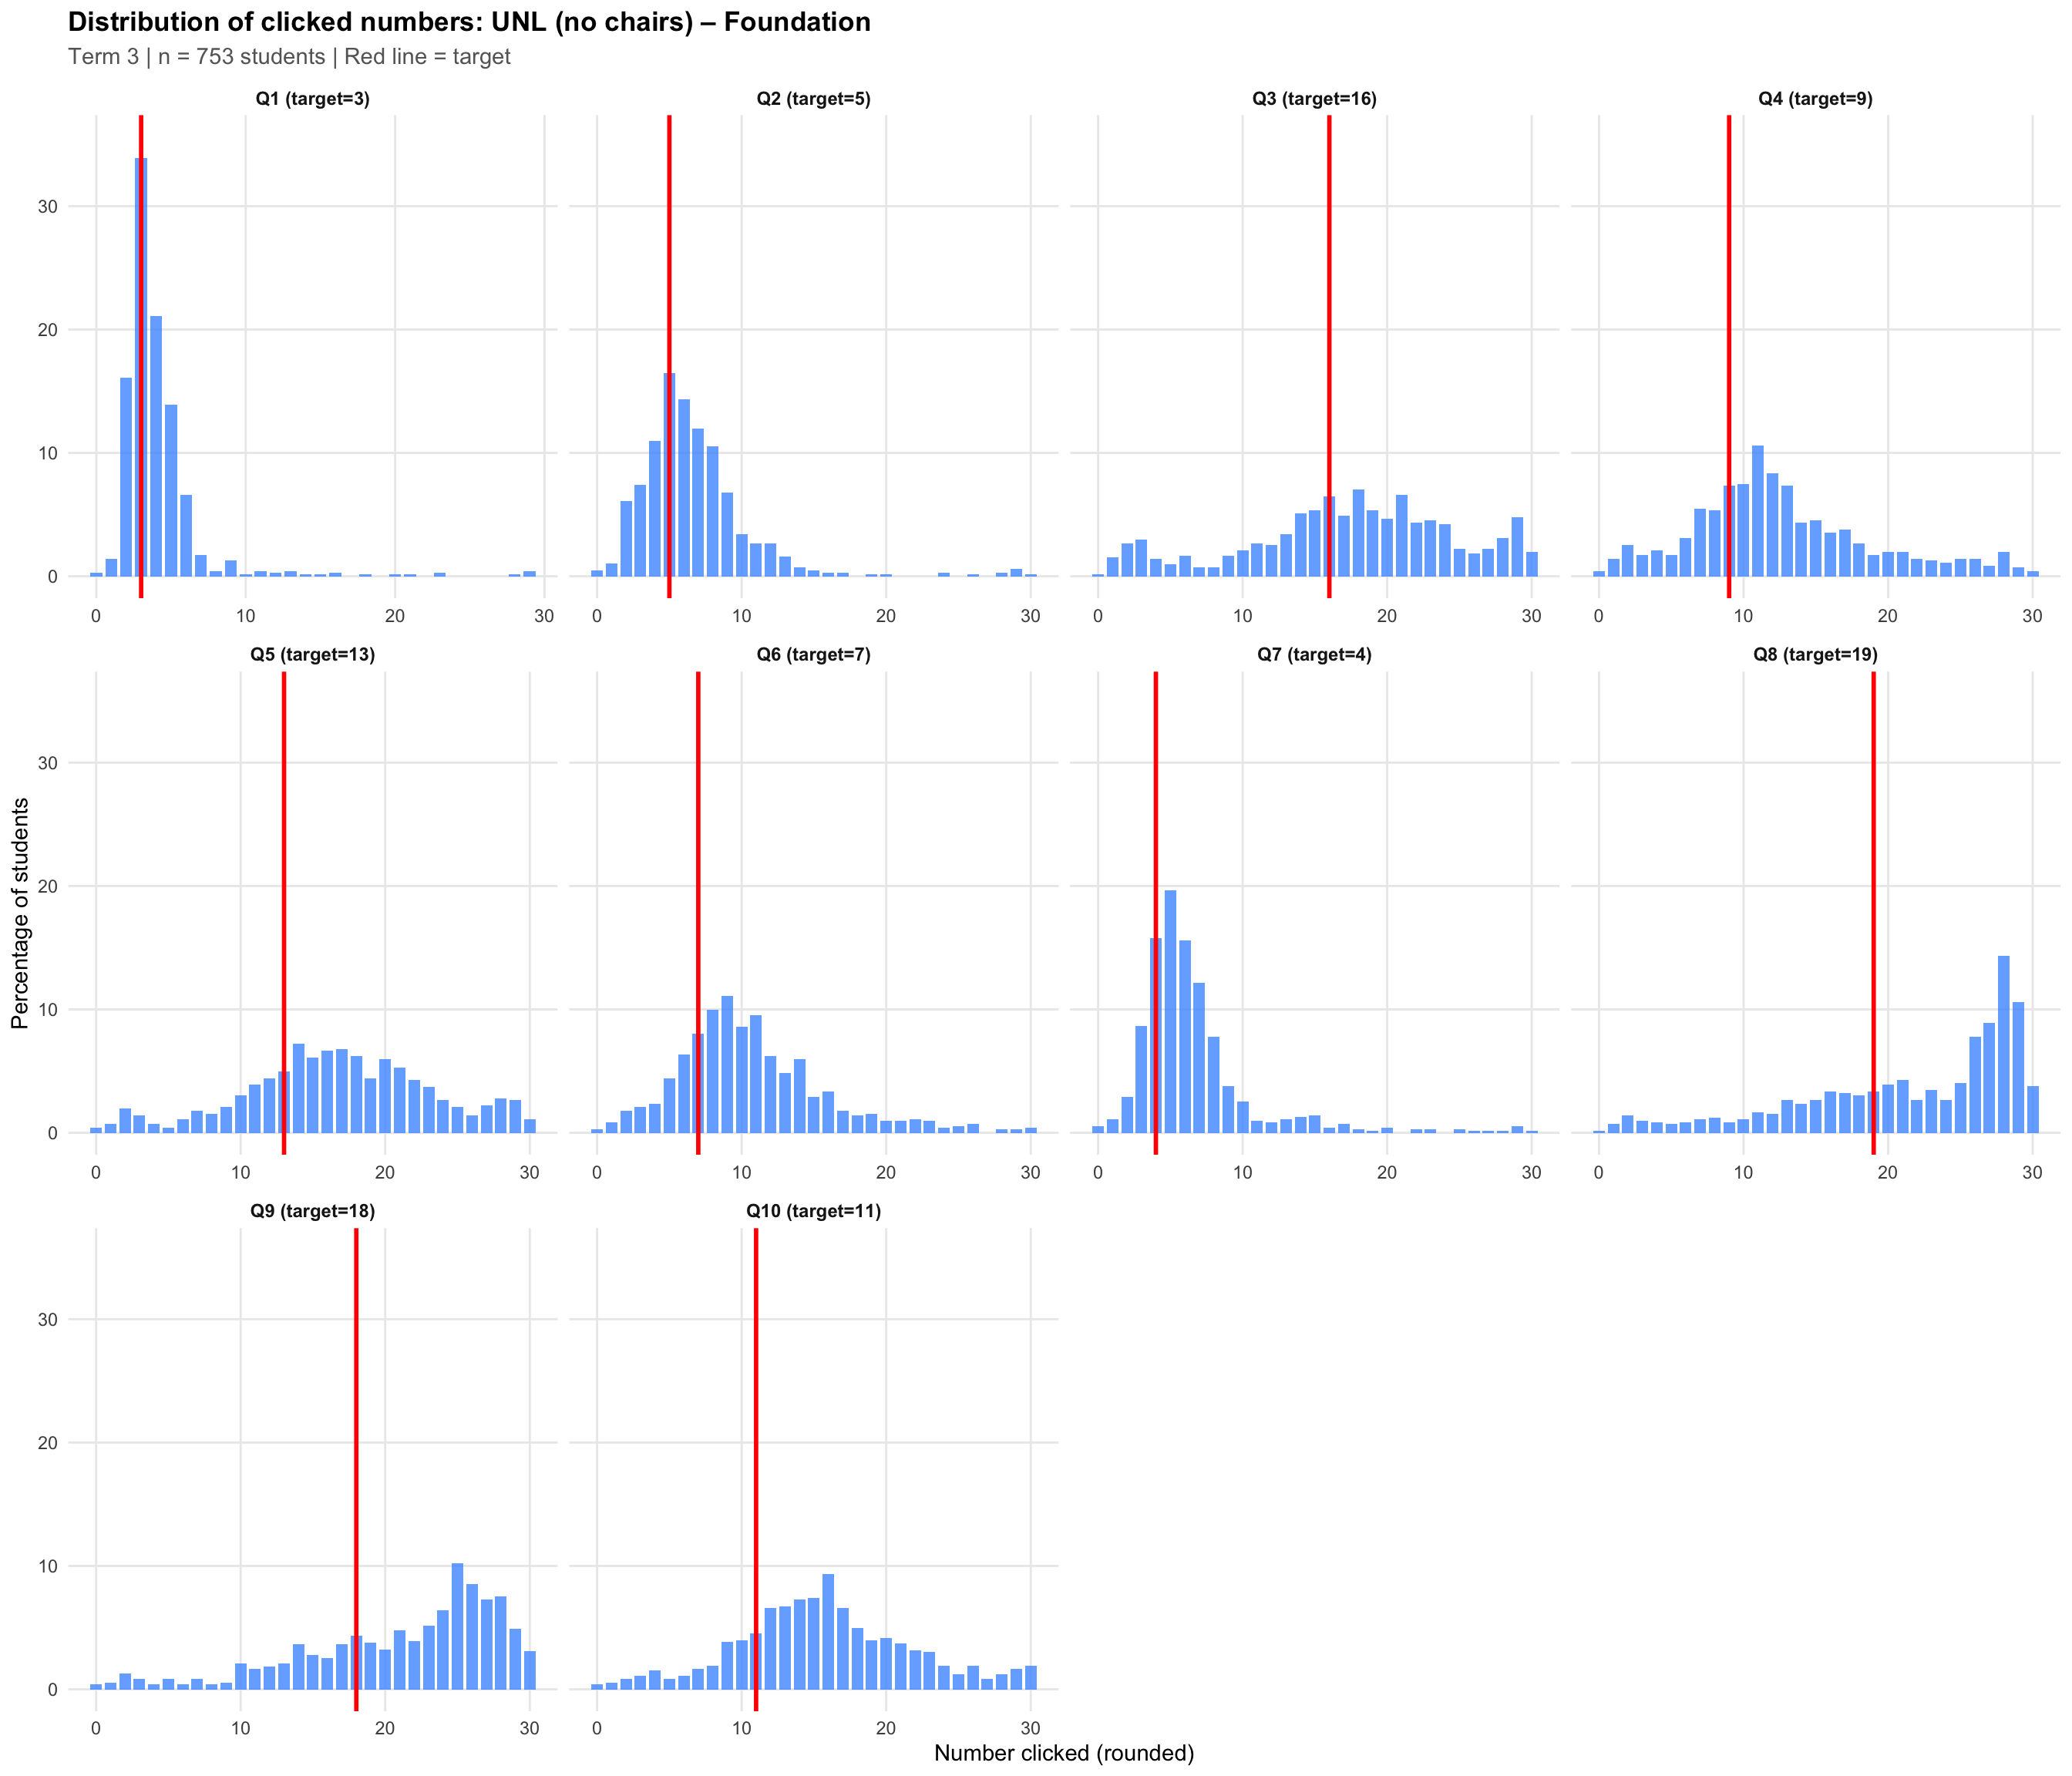
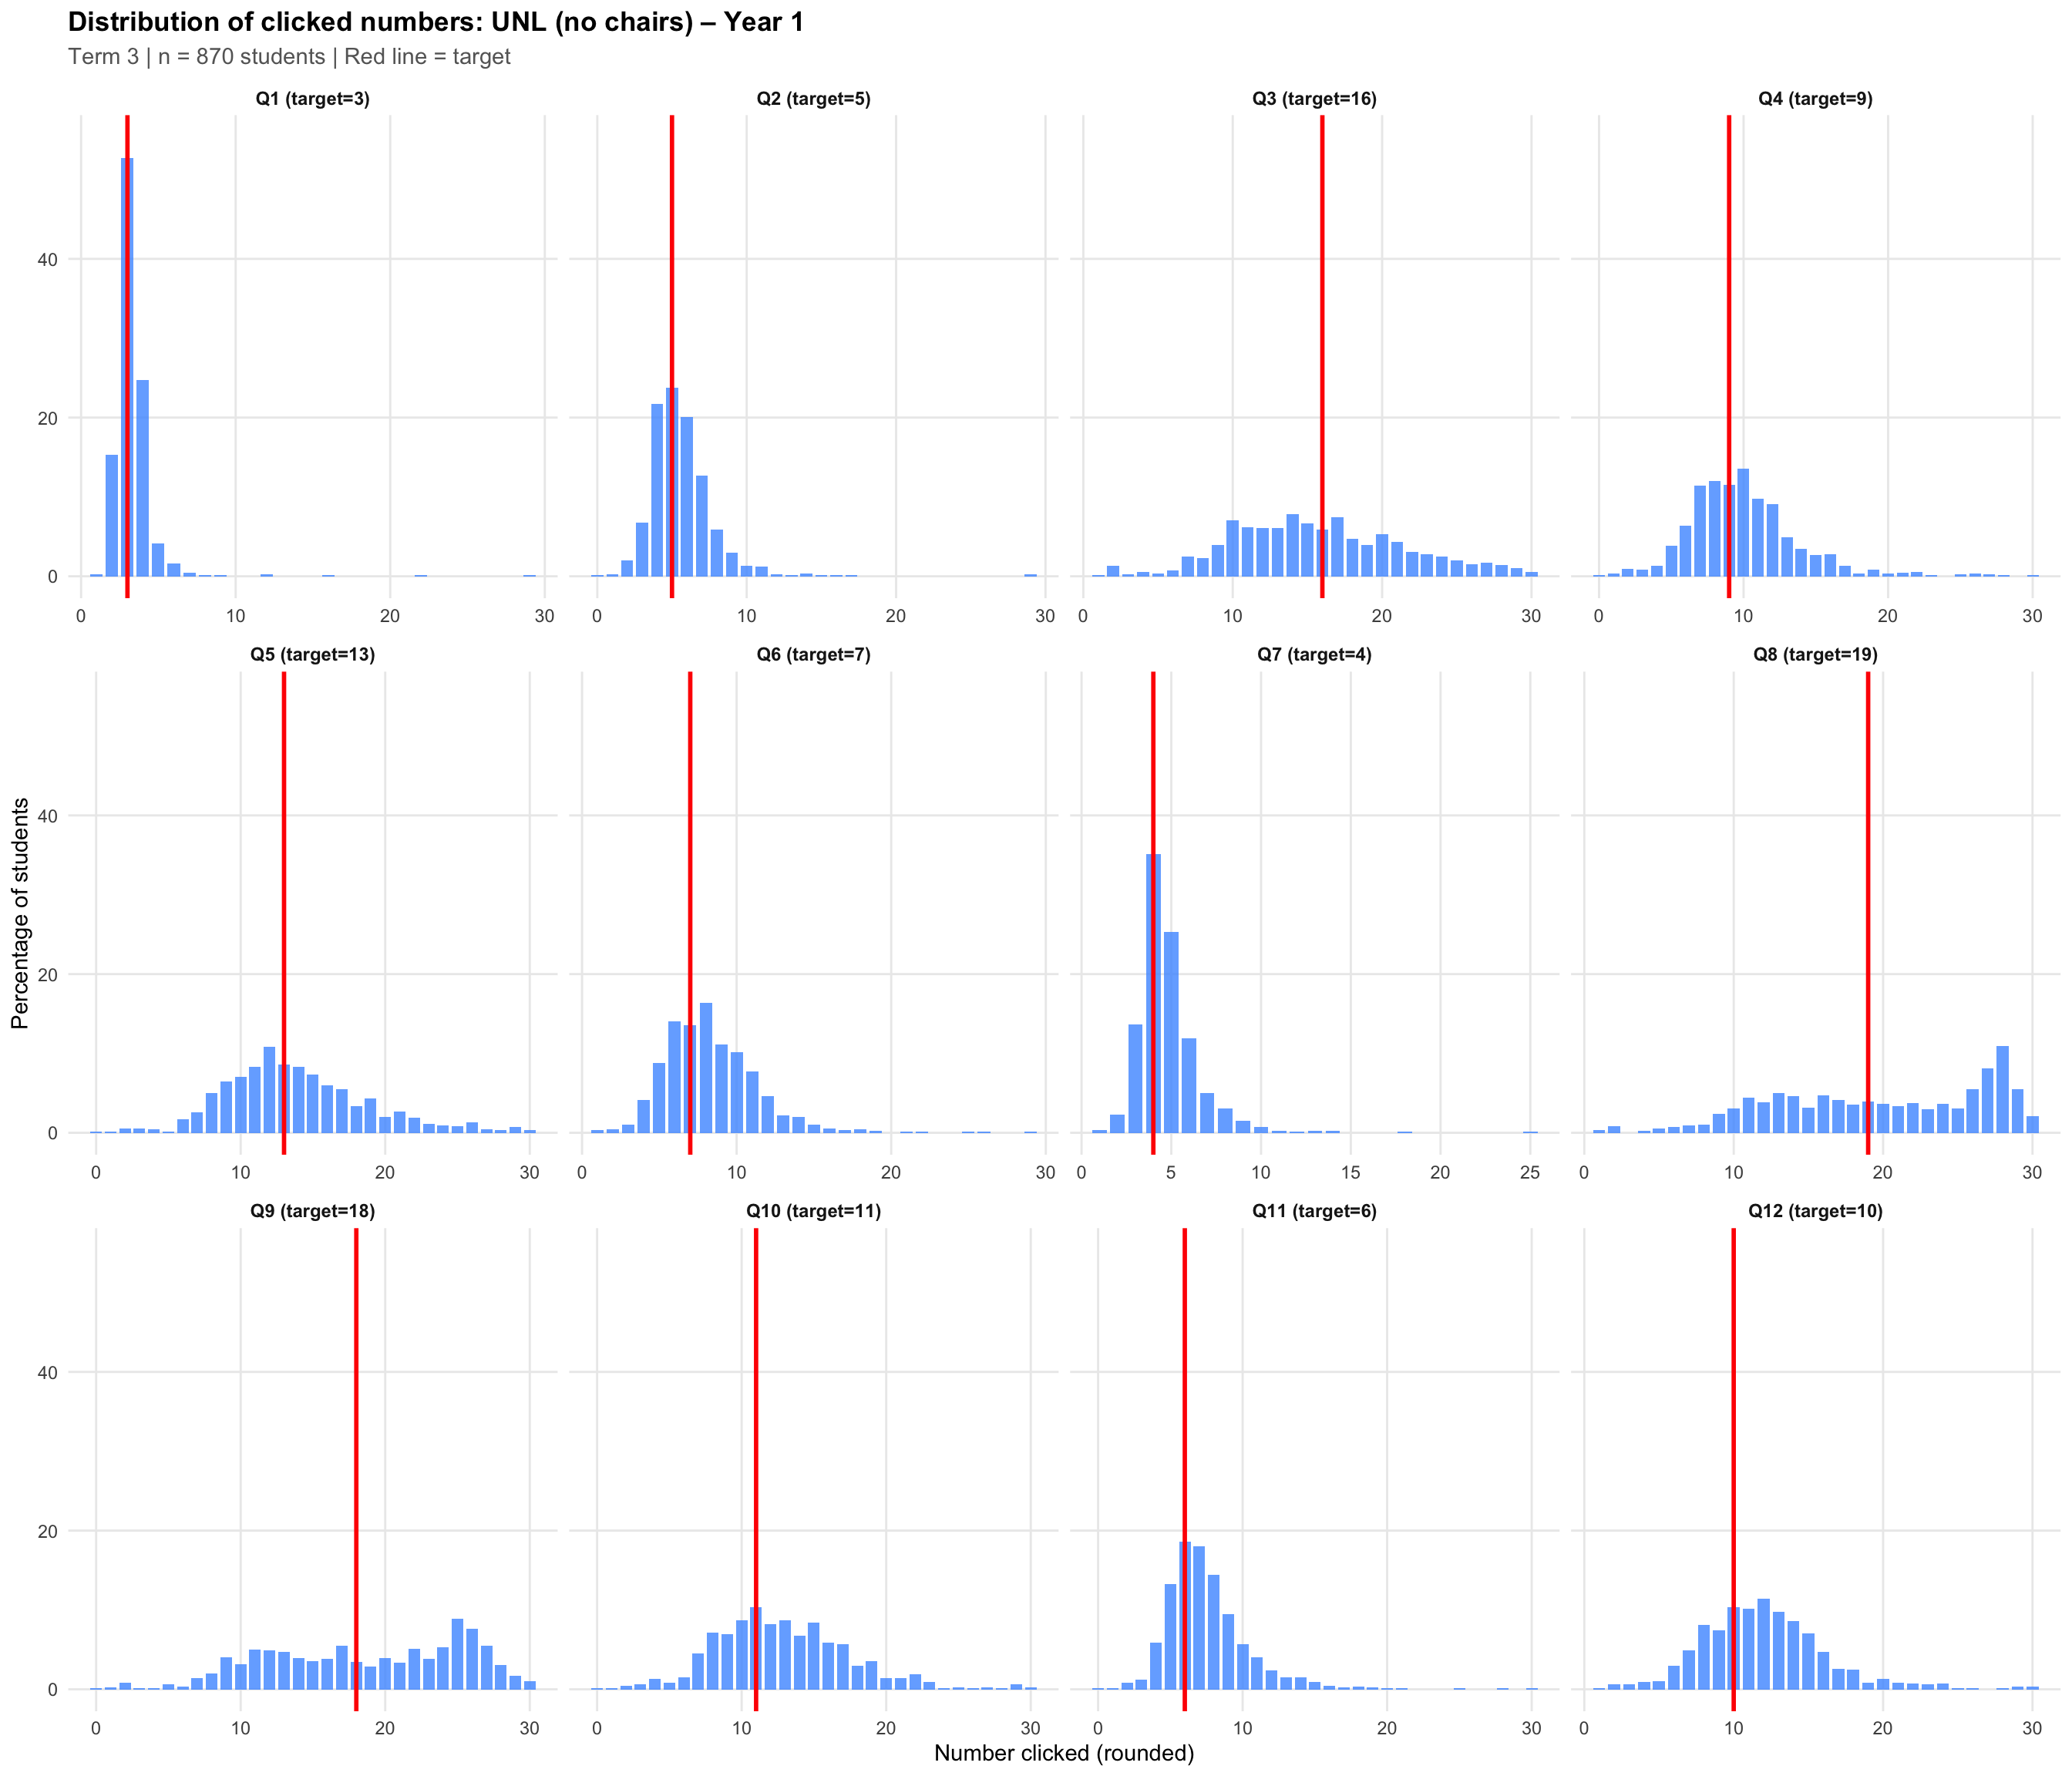
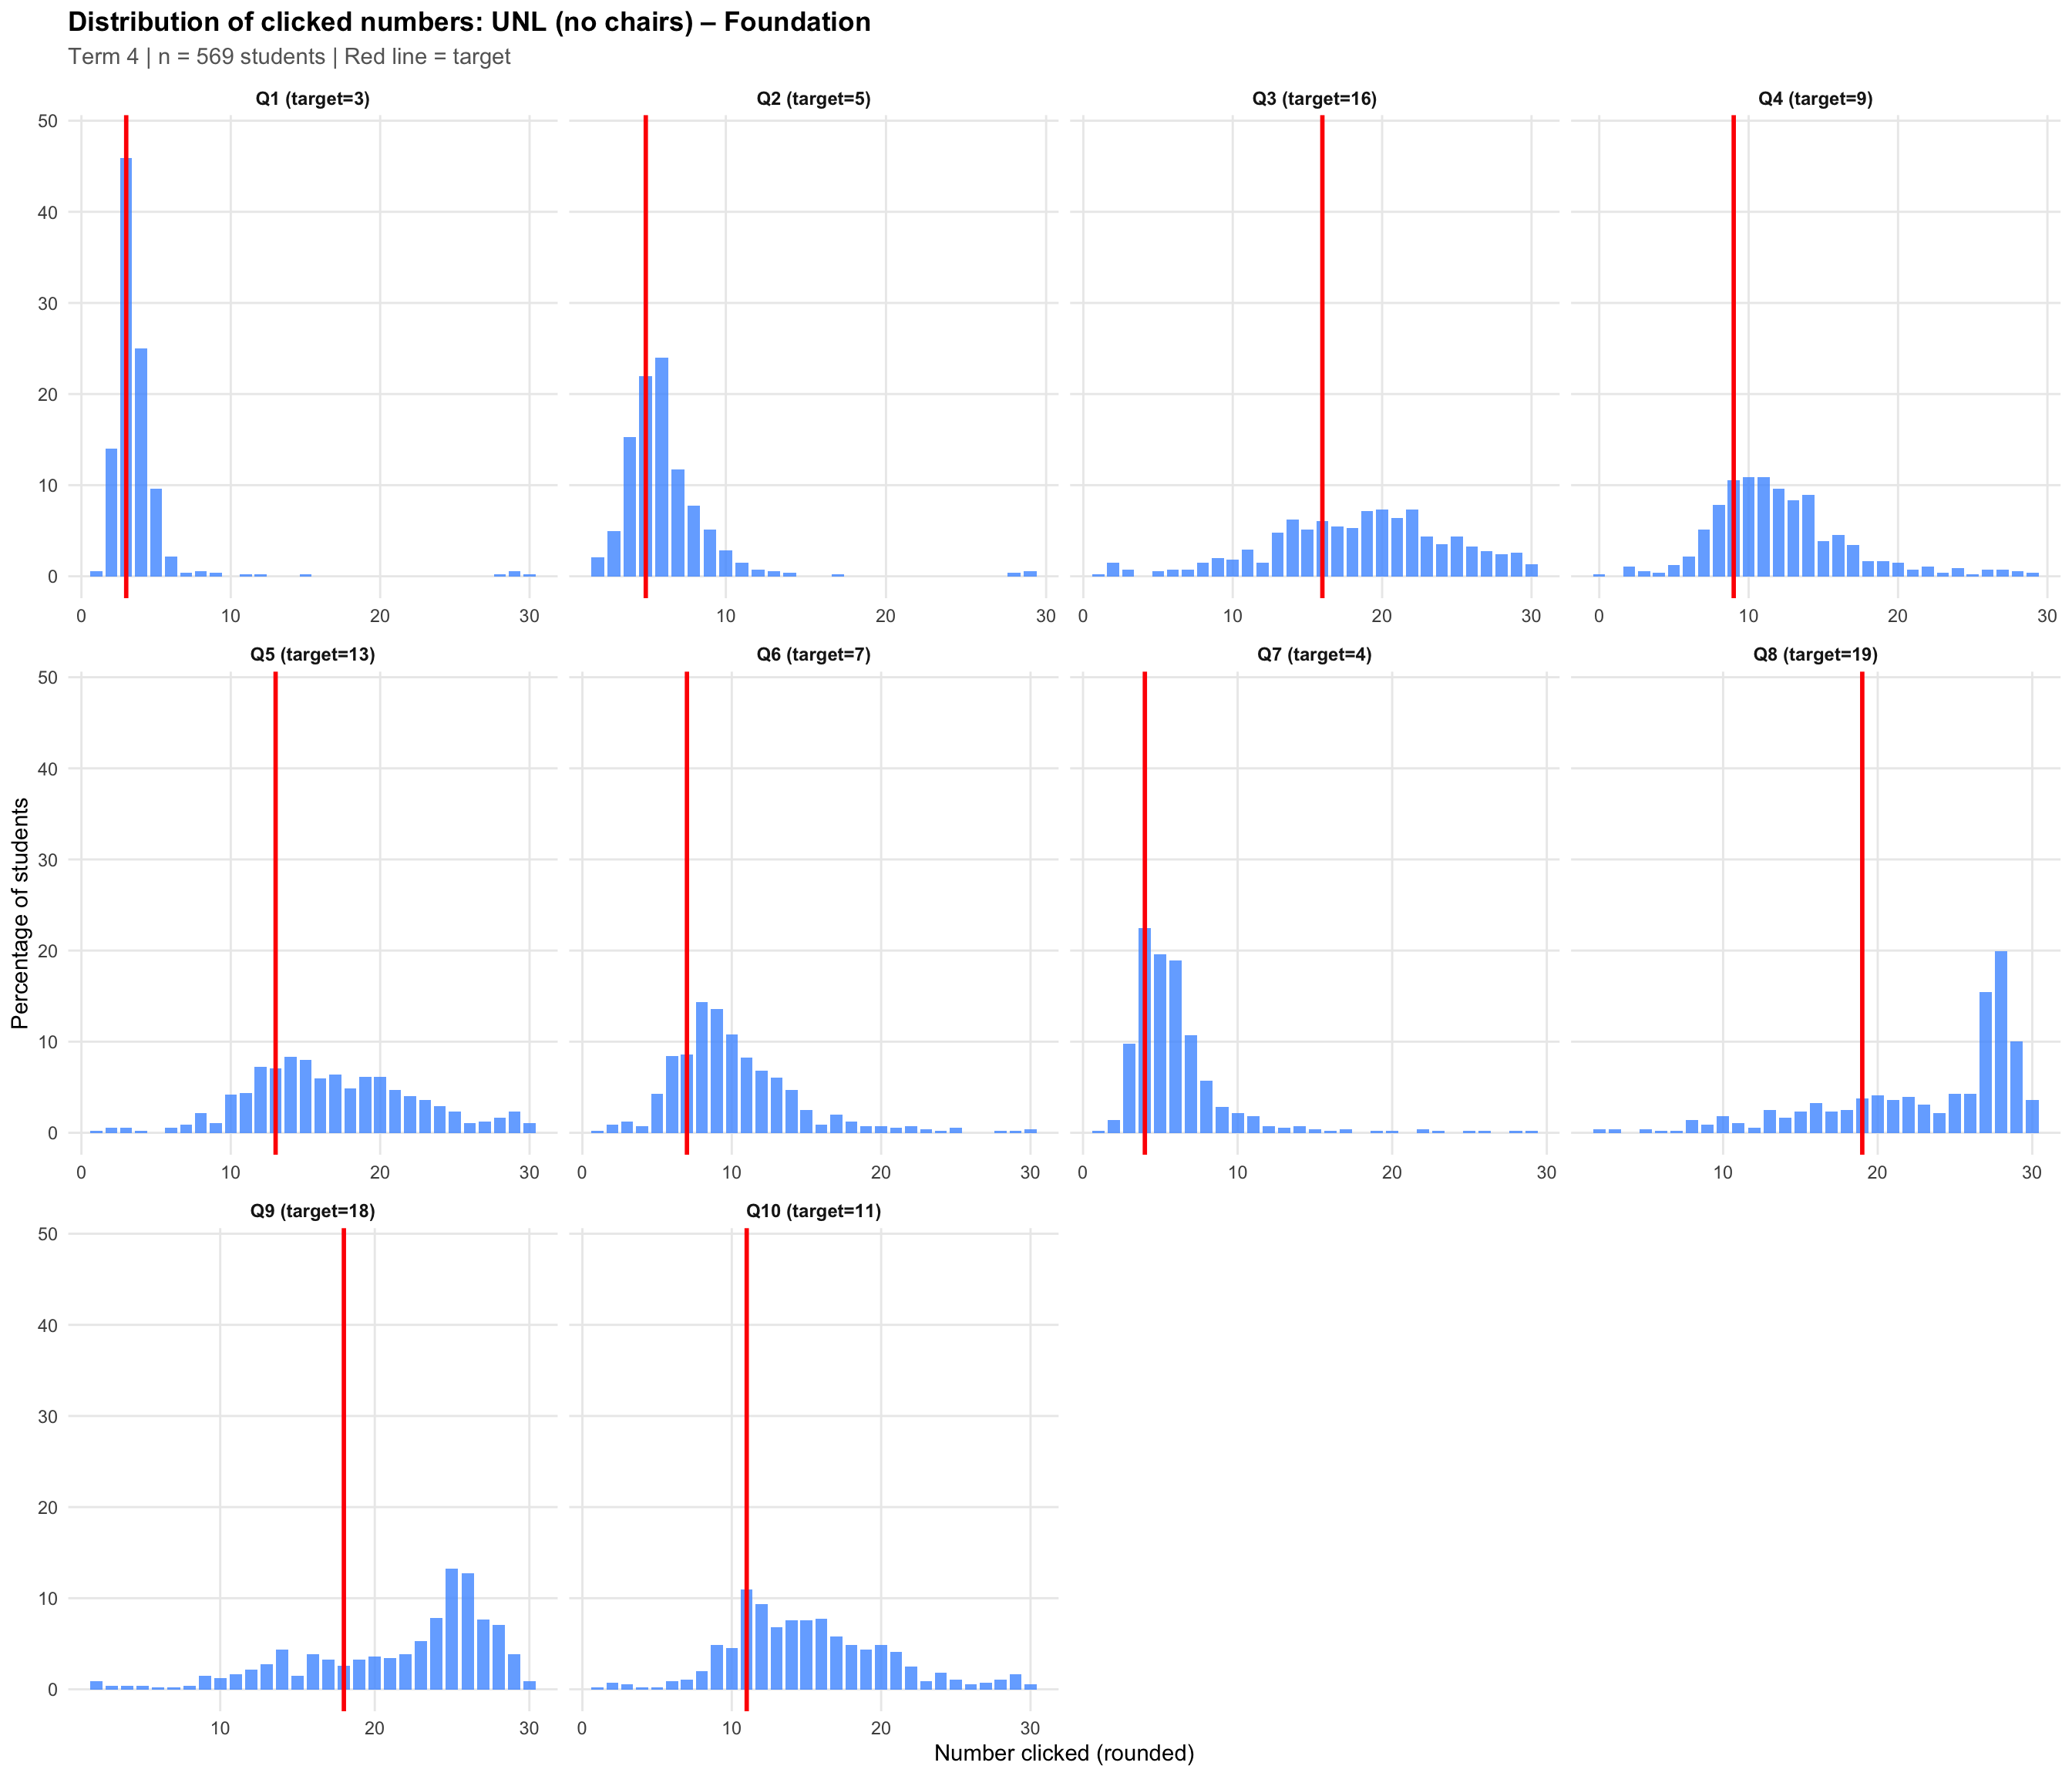
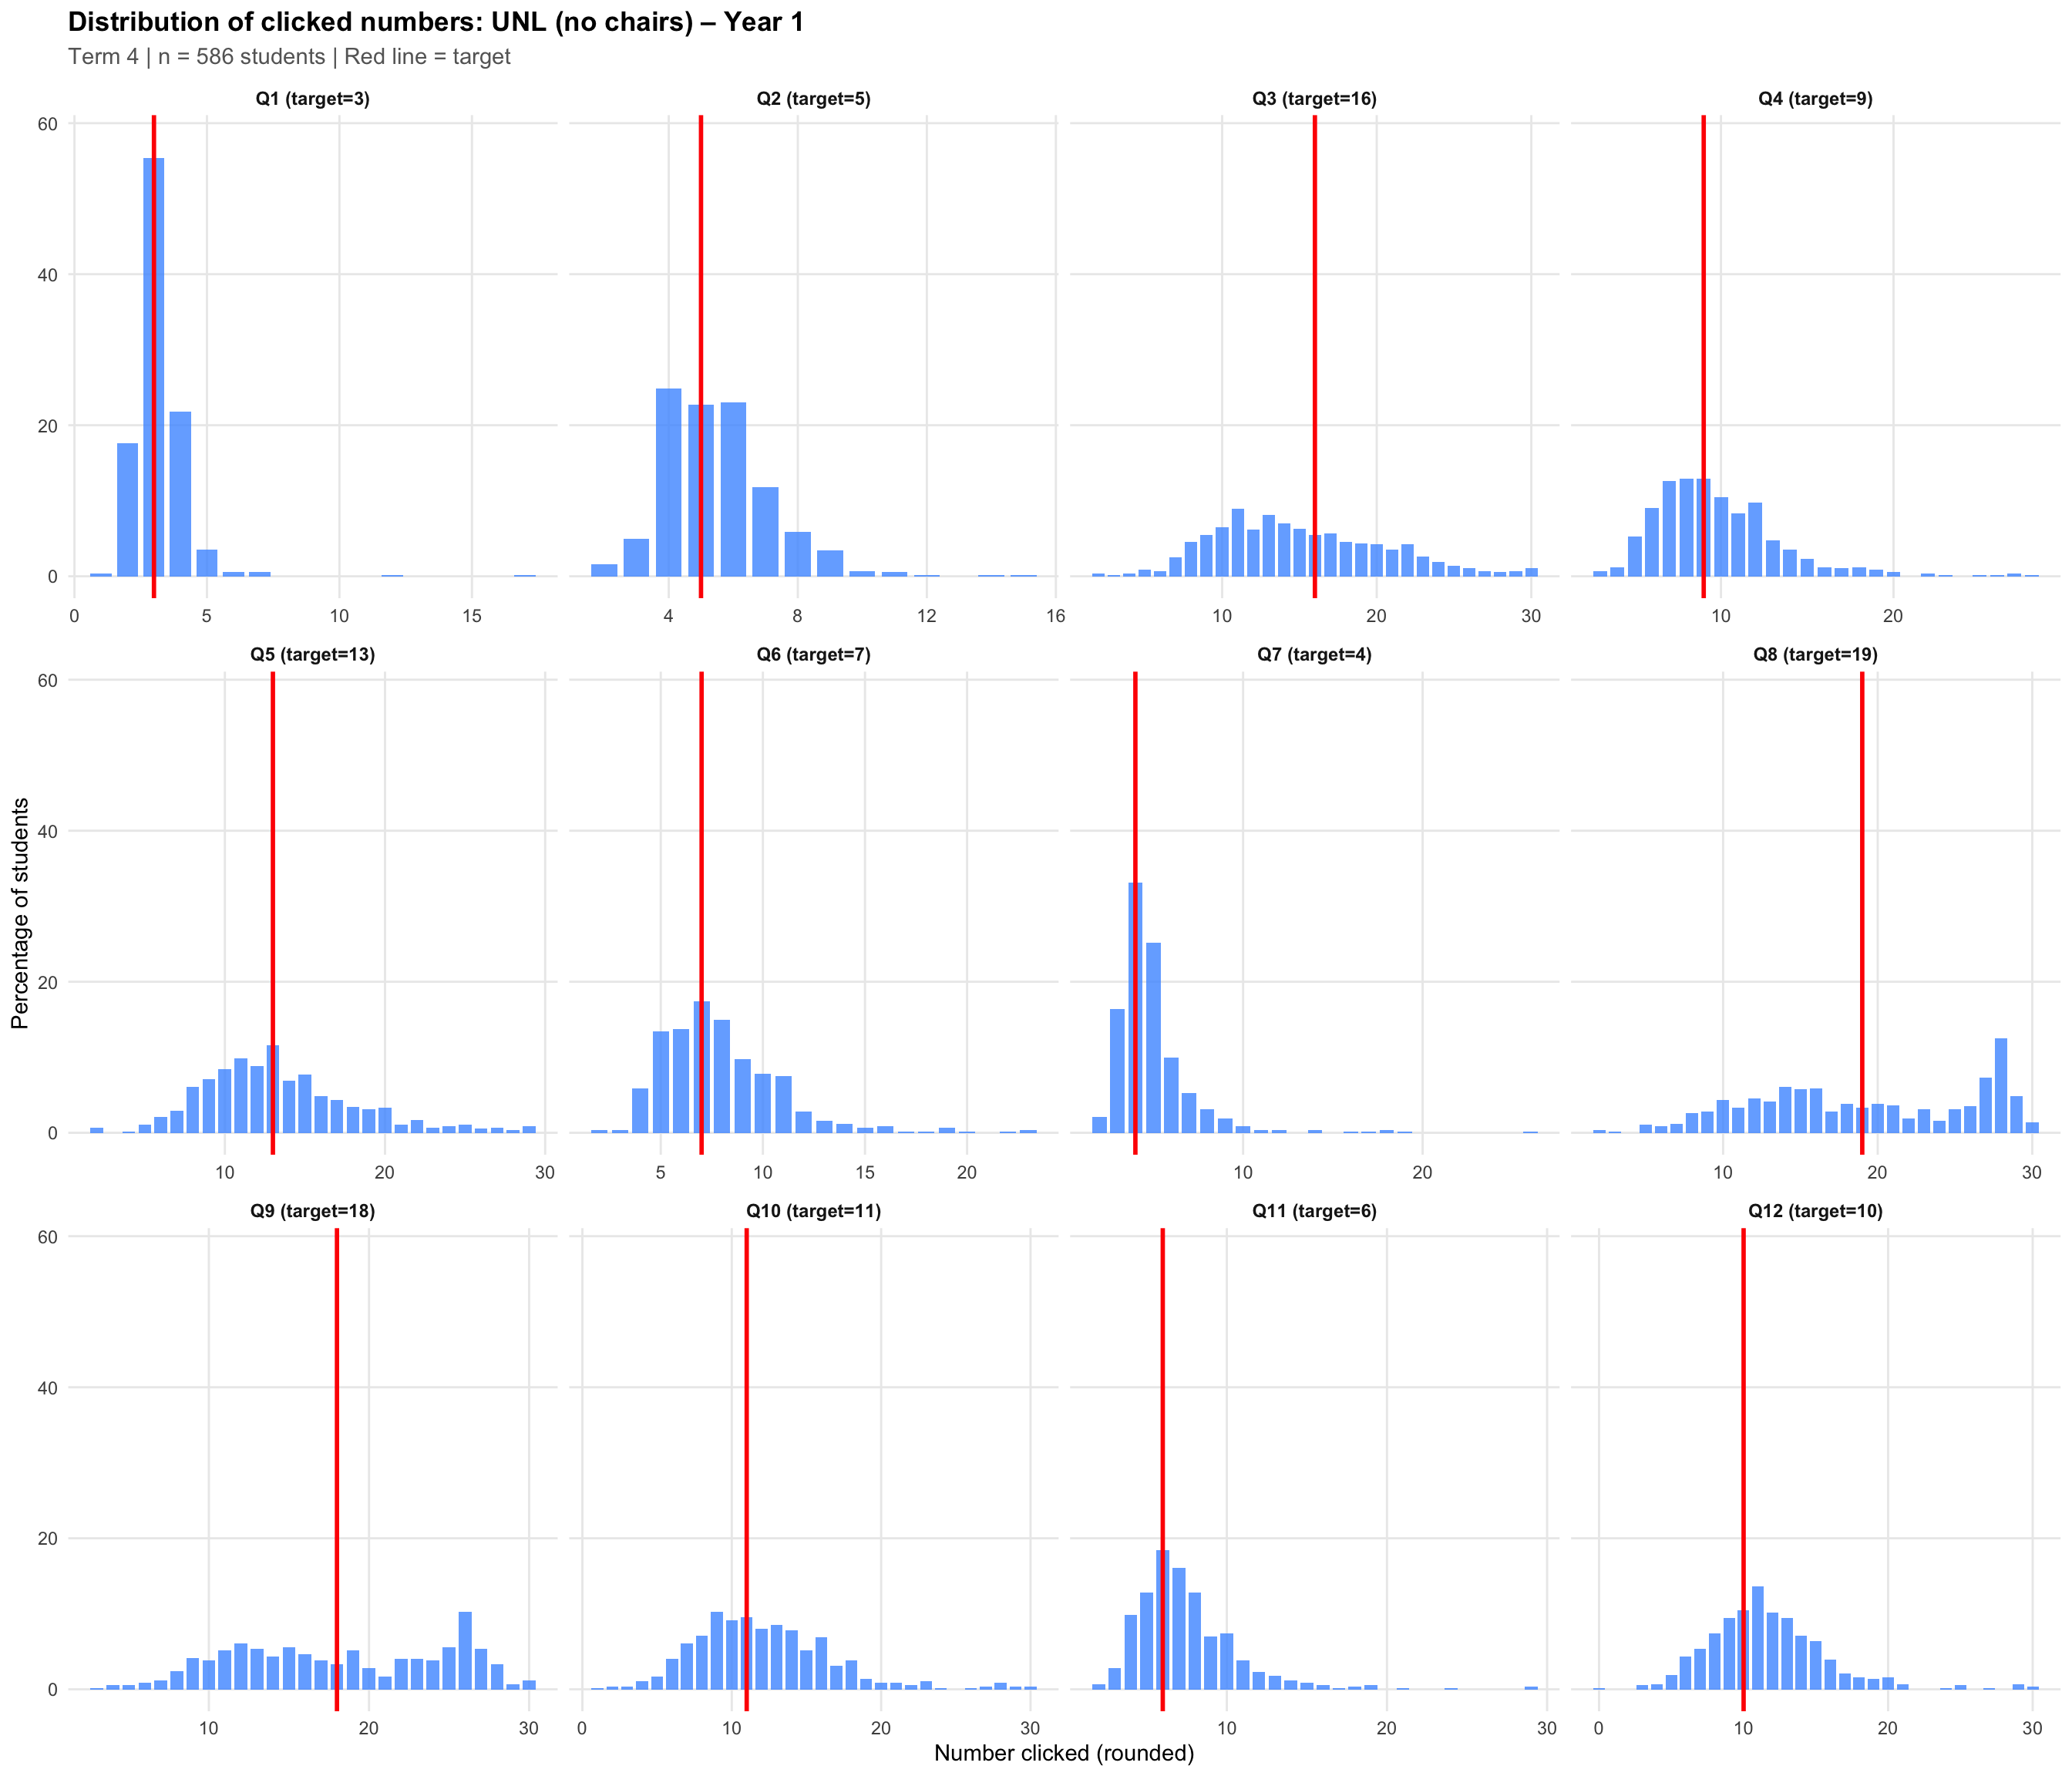
6. Distribution of number clicked (per item)
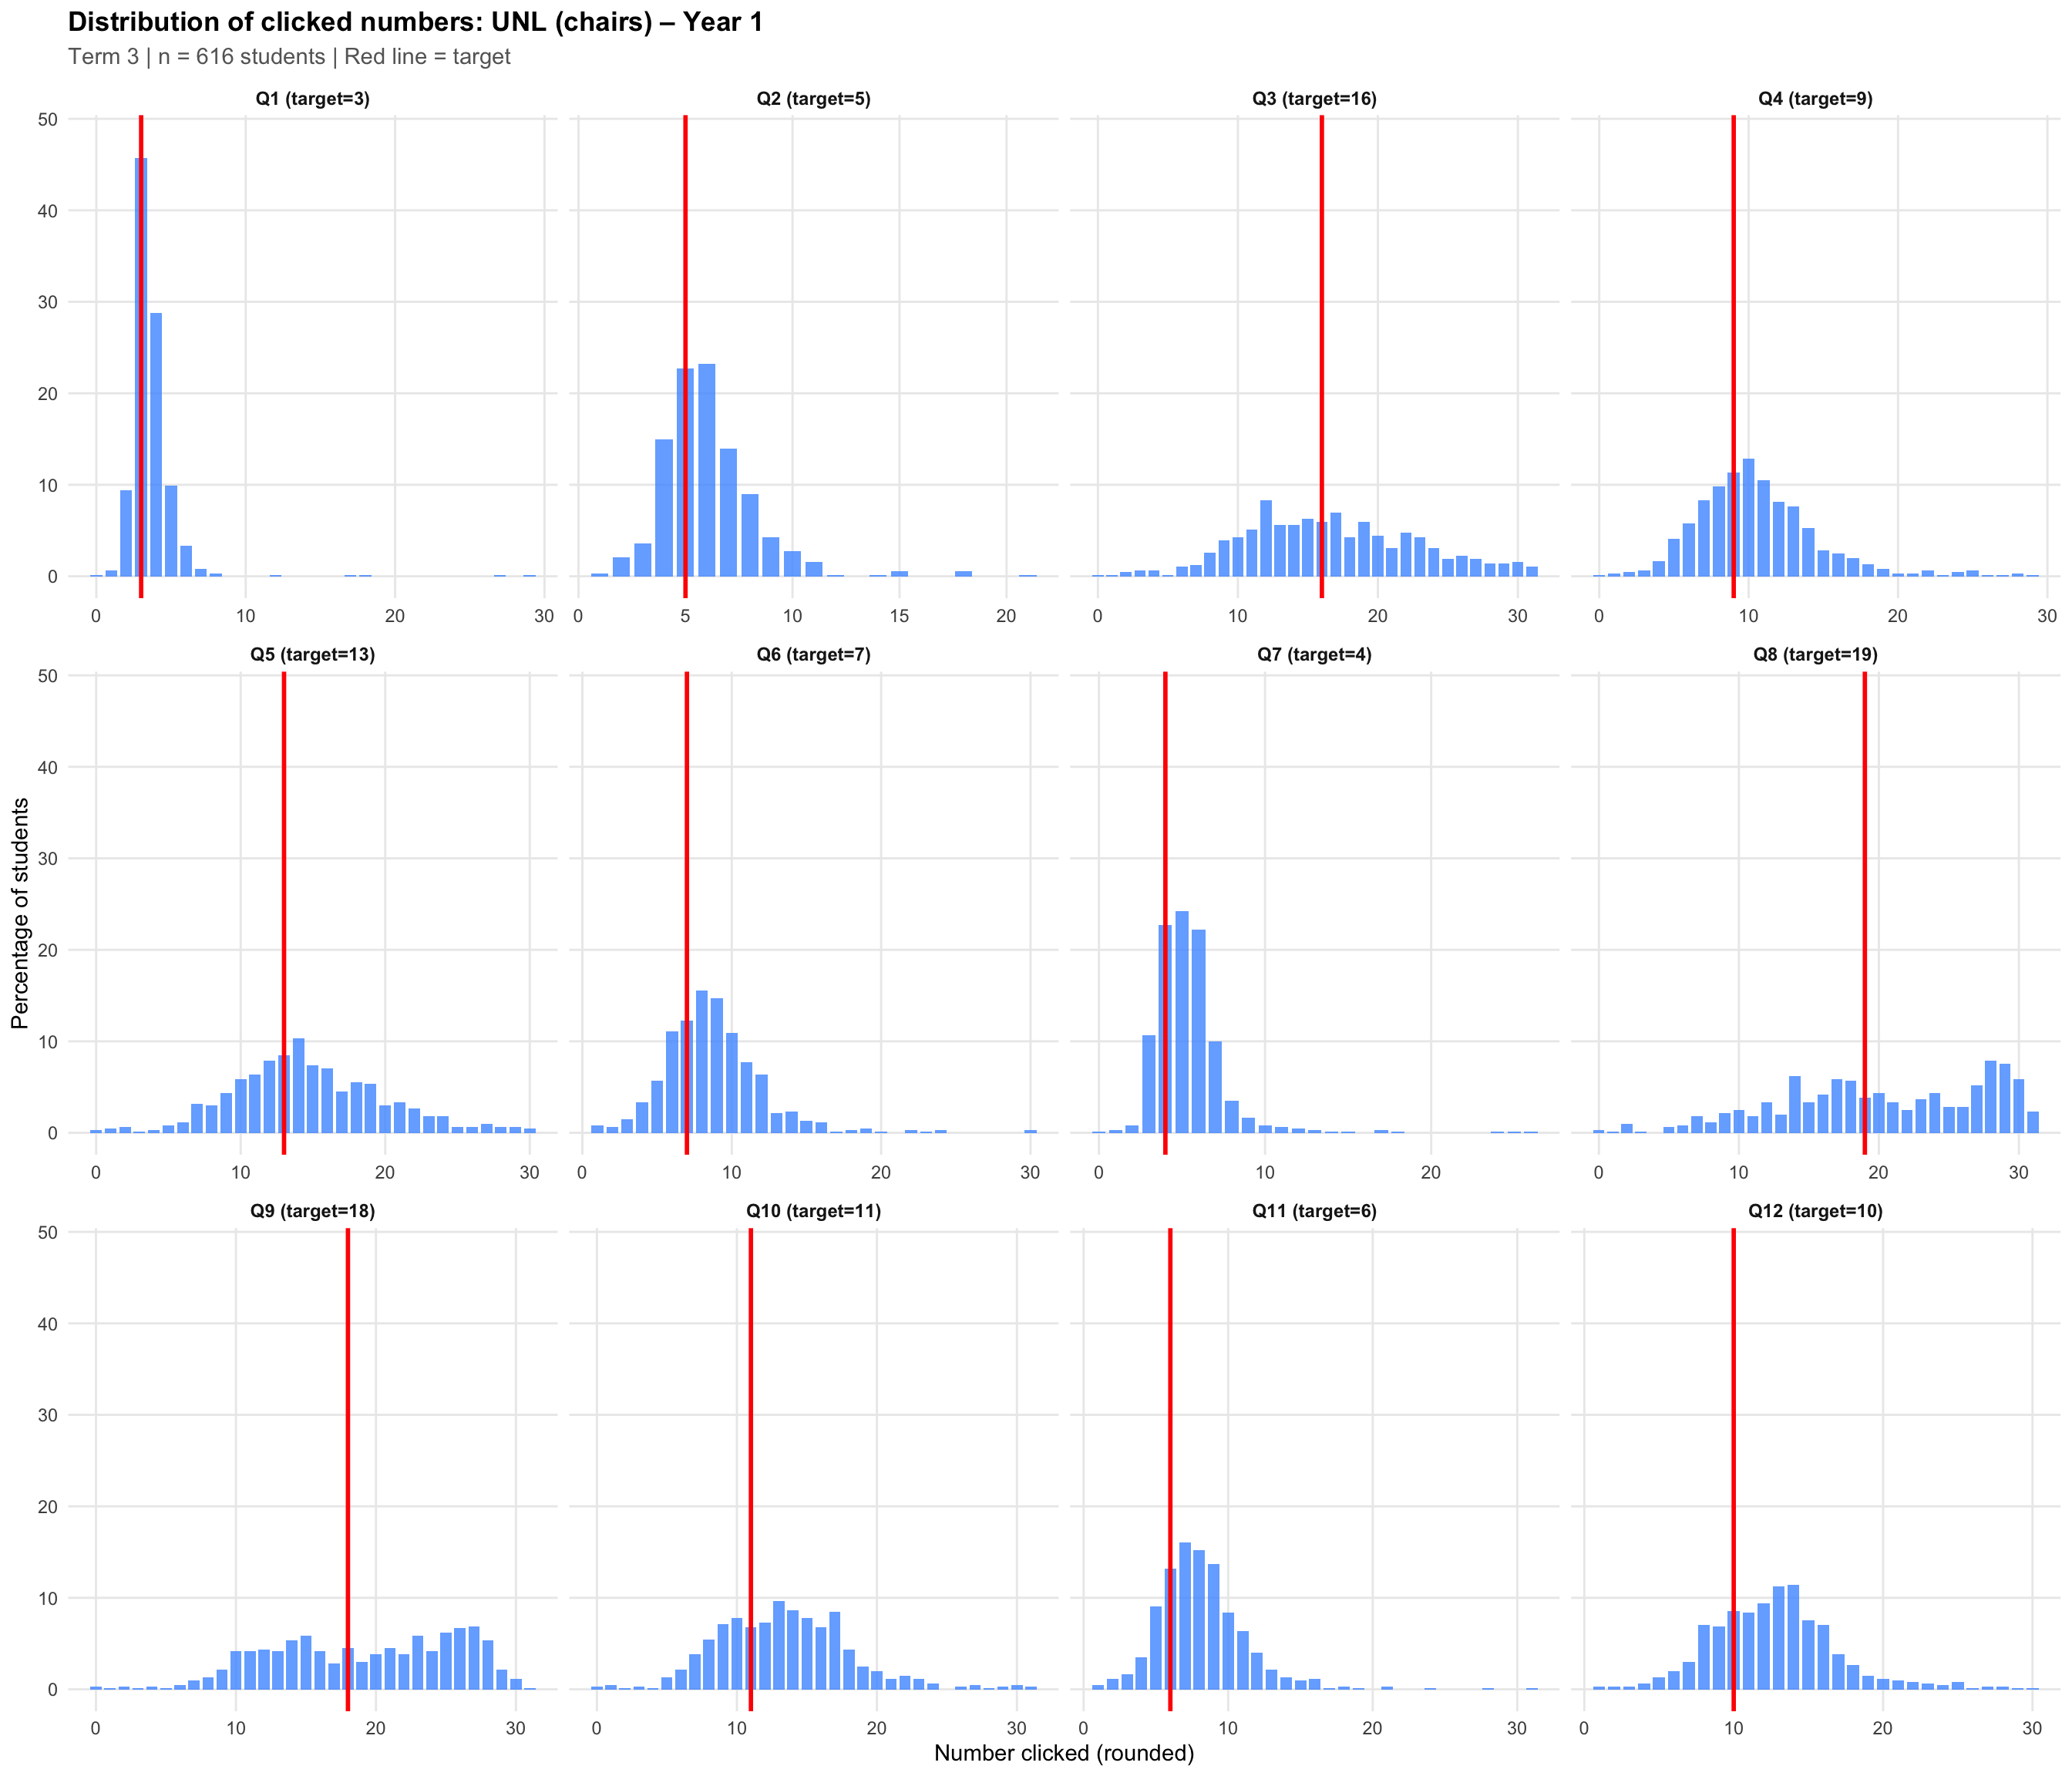
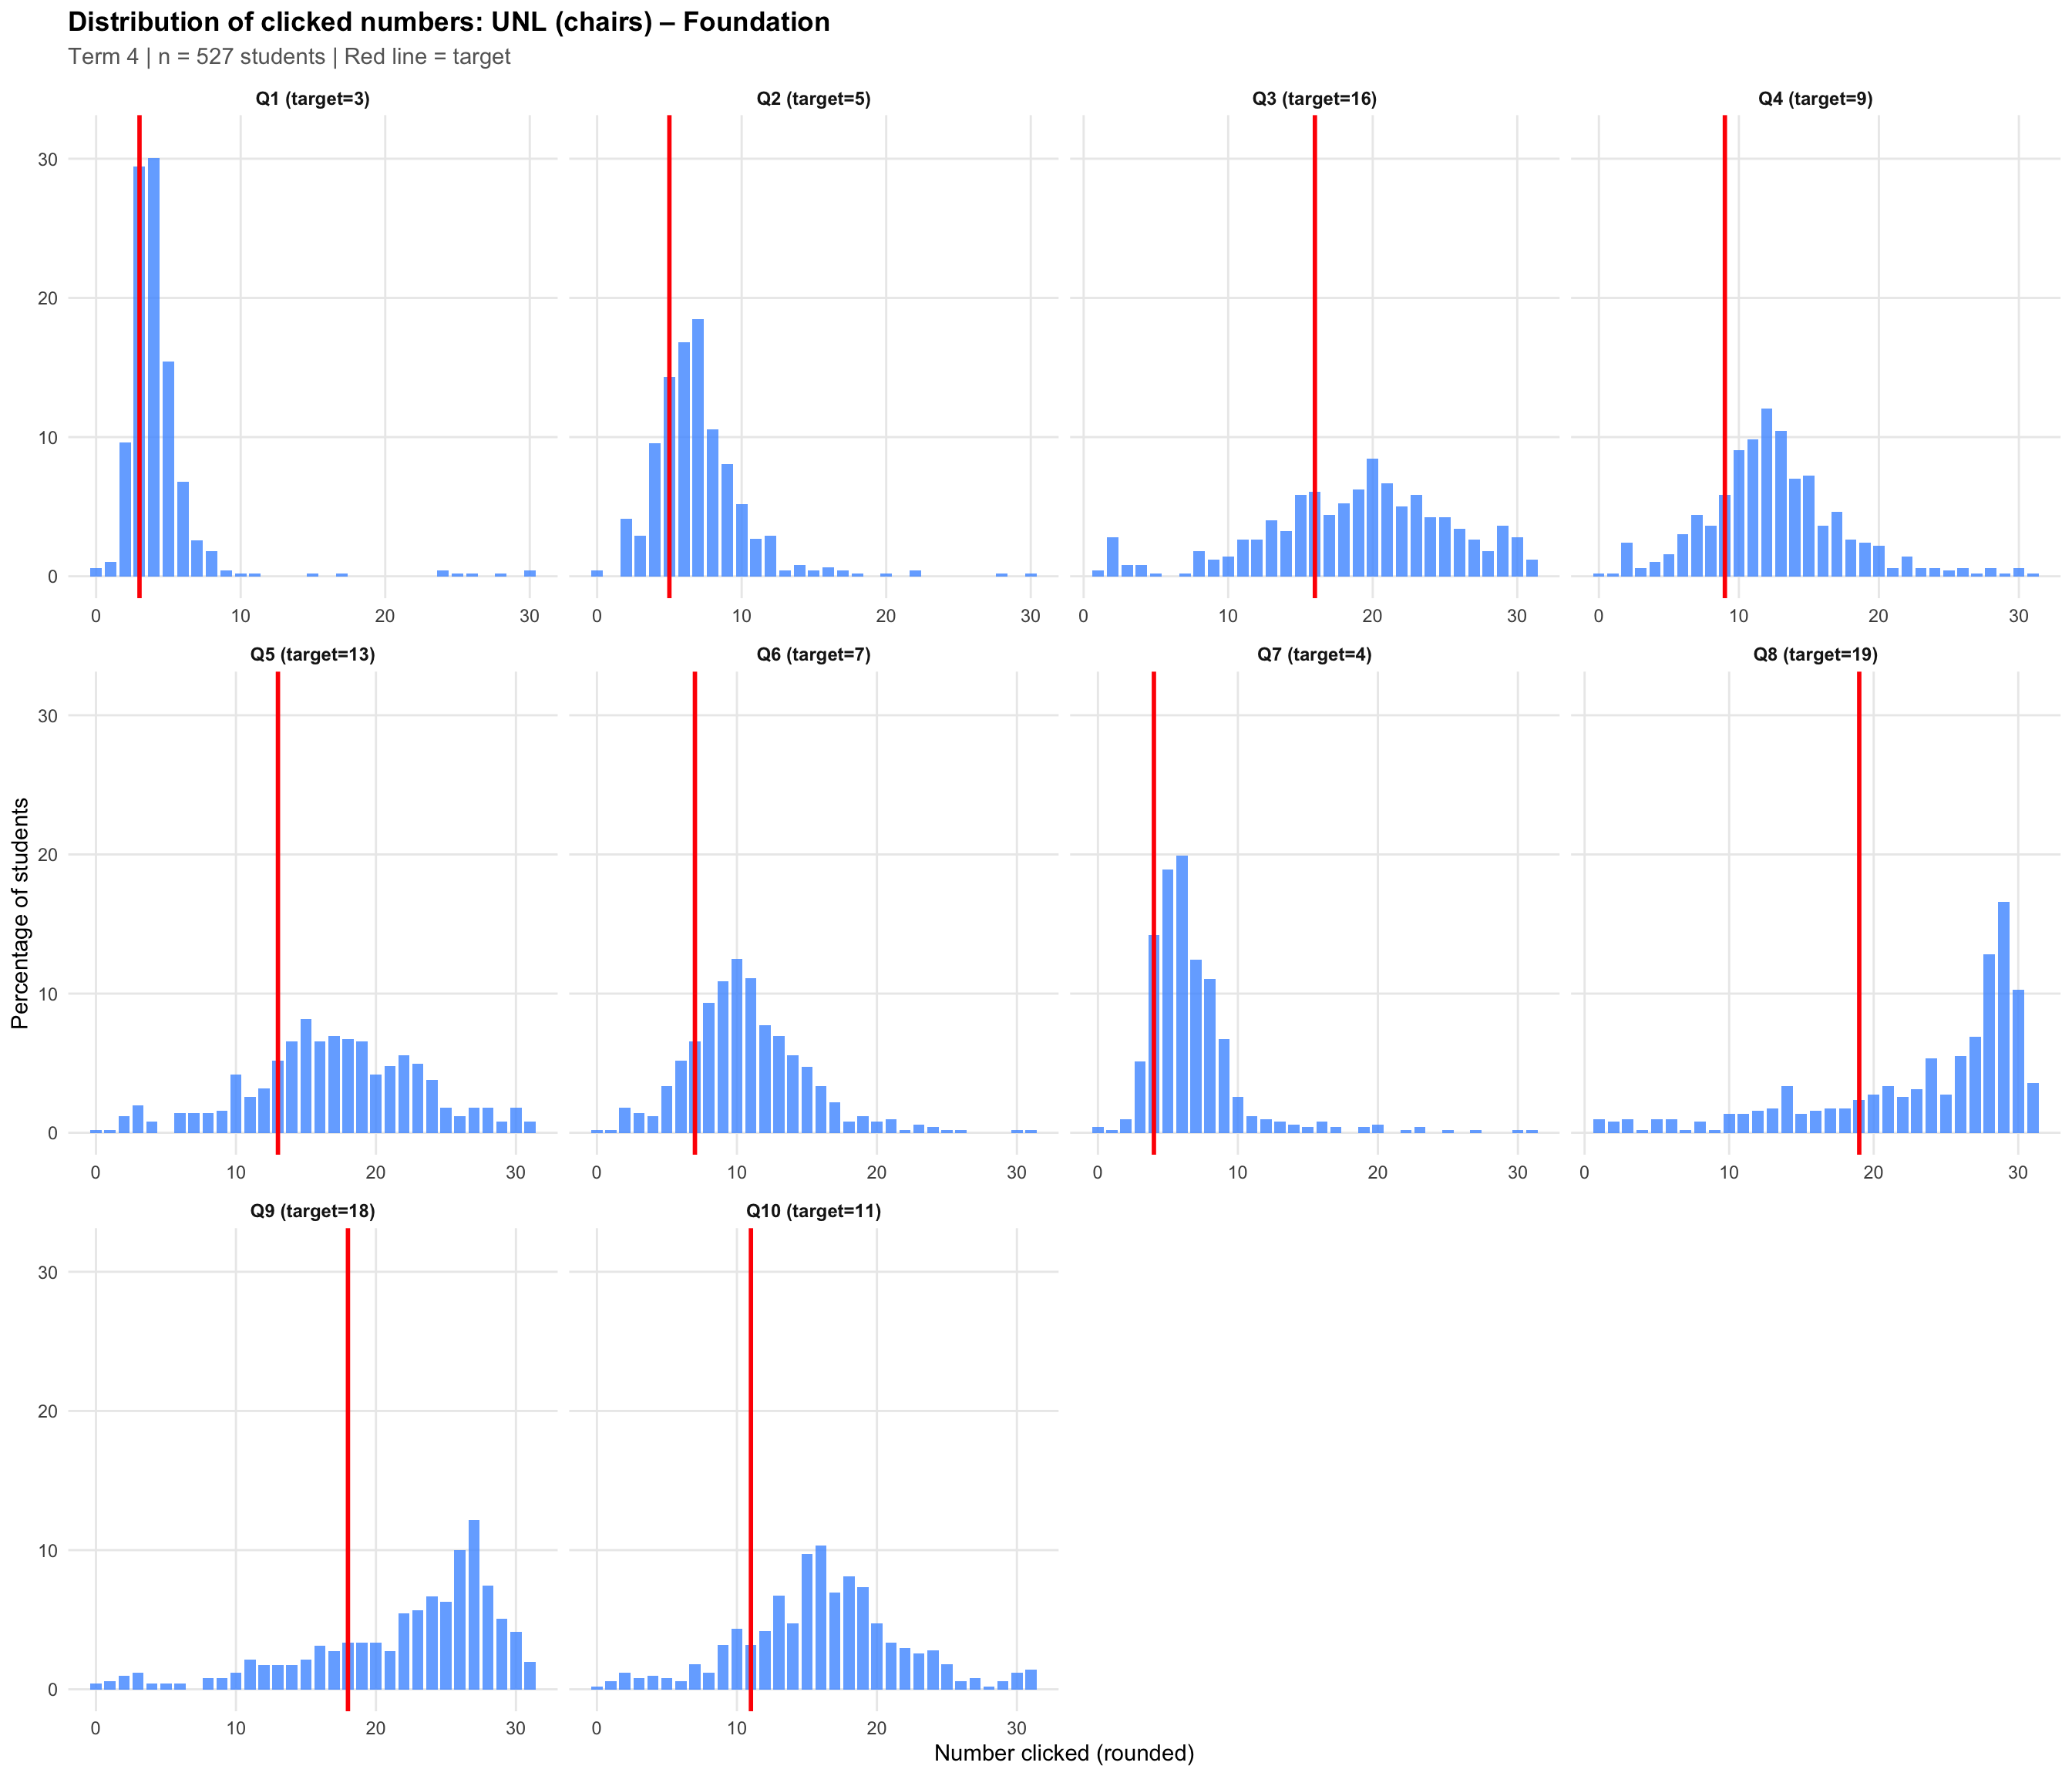
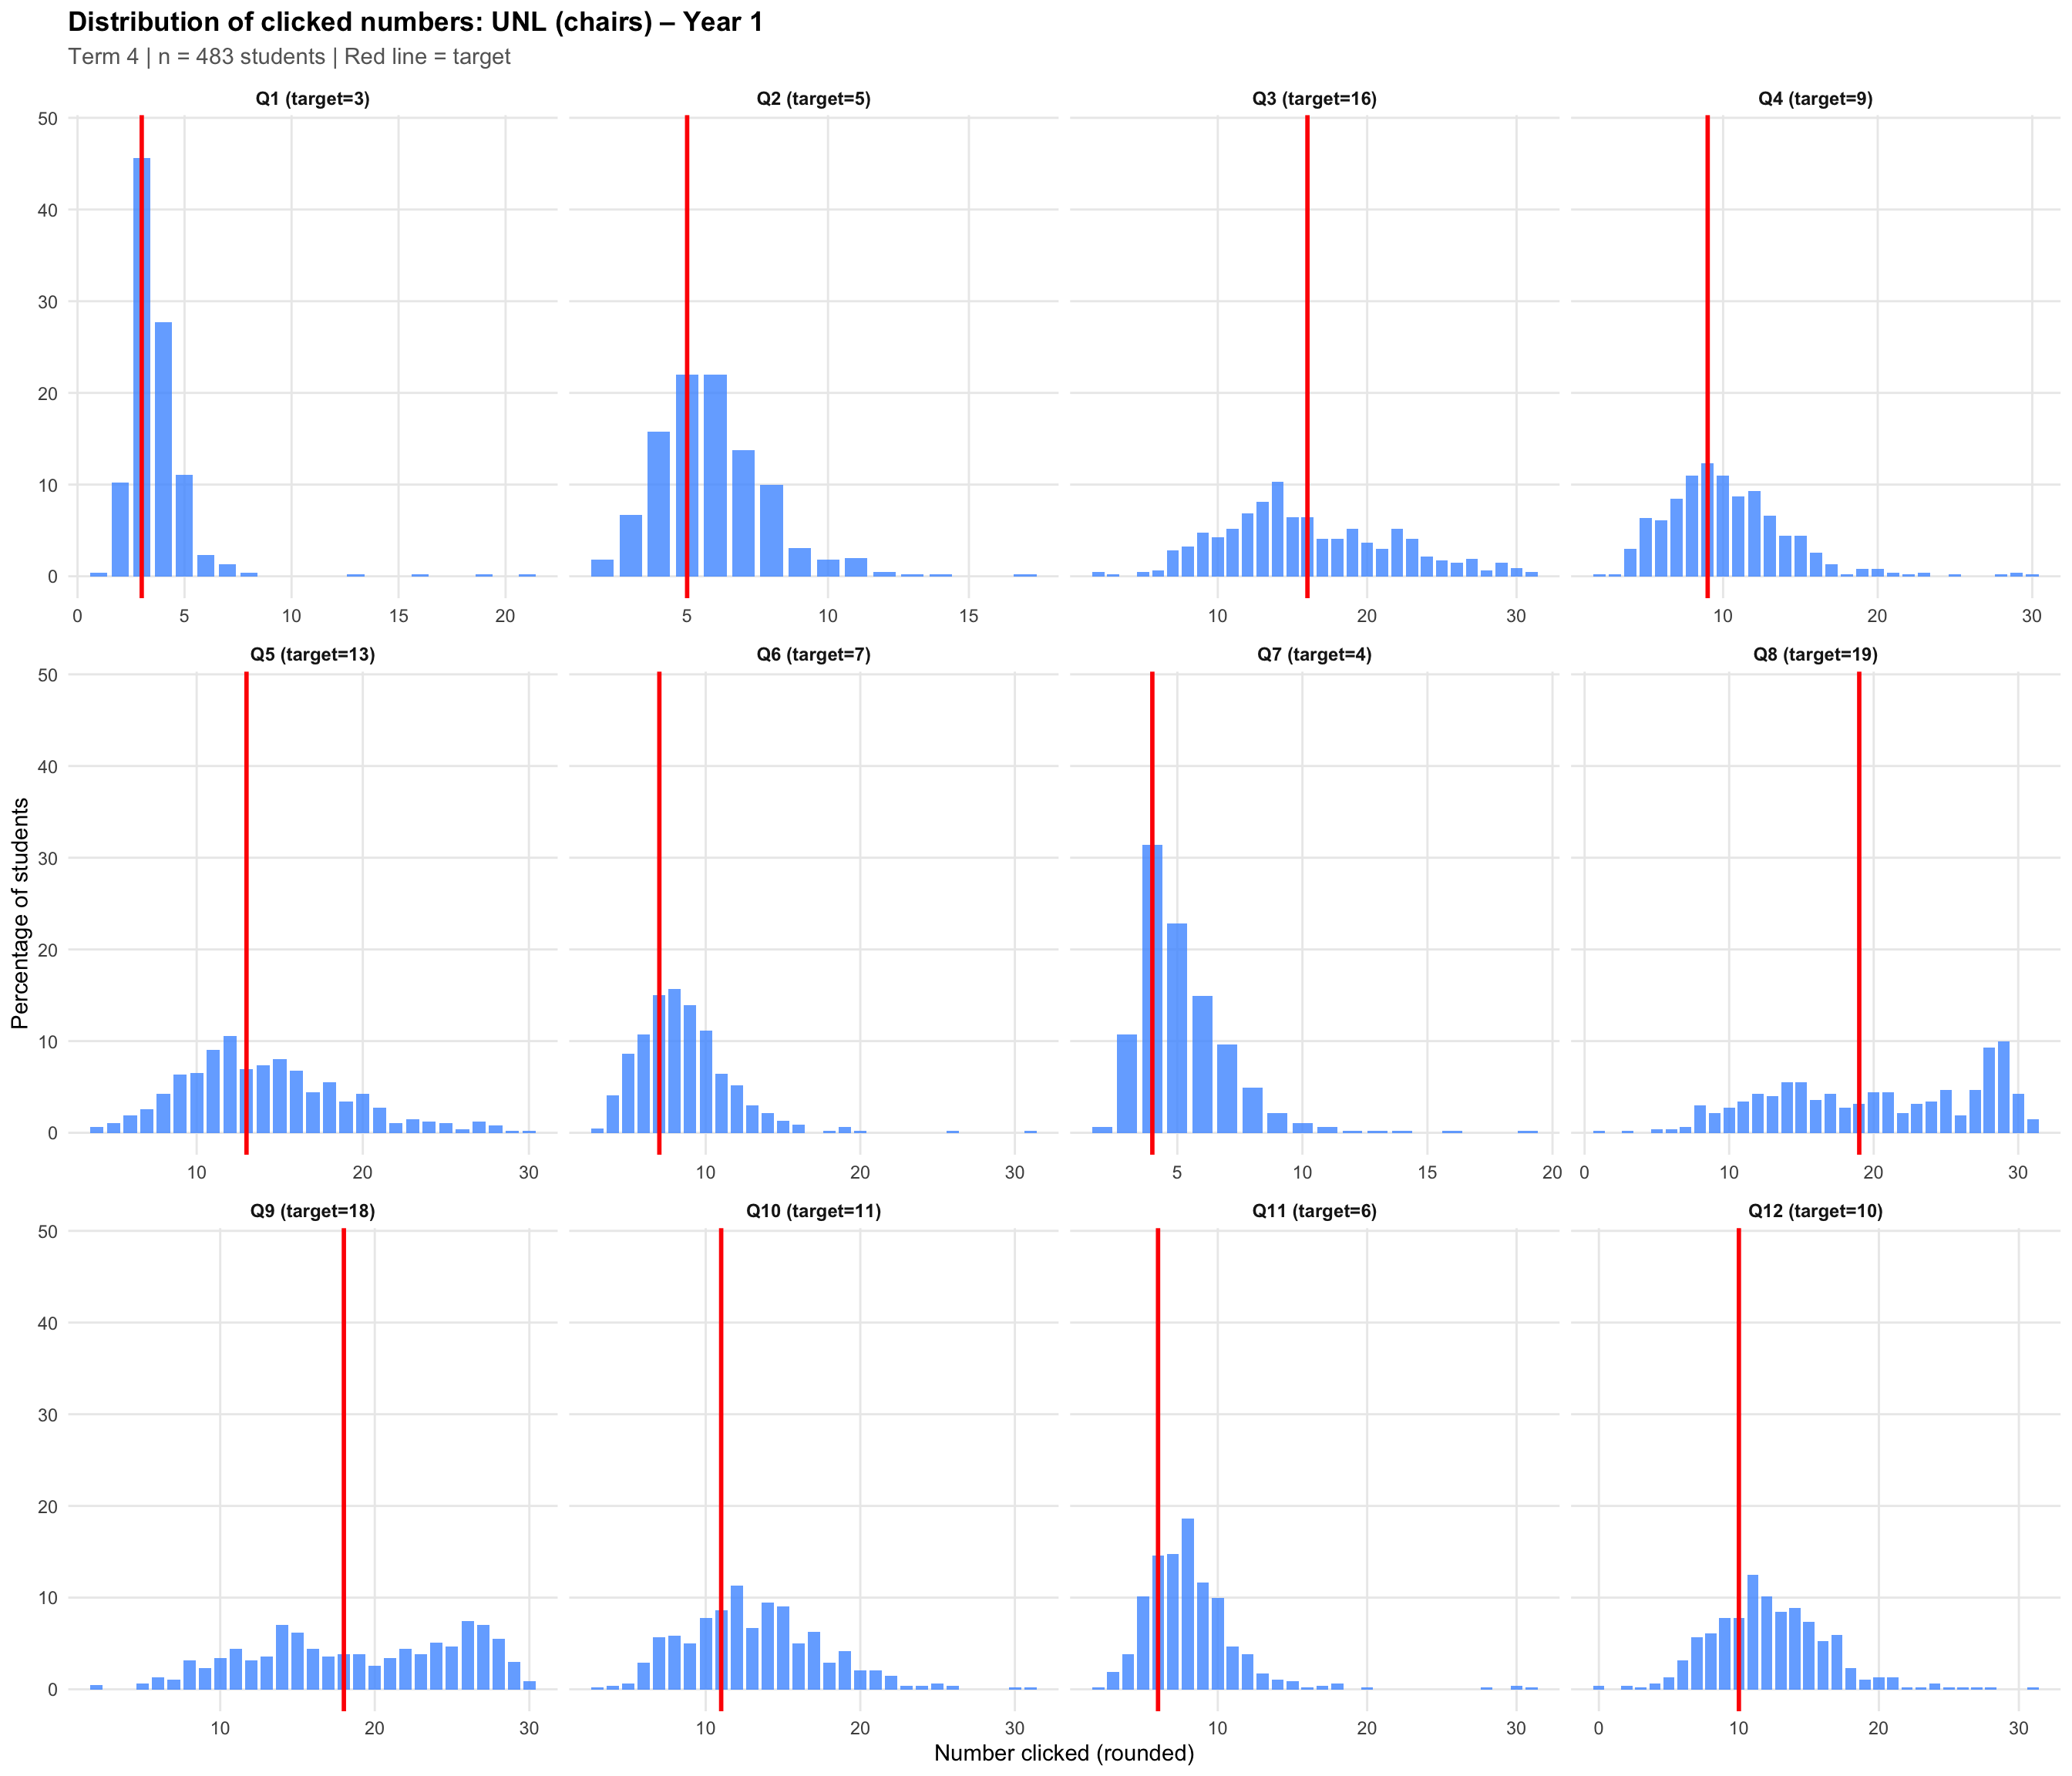
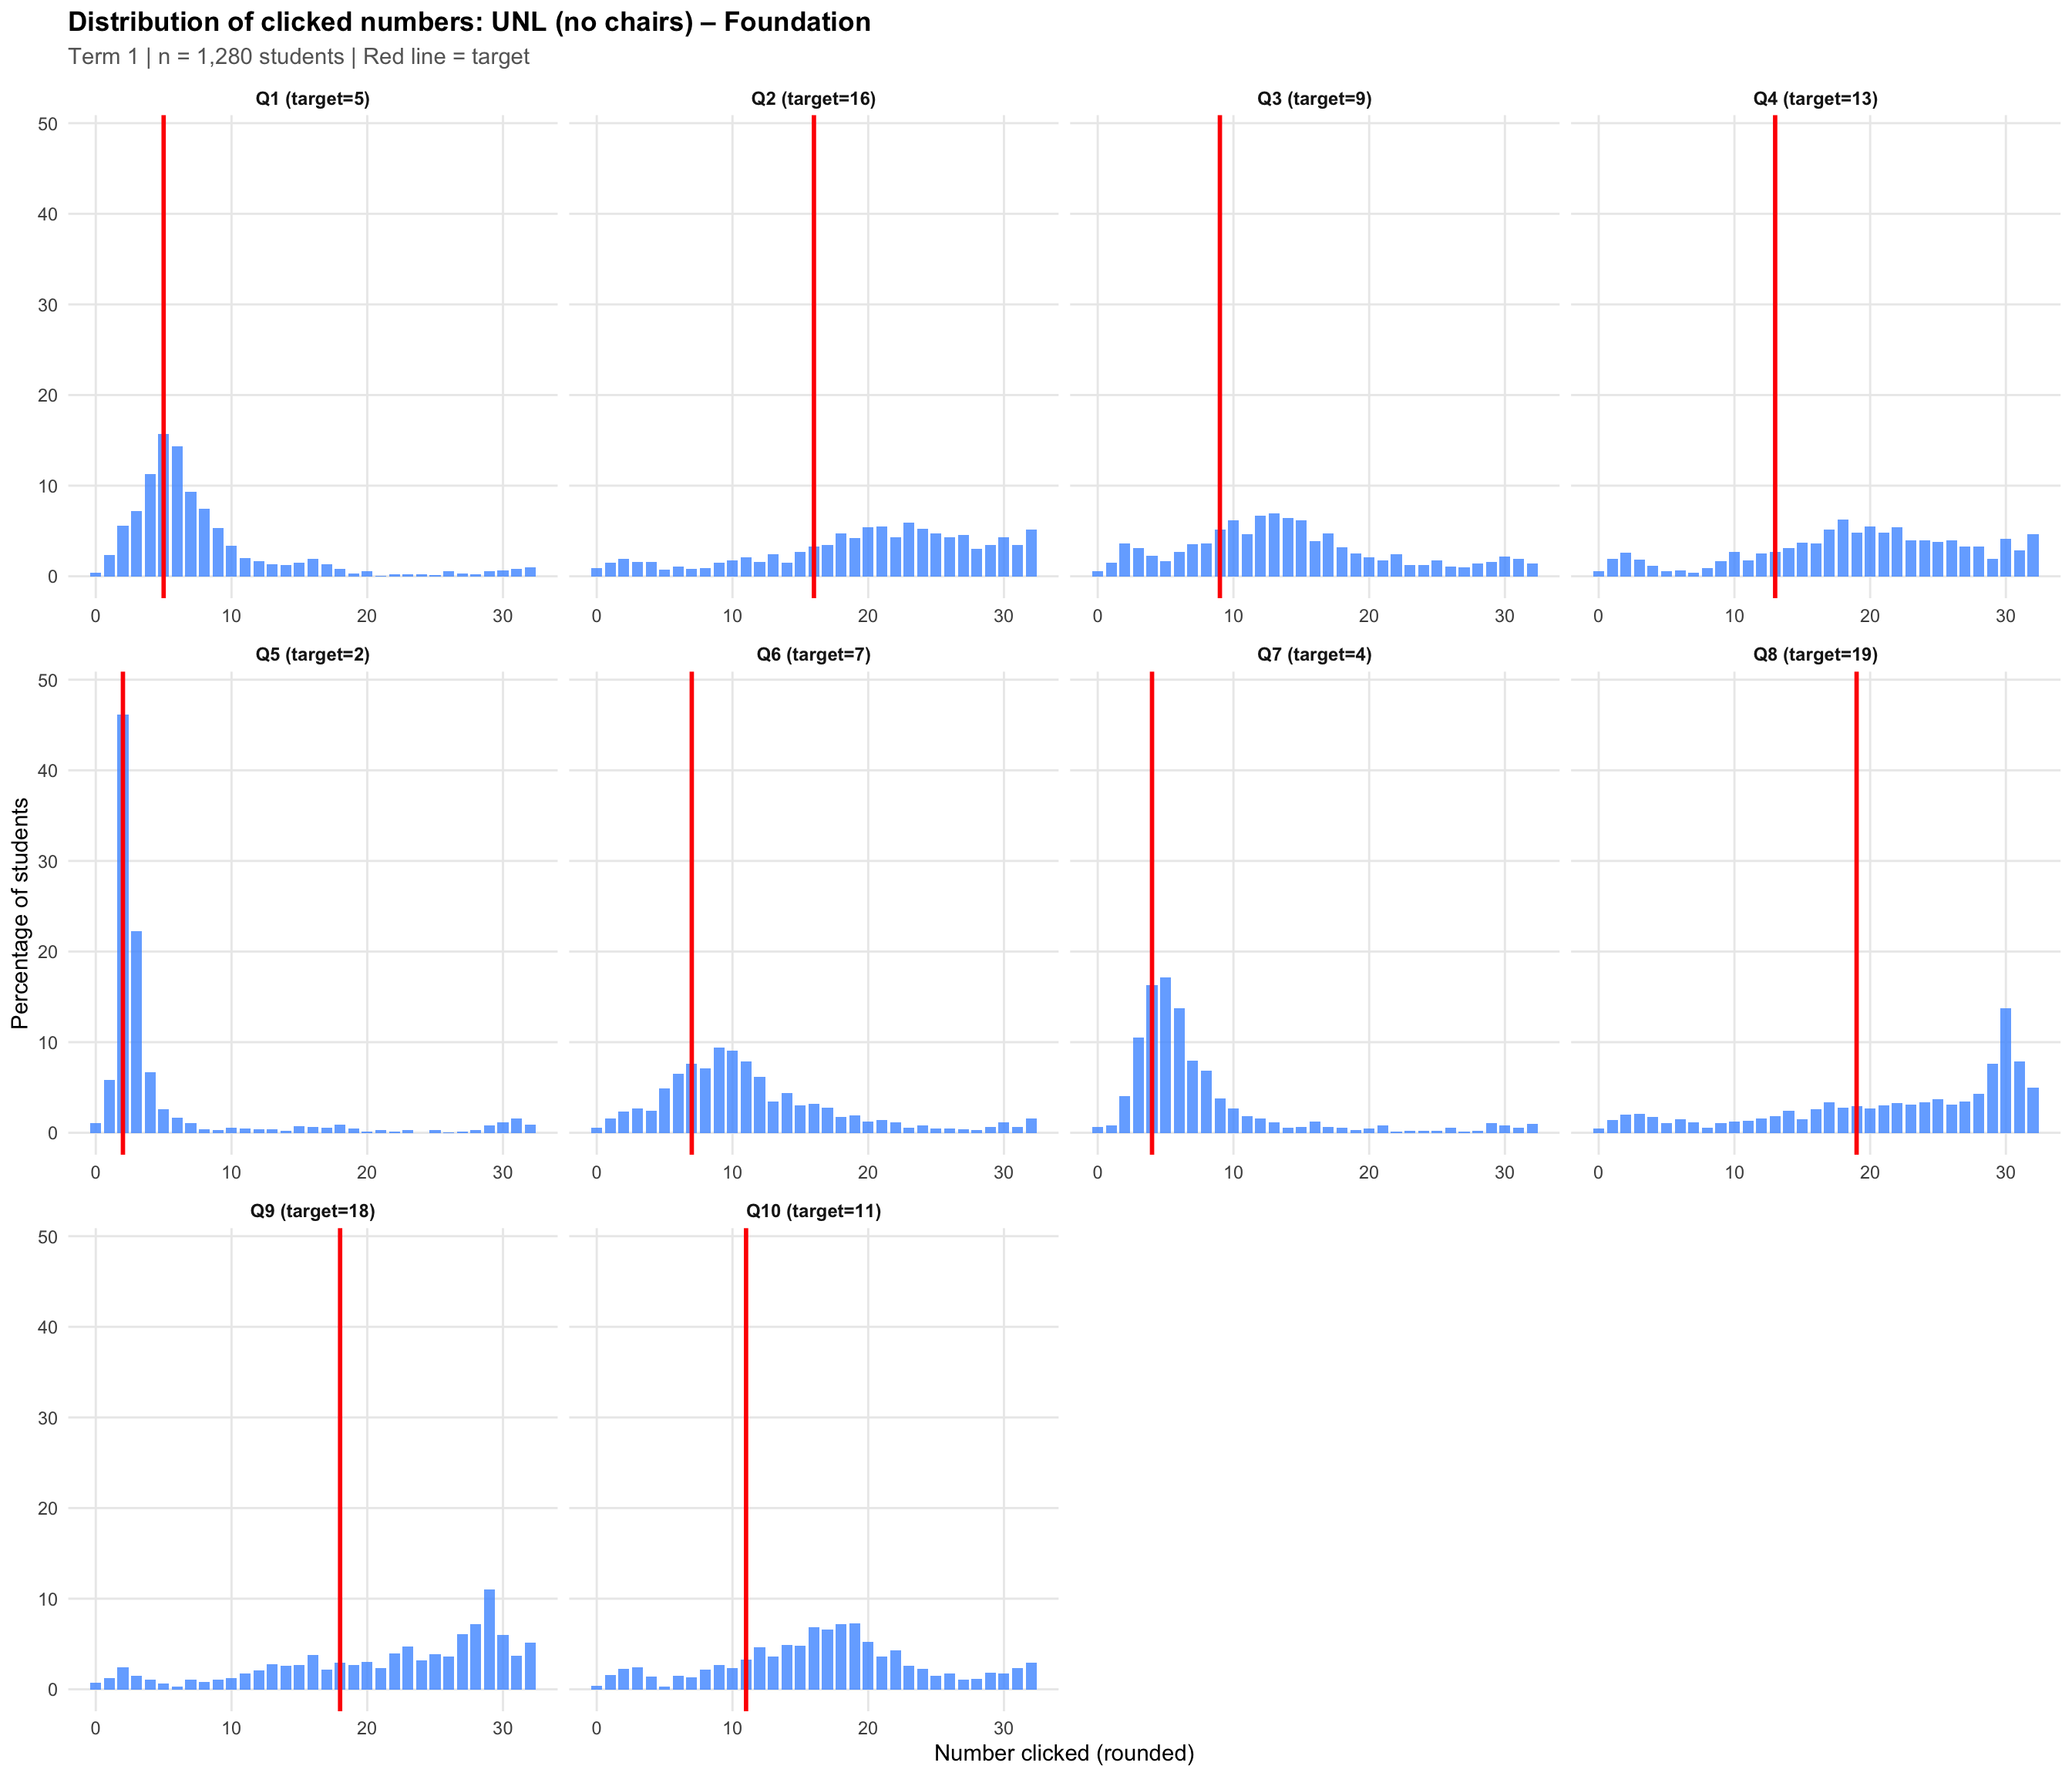
Click on any plot to view an enlarged version in a lightbox popup.
6.1 Bounded Number Line (BNL)
6.2 Unbounded Number Line – Chairs
6.3 Unbounded Number Line – No Chairs
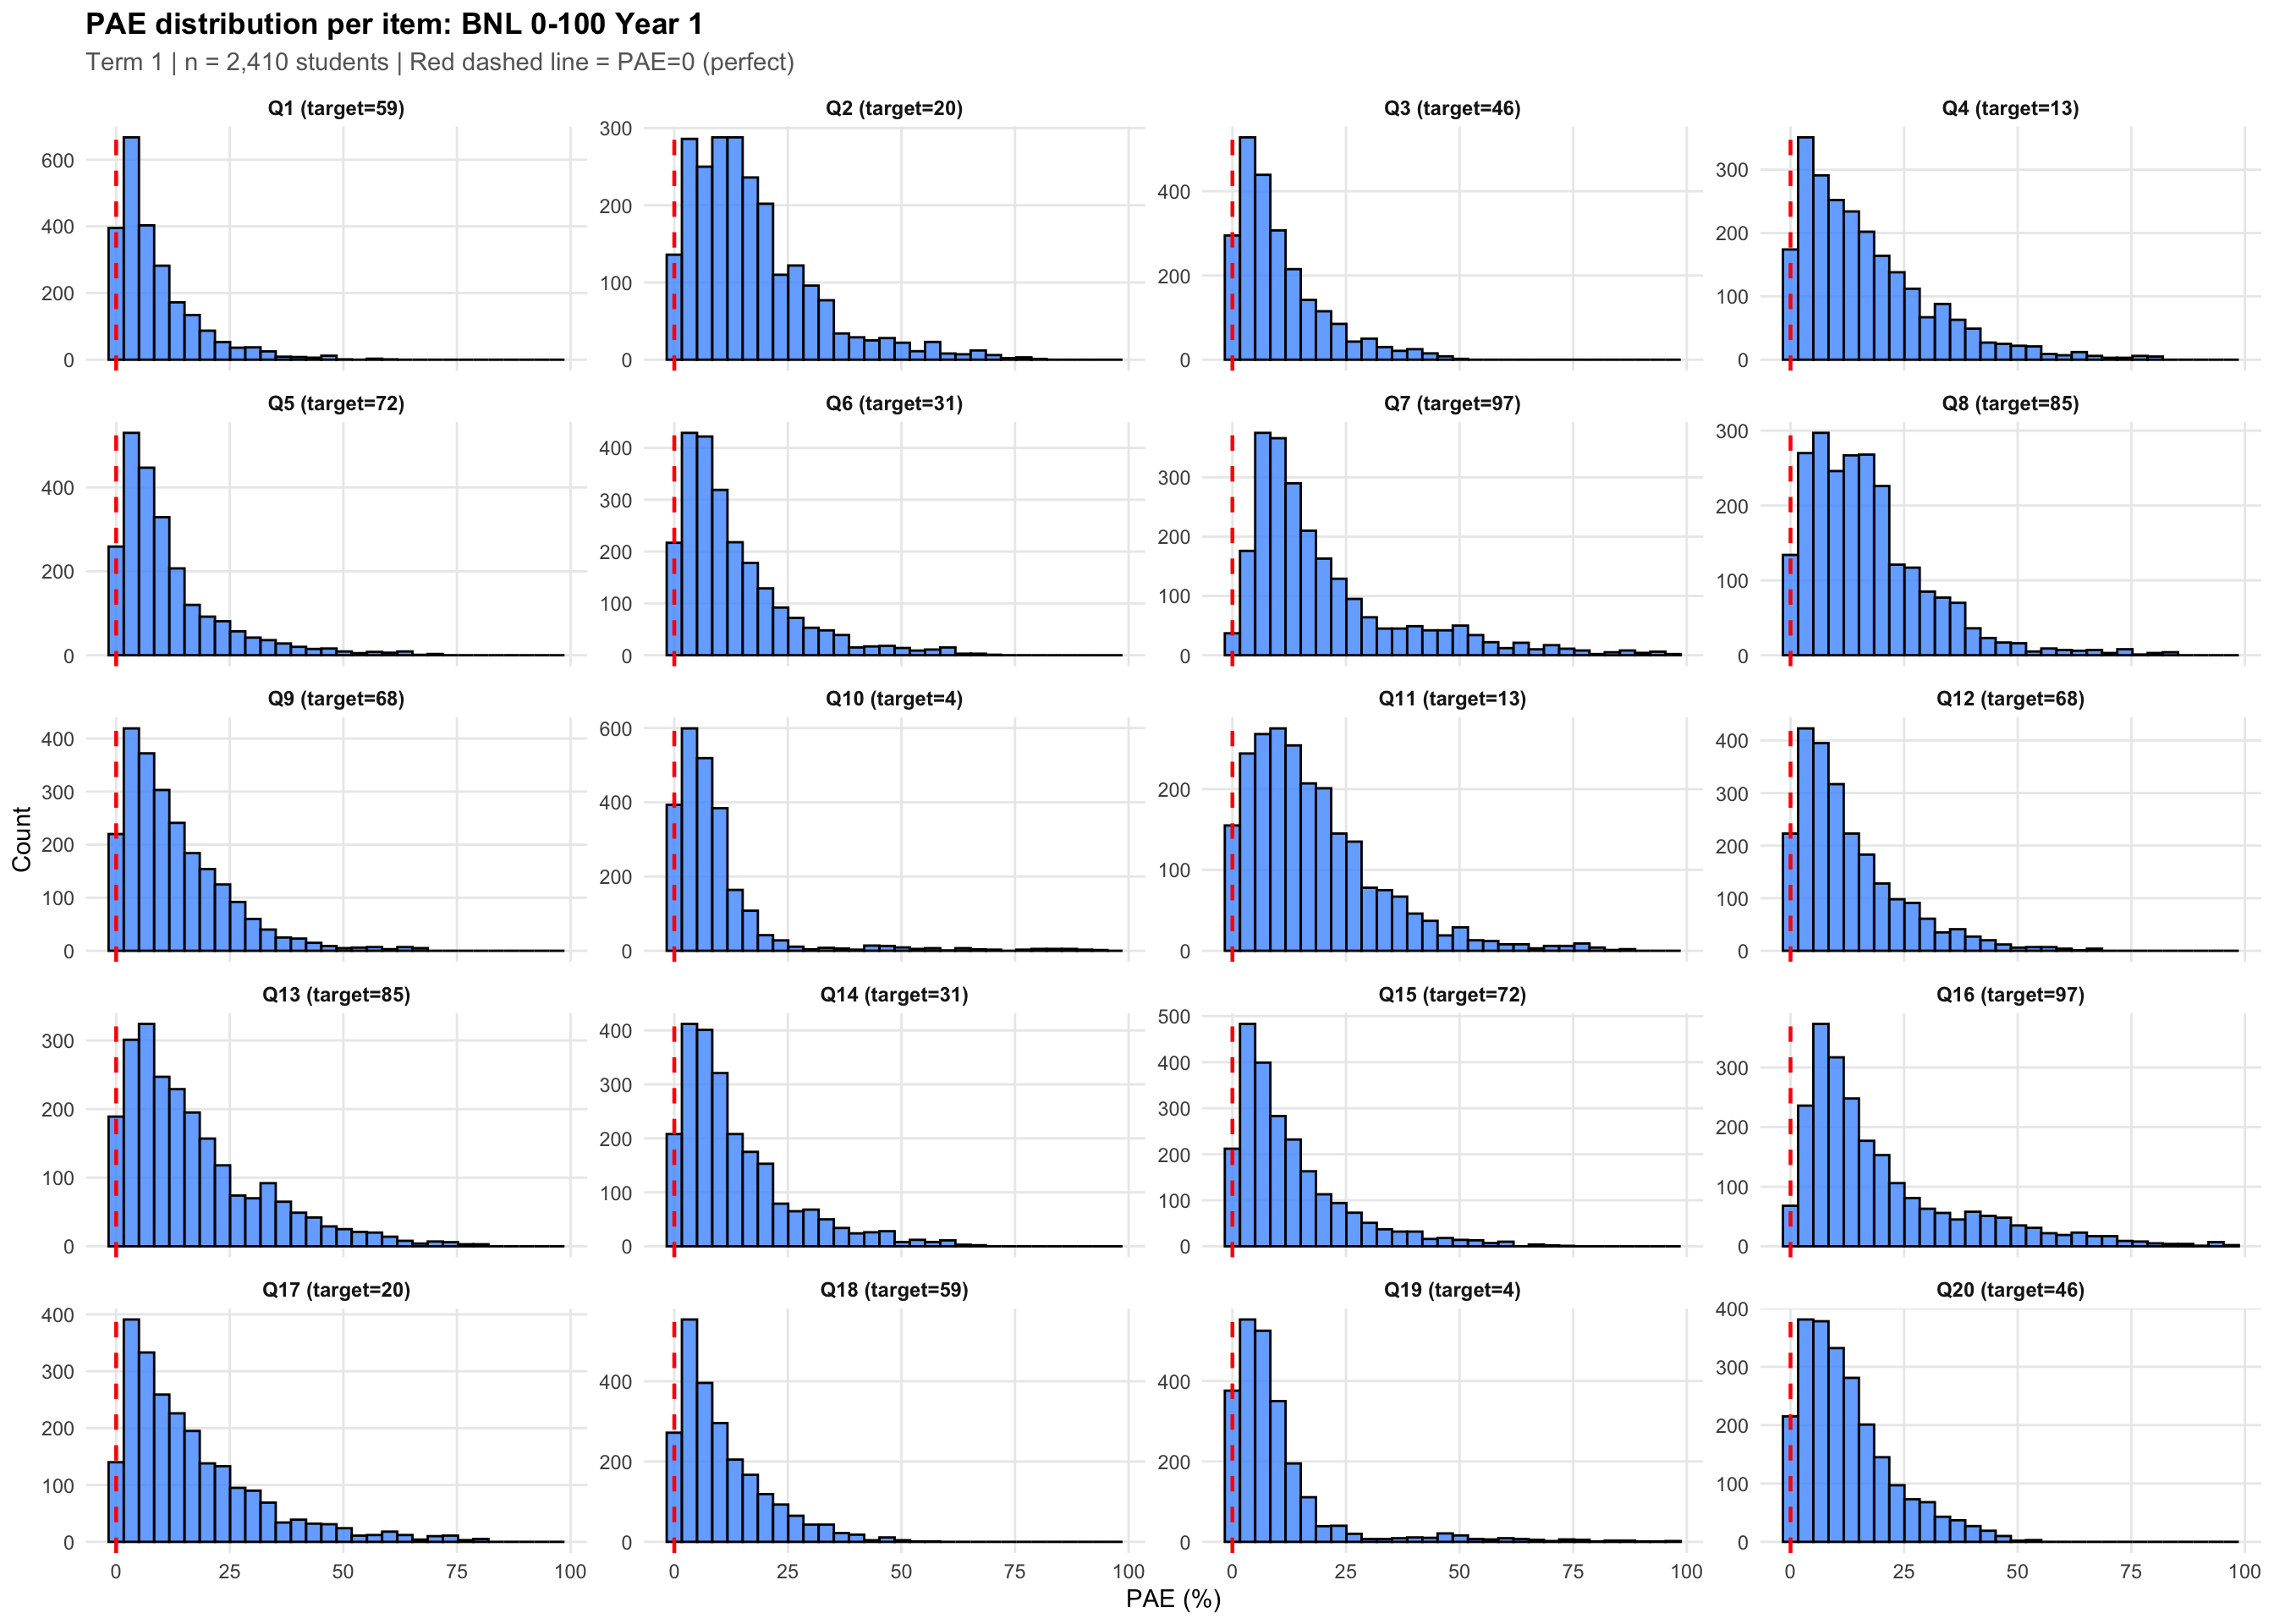
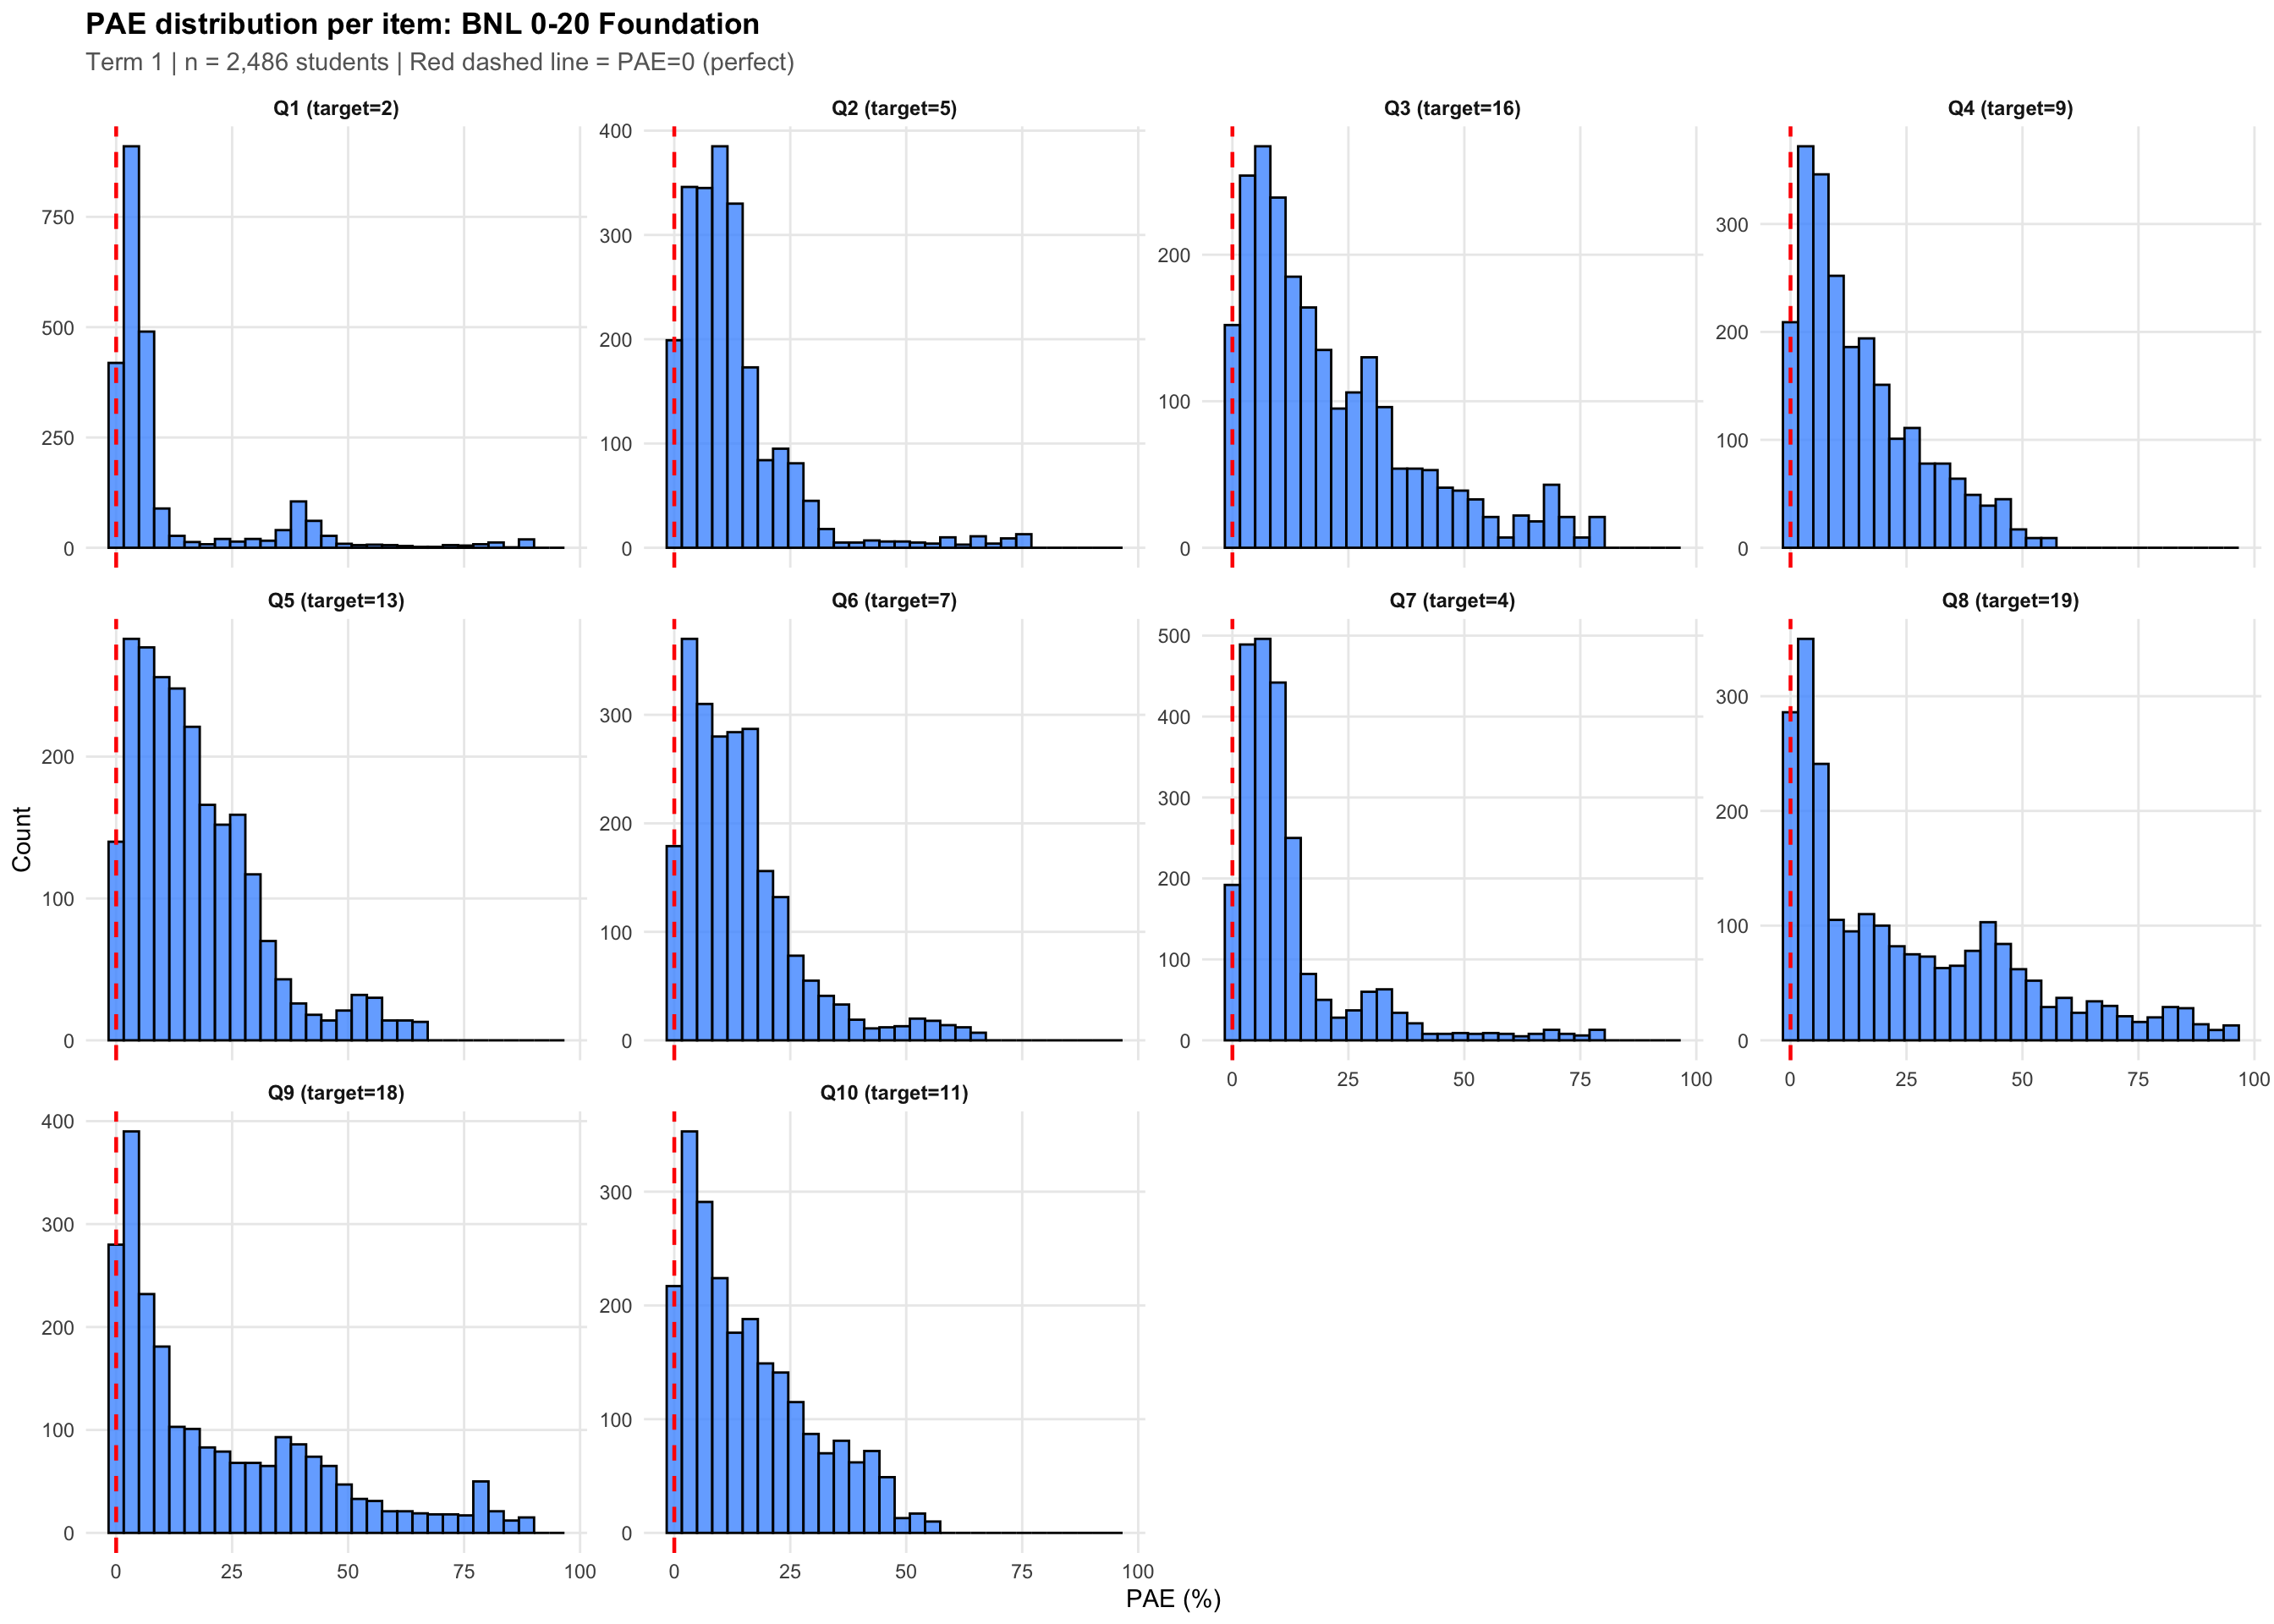
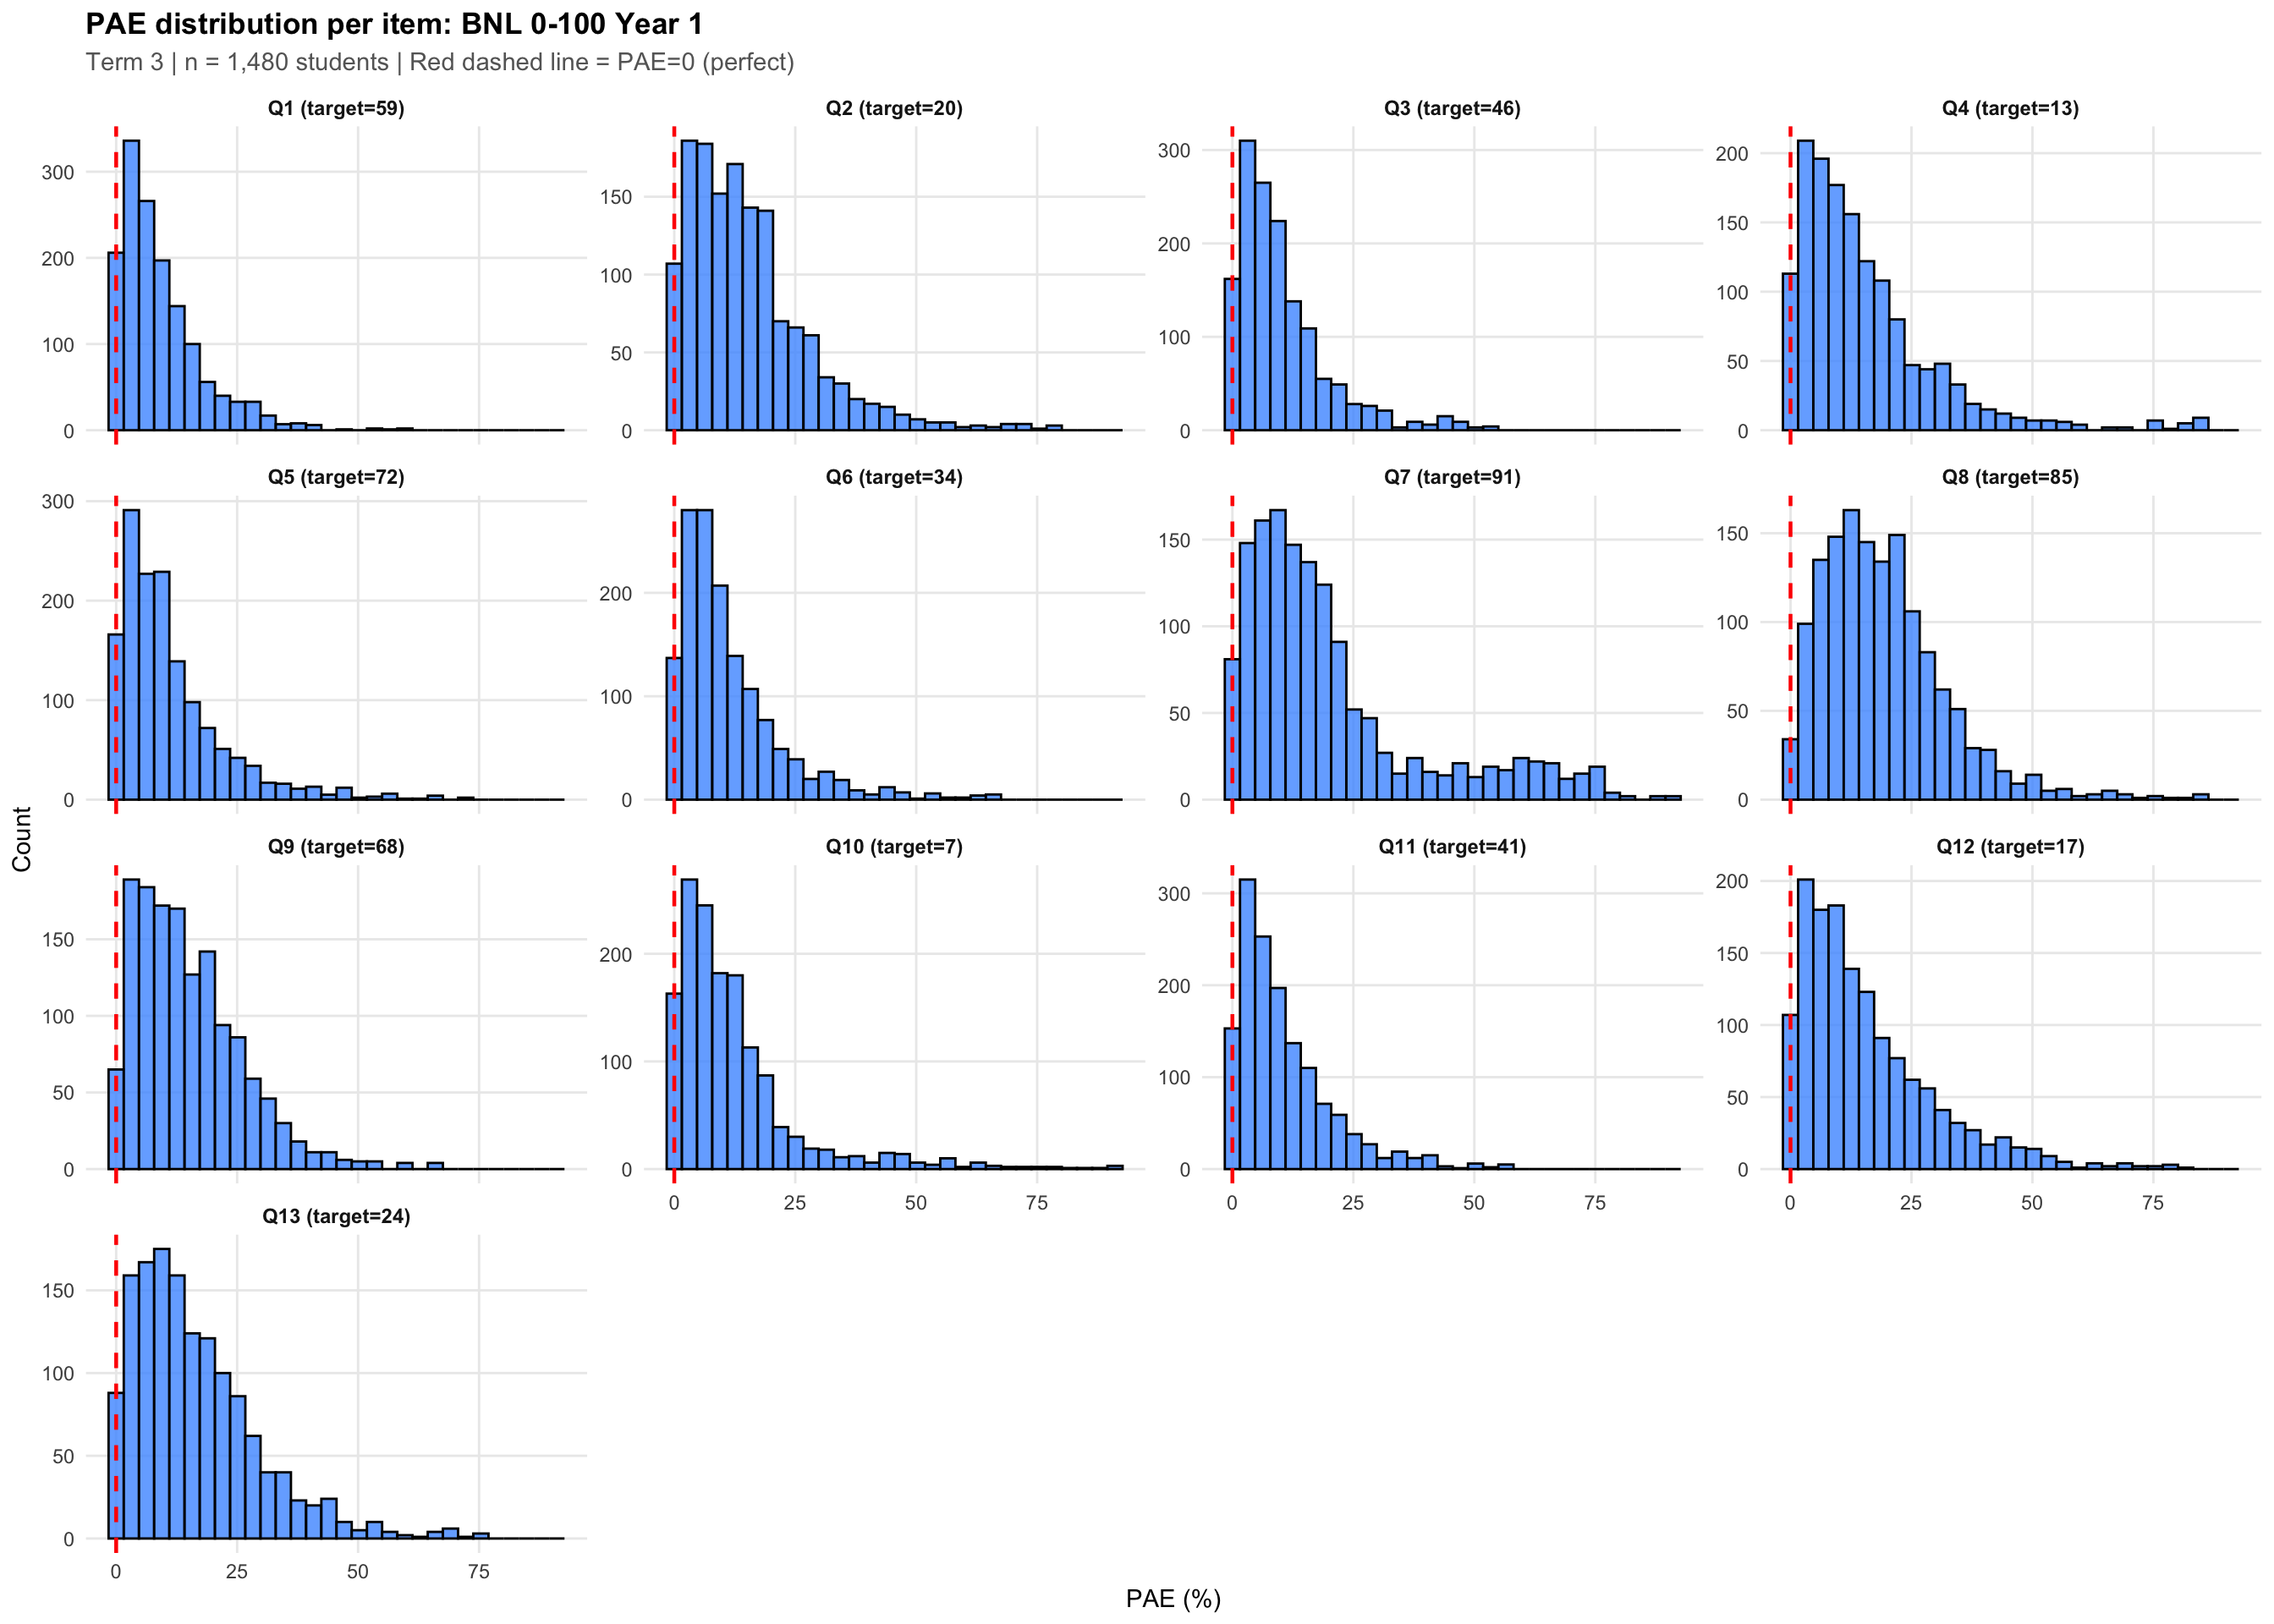
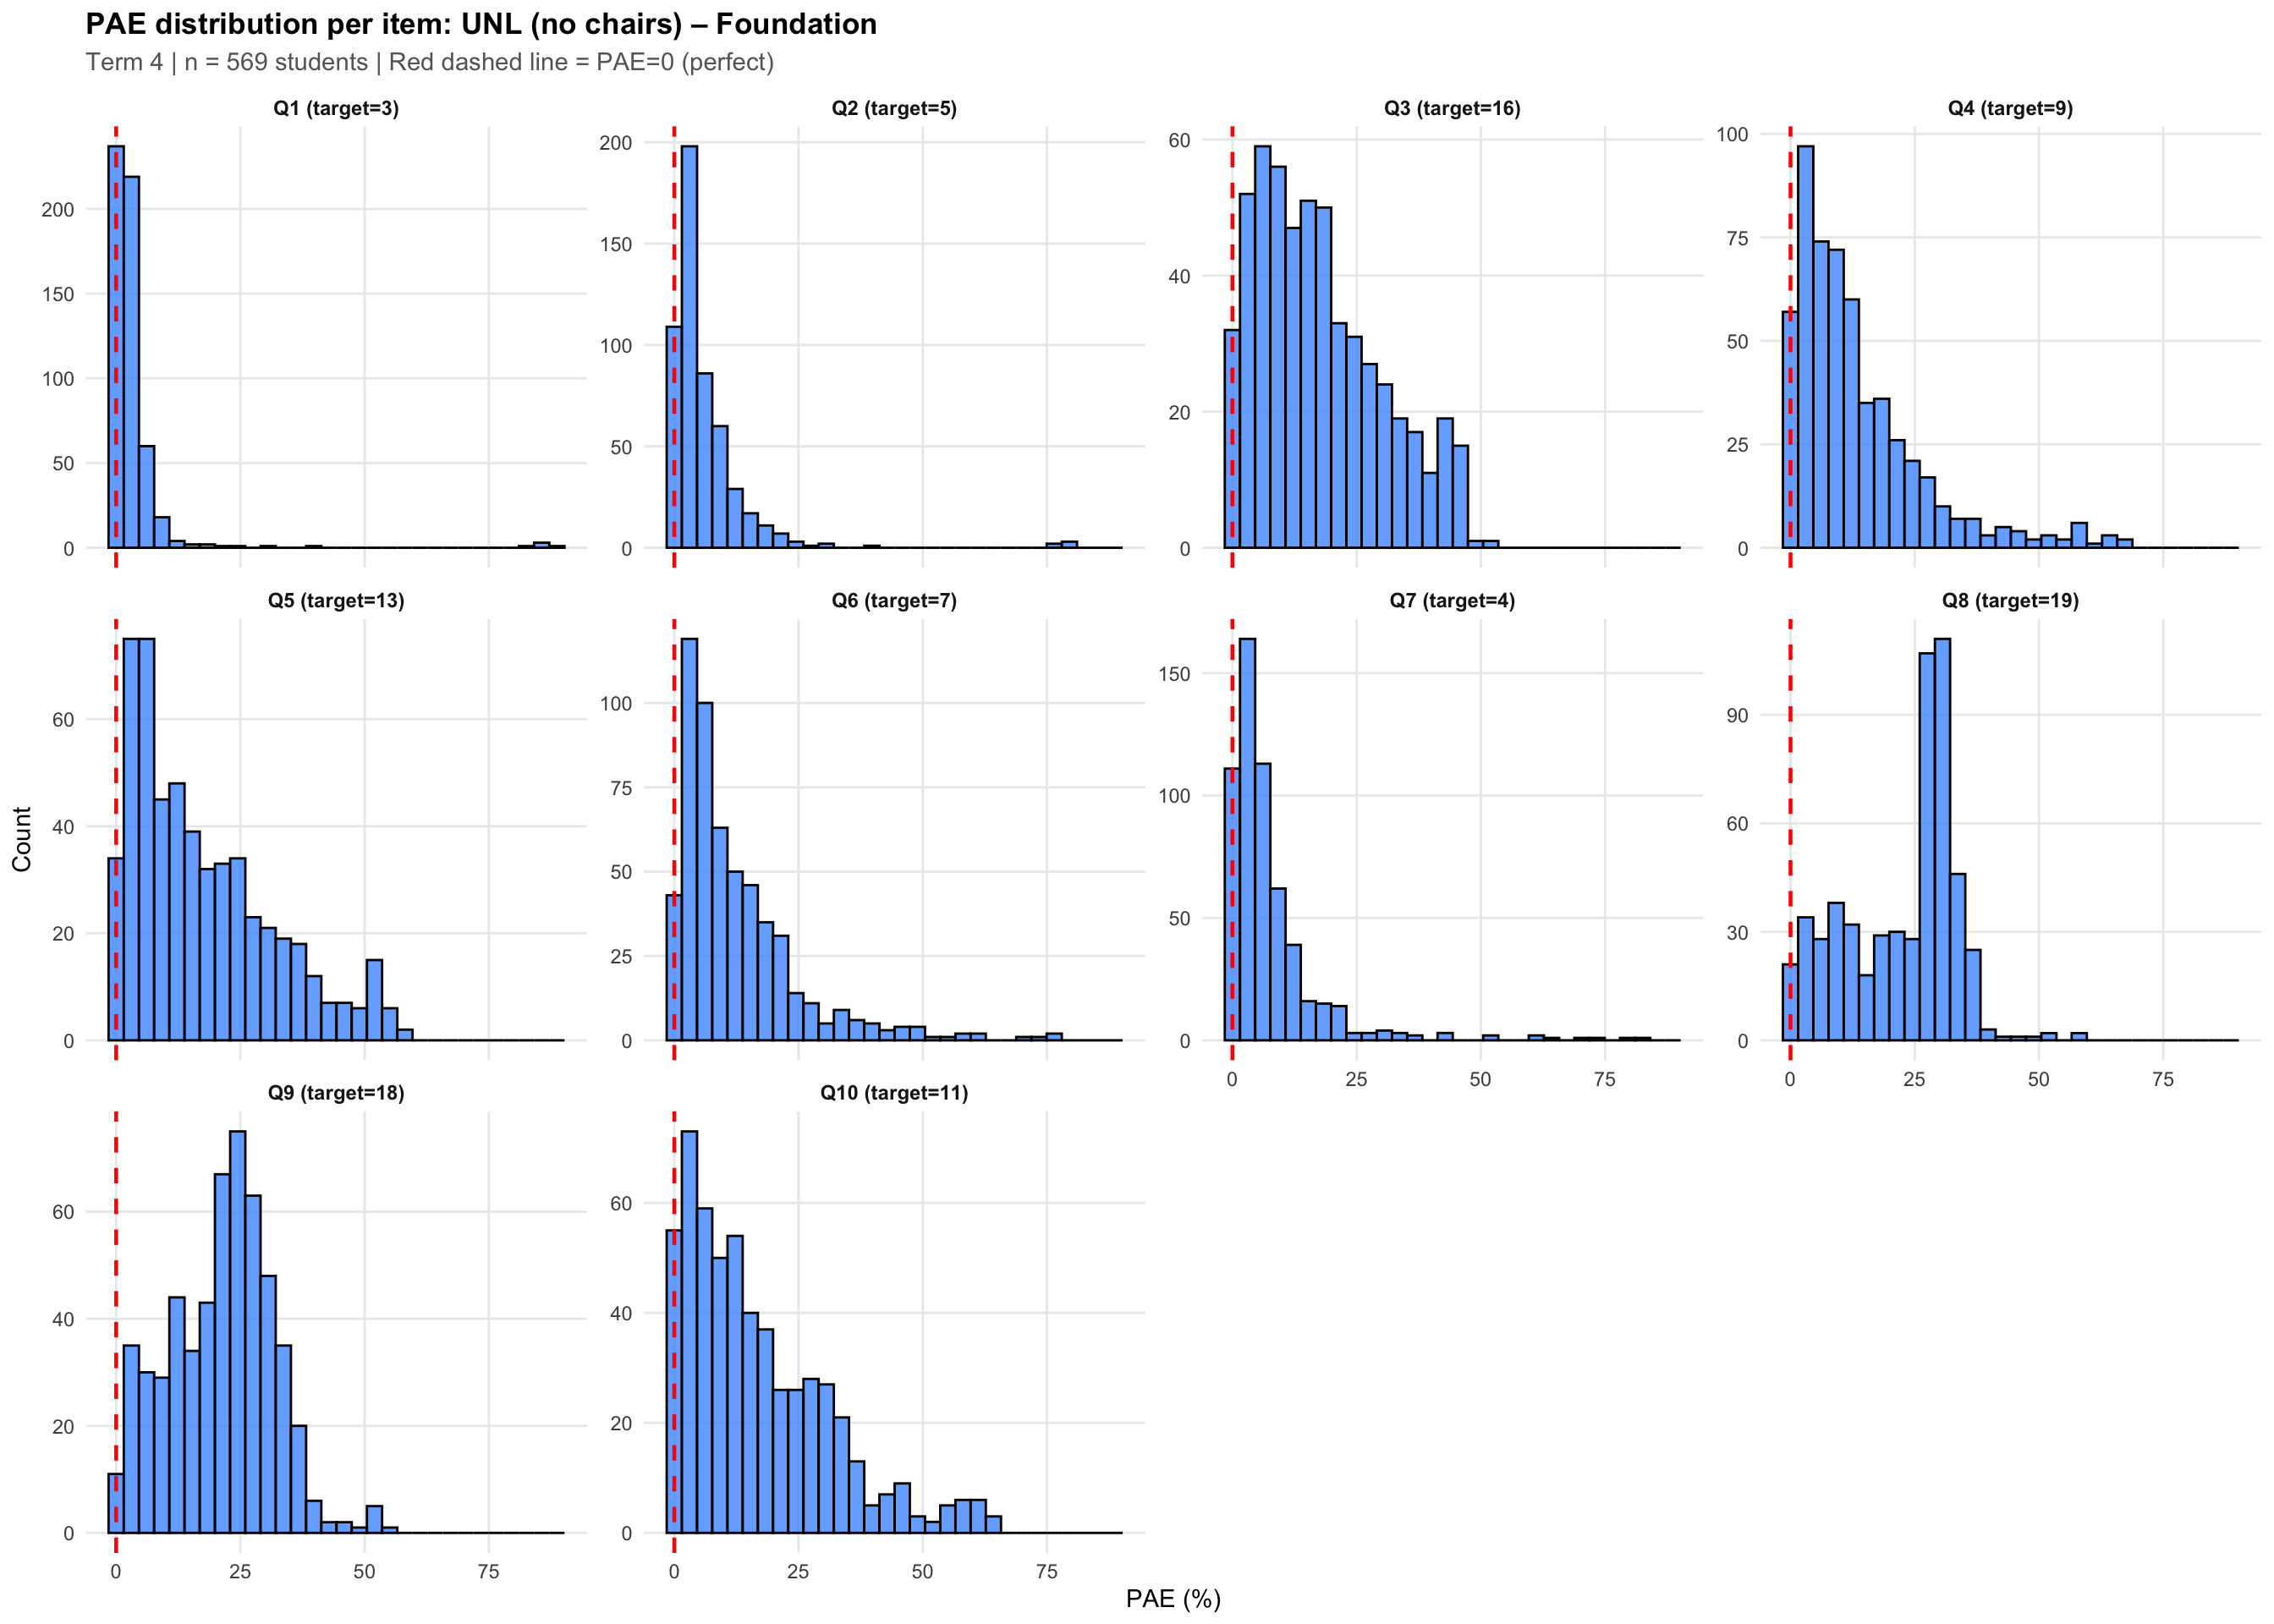
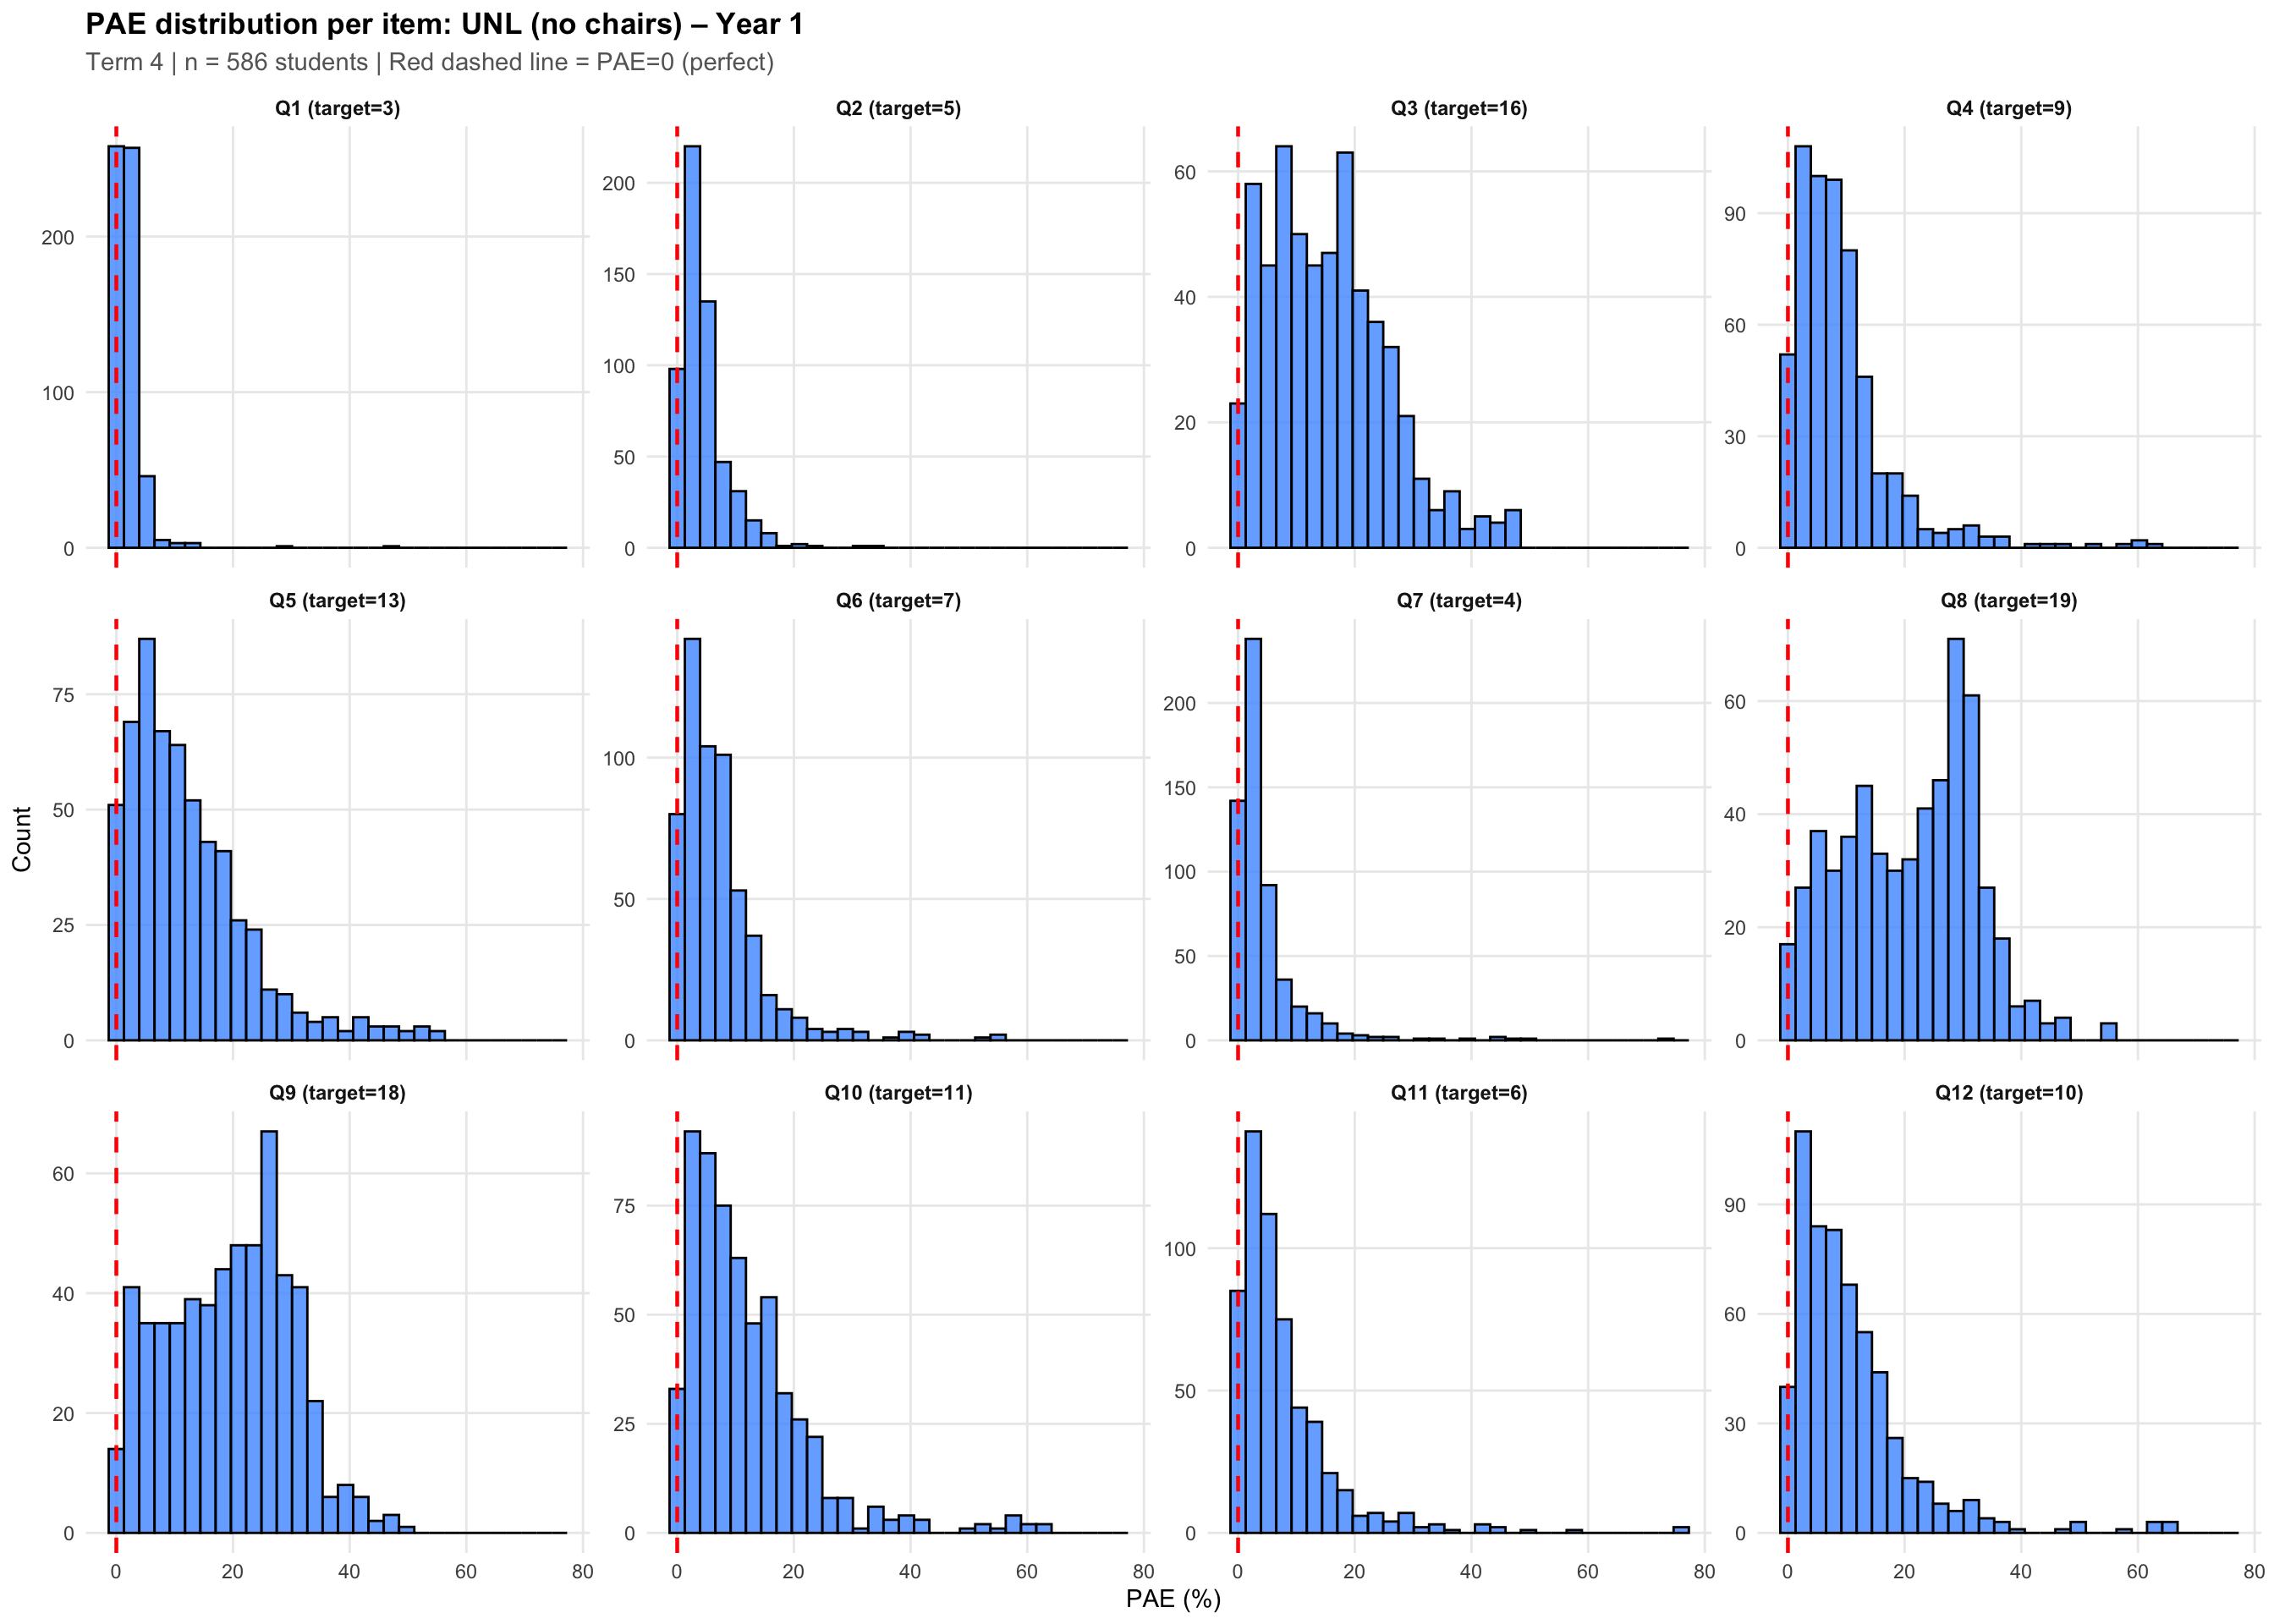
7. Histogram of PAE per item
7.1 Bounded Number Line (BNL)
7.2 Unbounded Number Line – Chairs
7.3 Unbounded Number Line – No Chairs
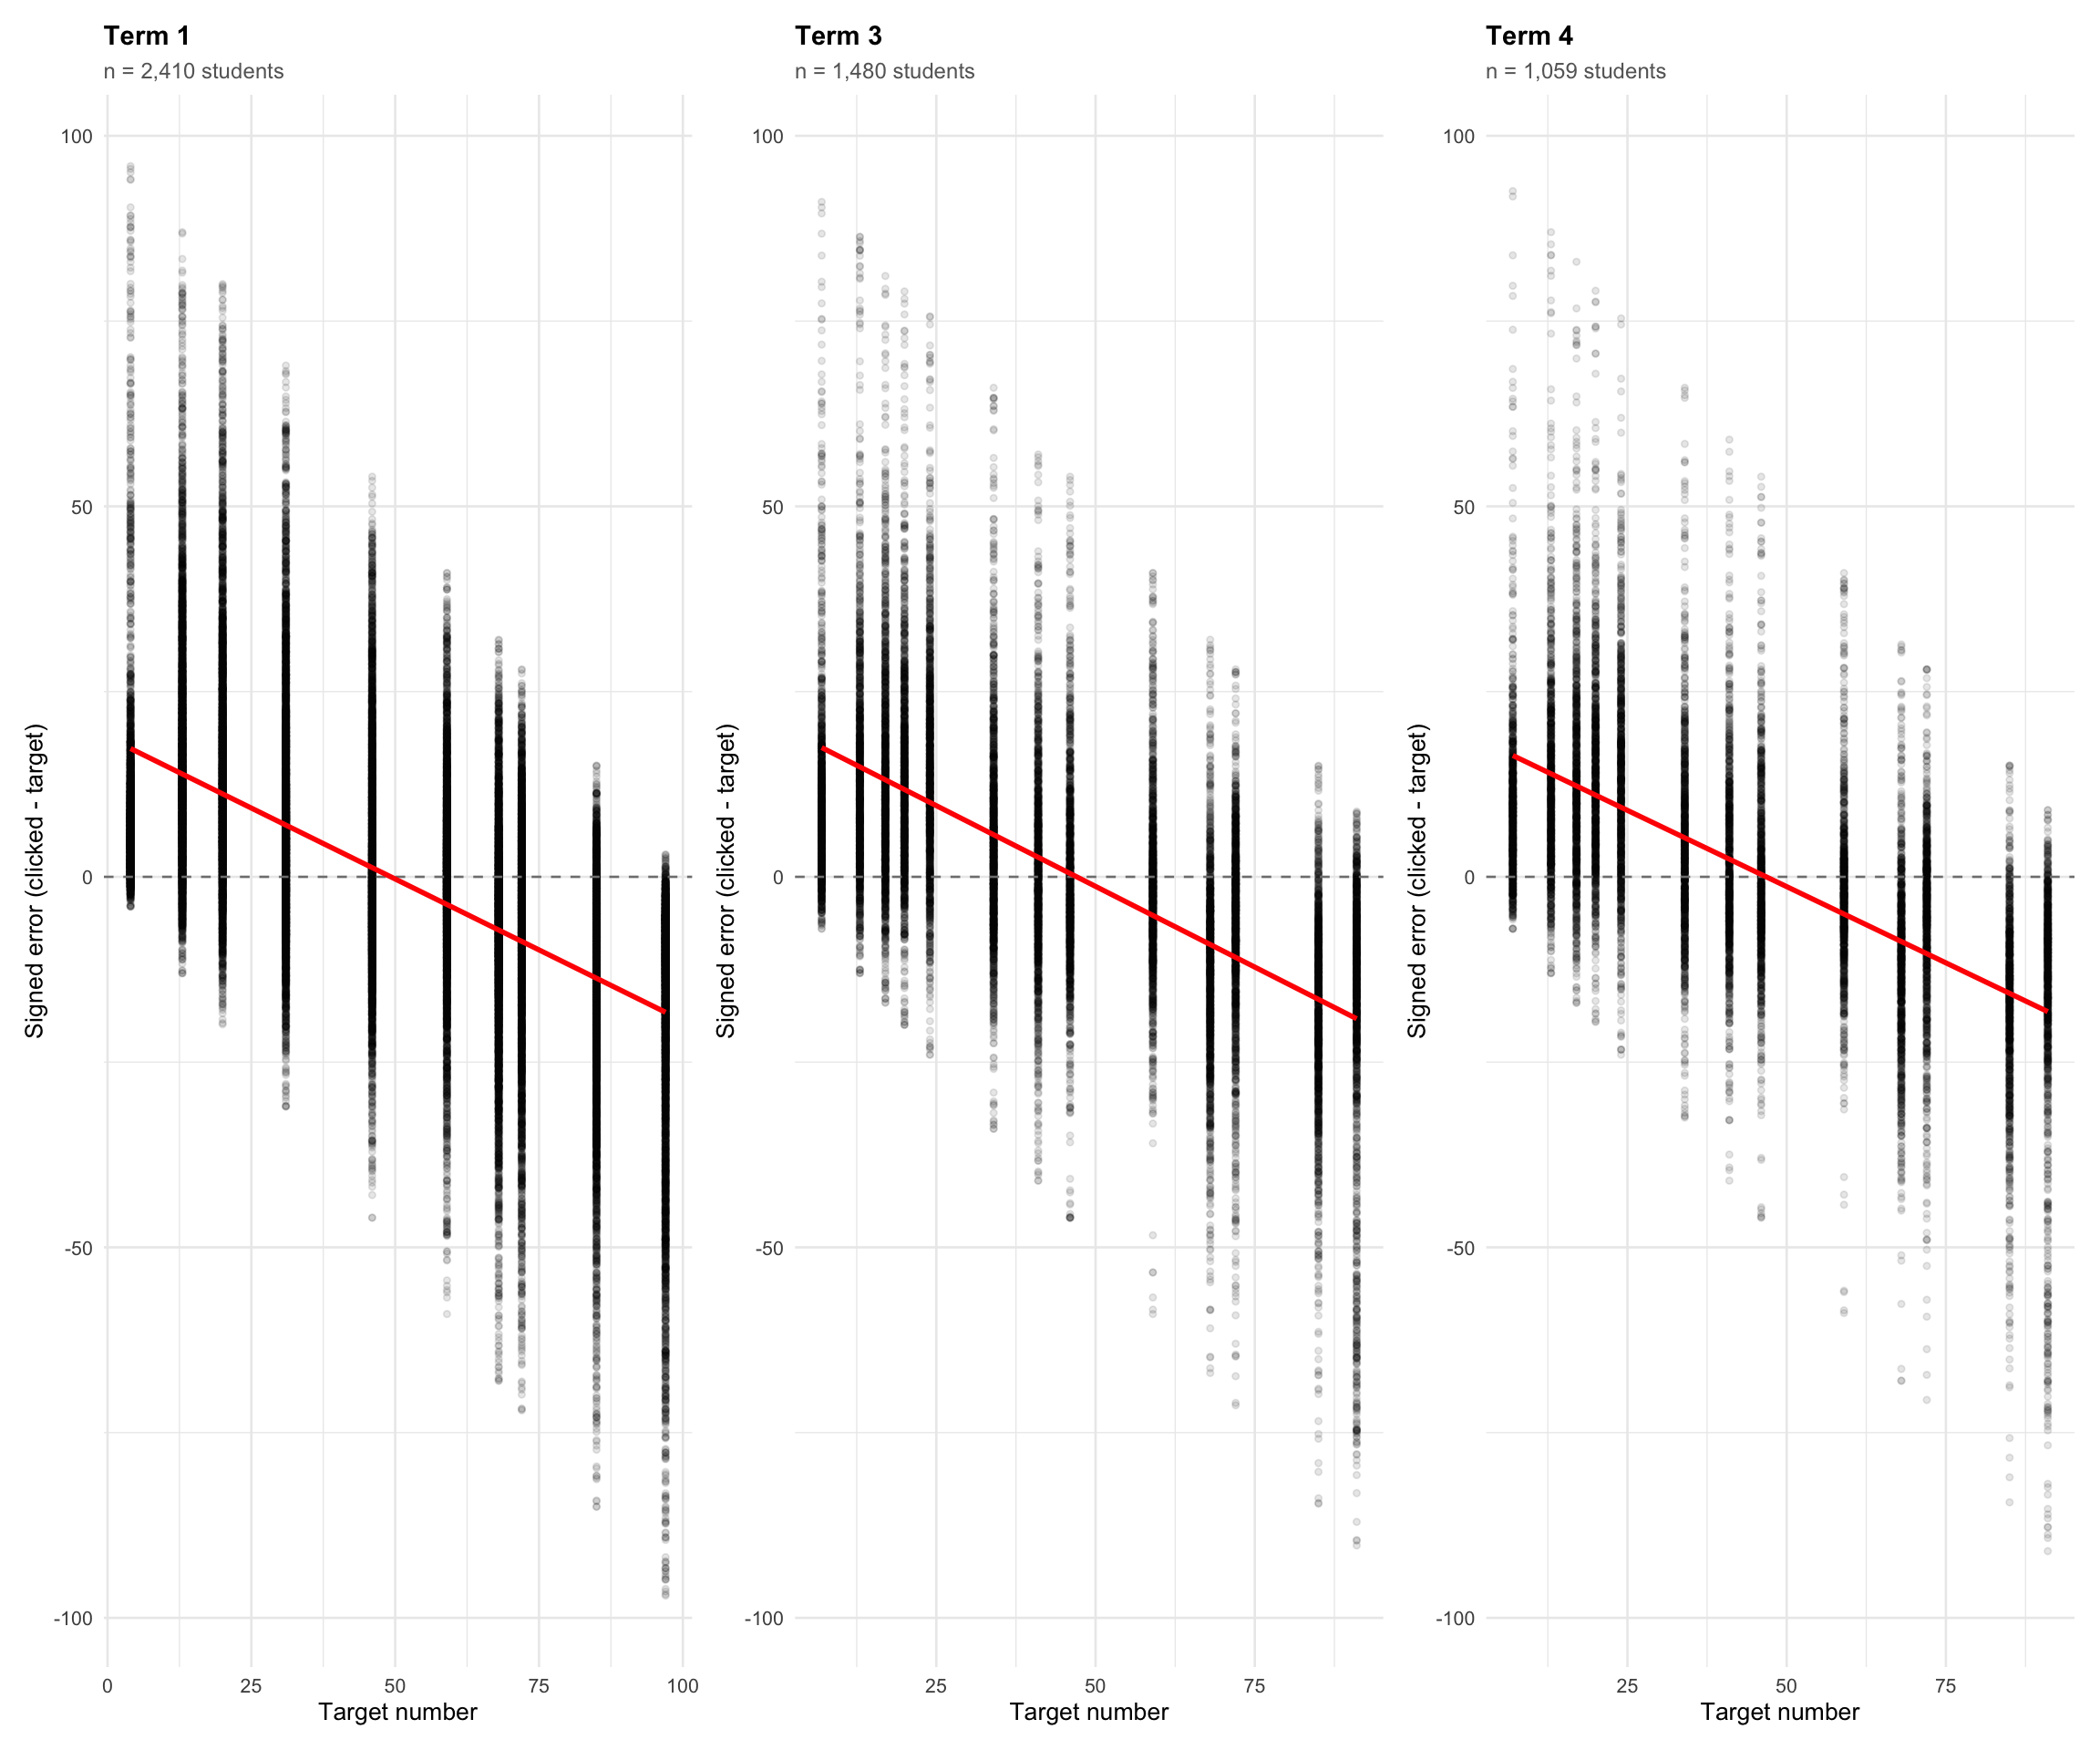
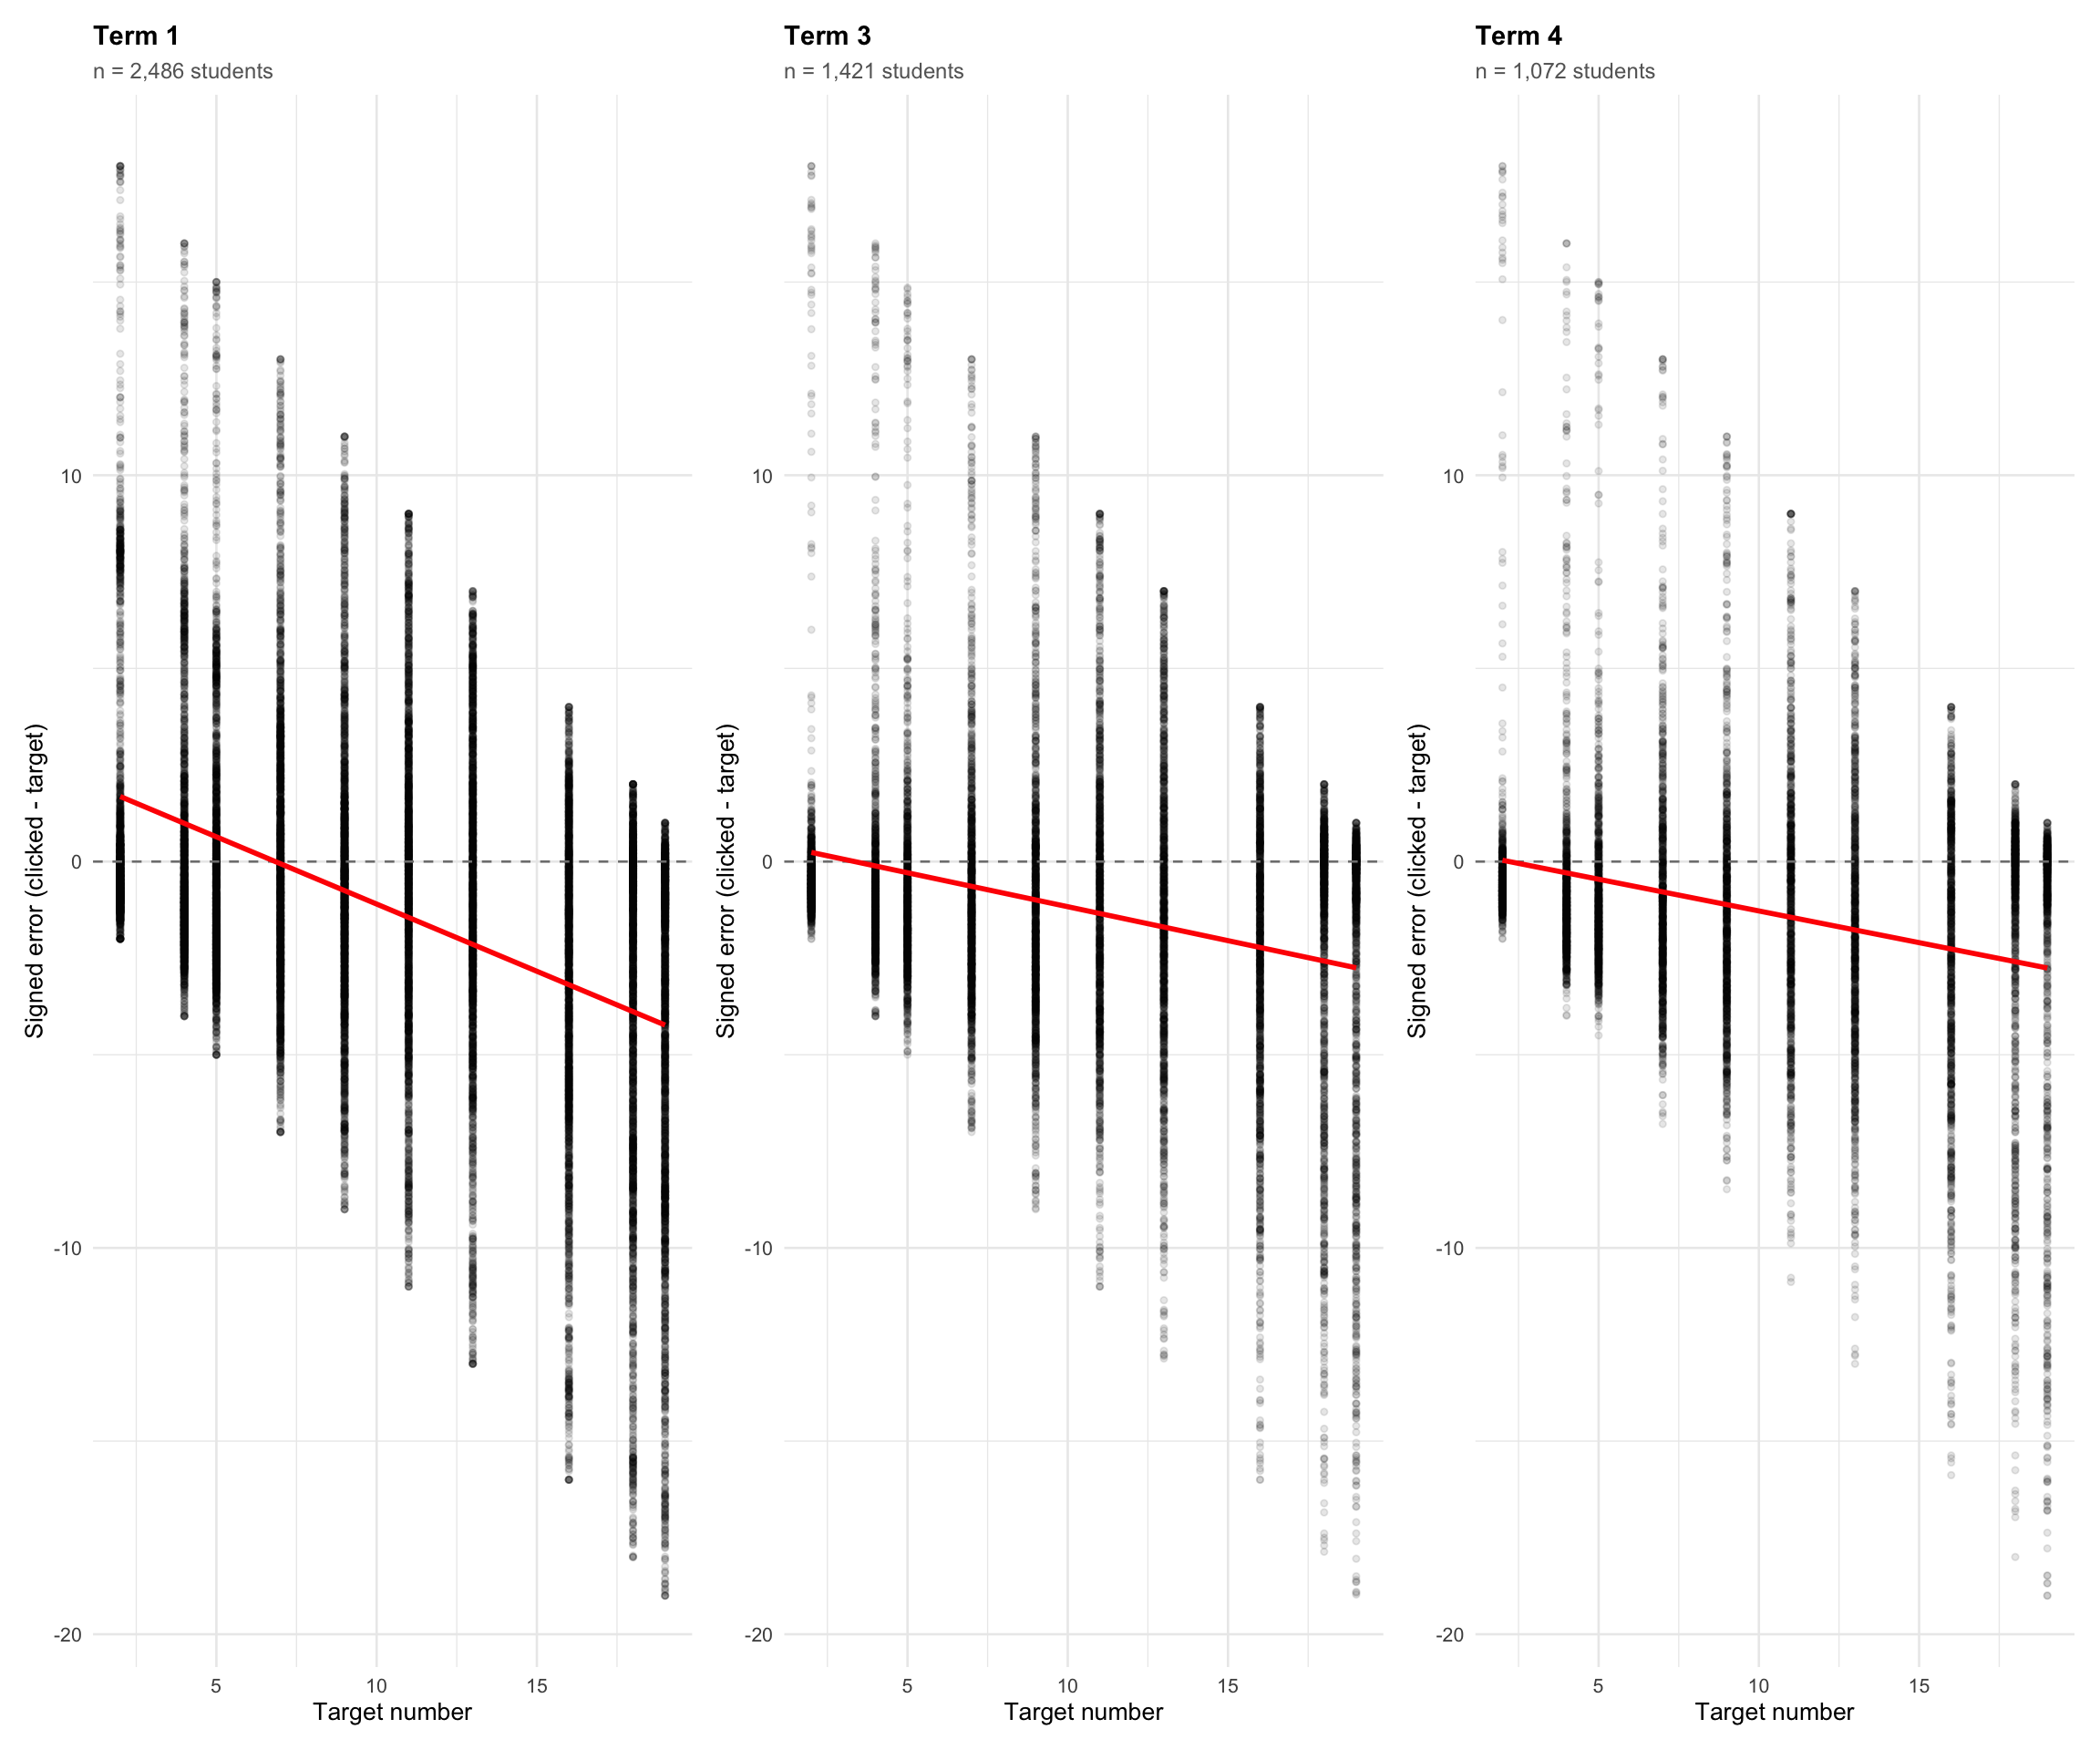
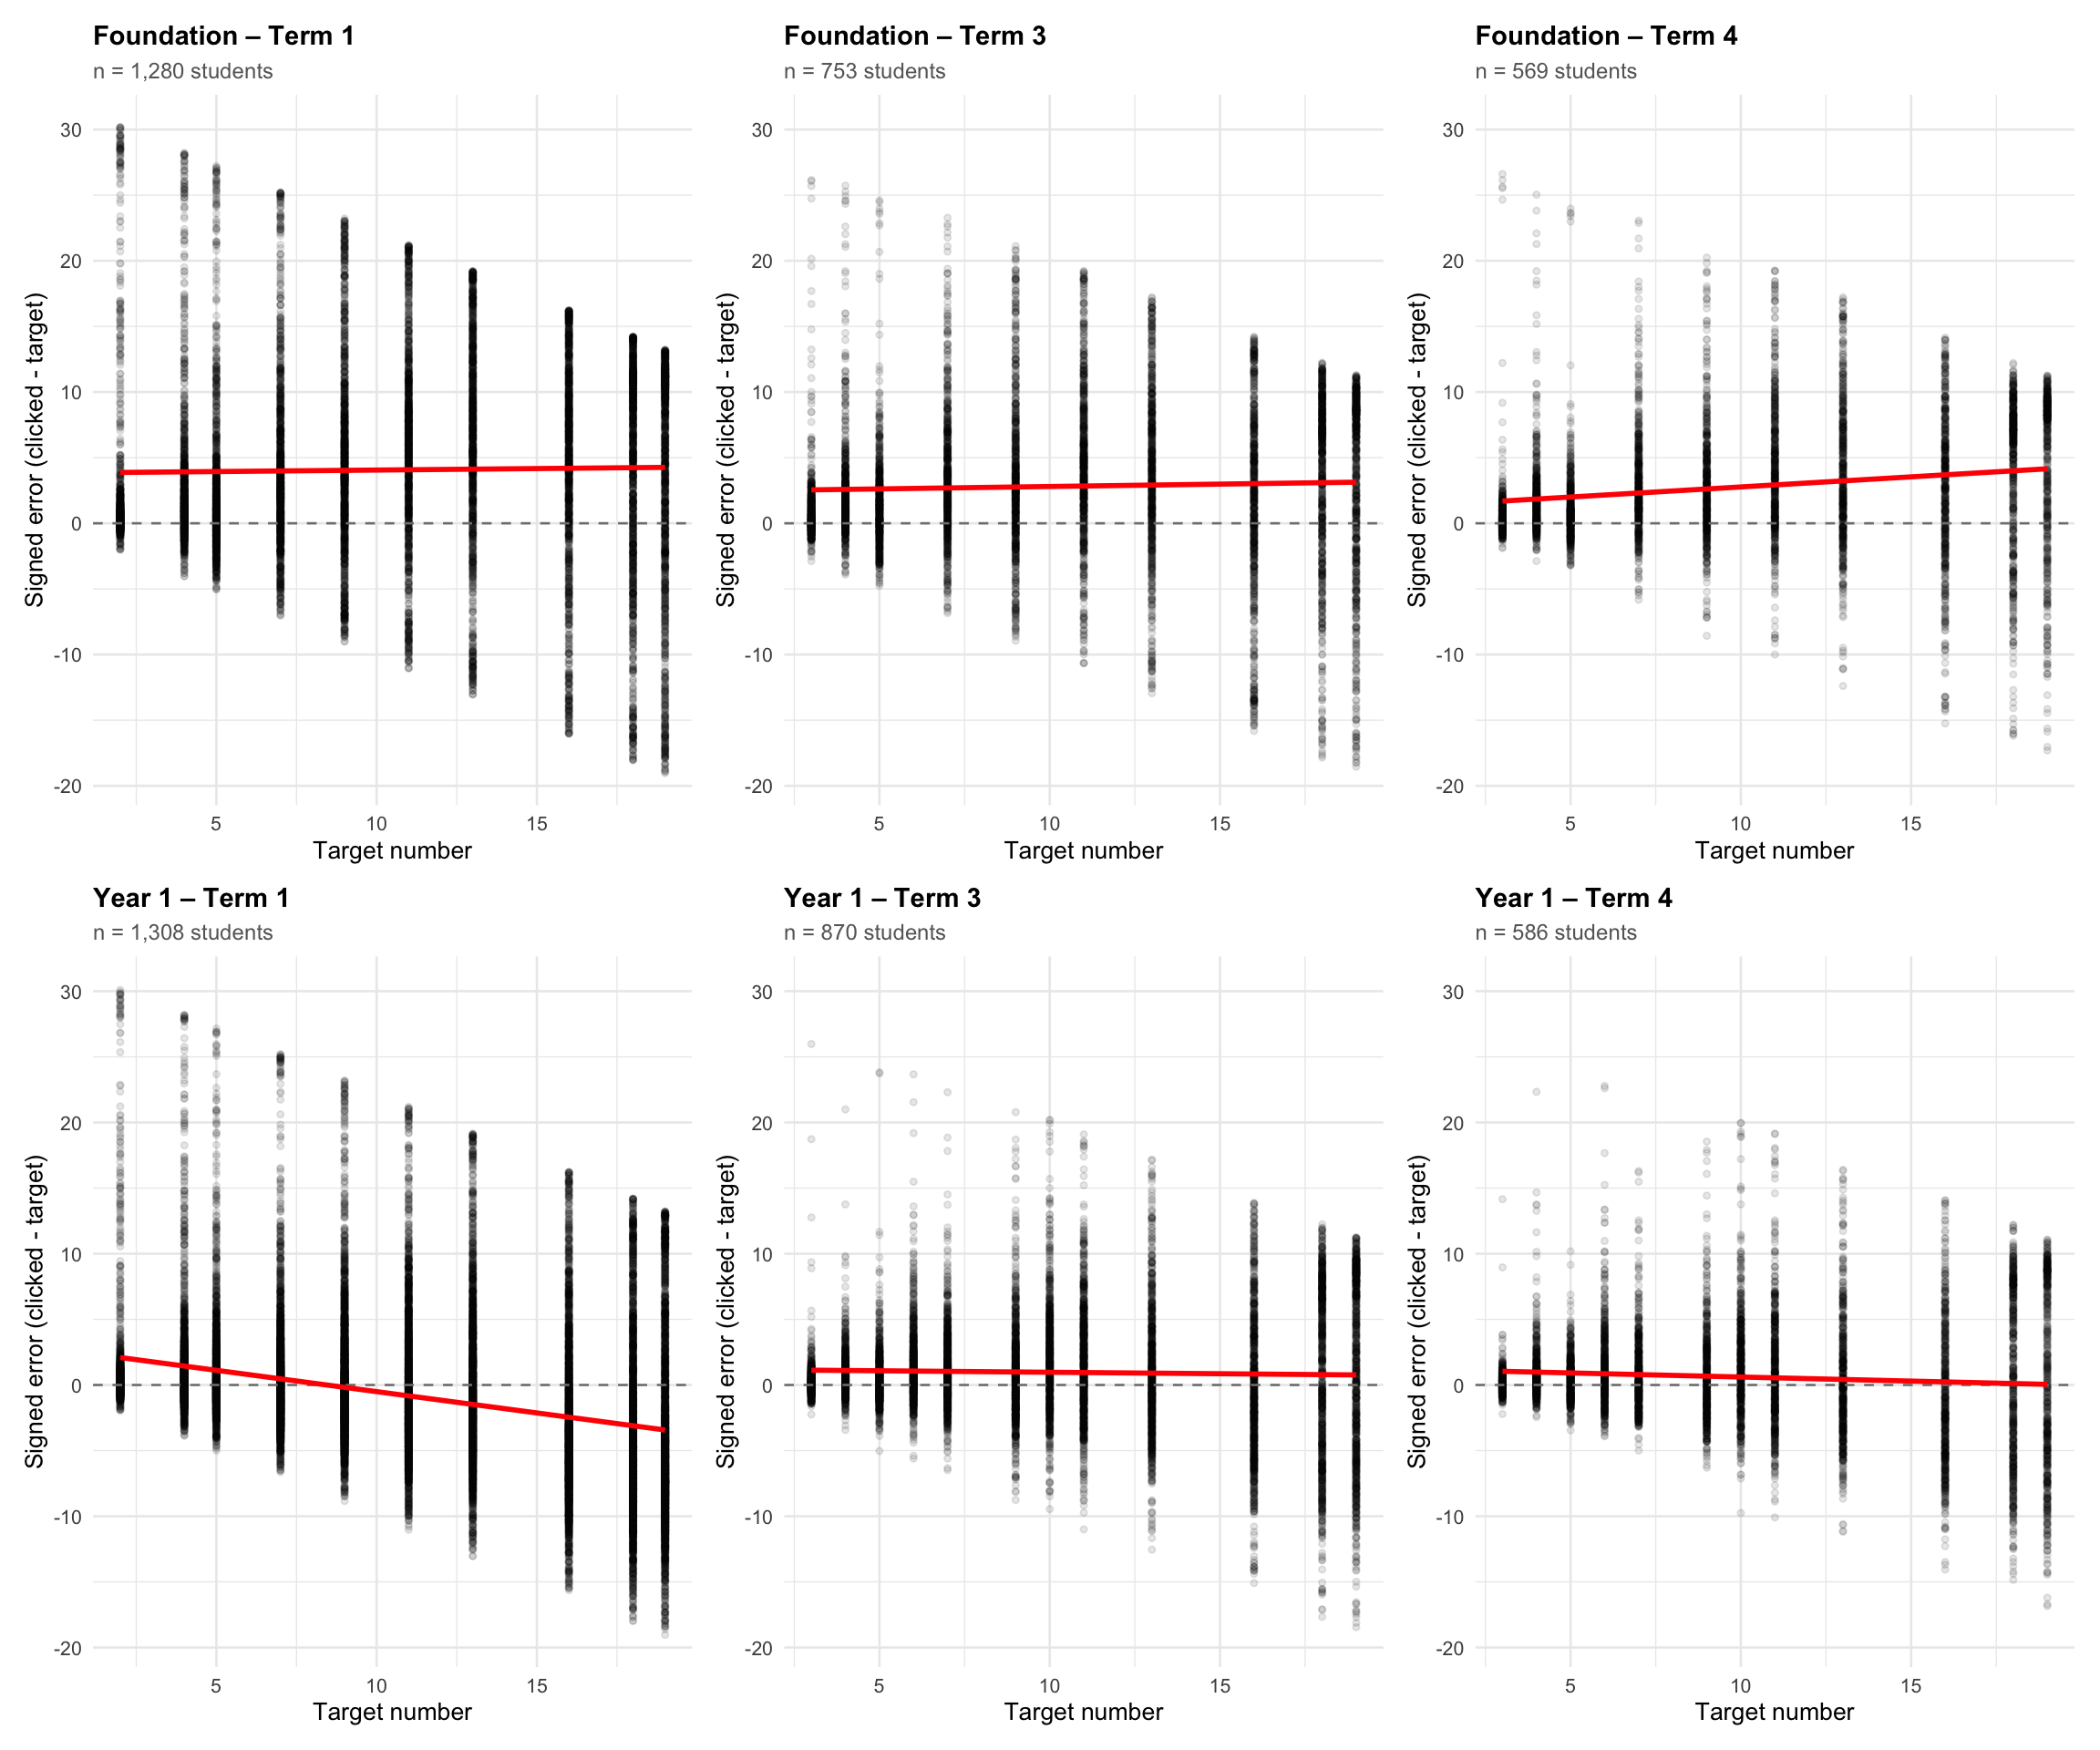
8. Signed error vs target
This section shows how estimation bias (over/underestimation) varies with target number. The regression line is fitted via OLS.
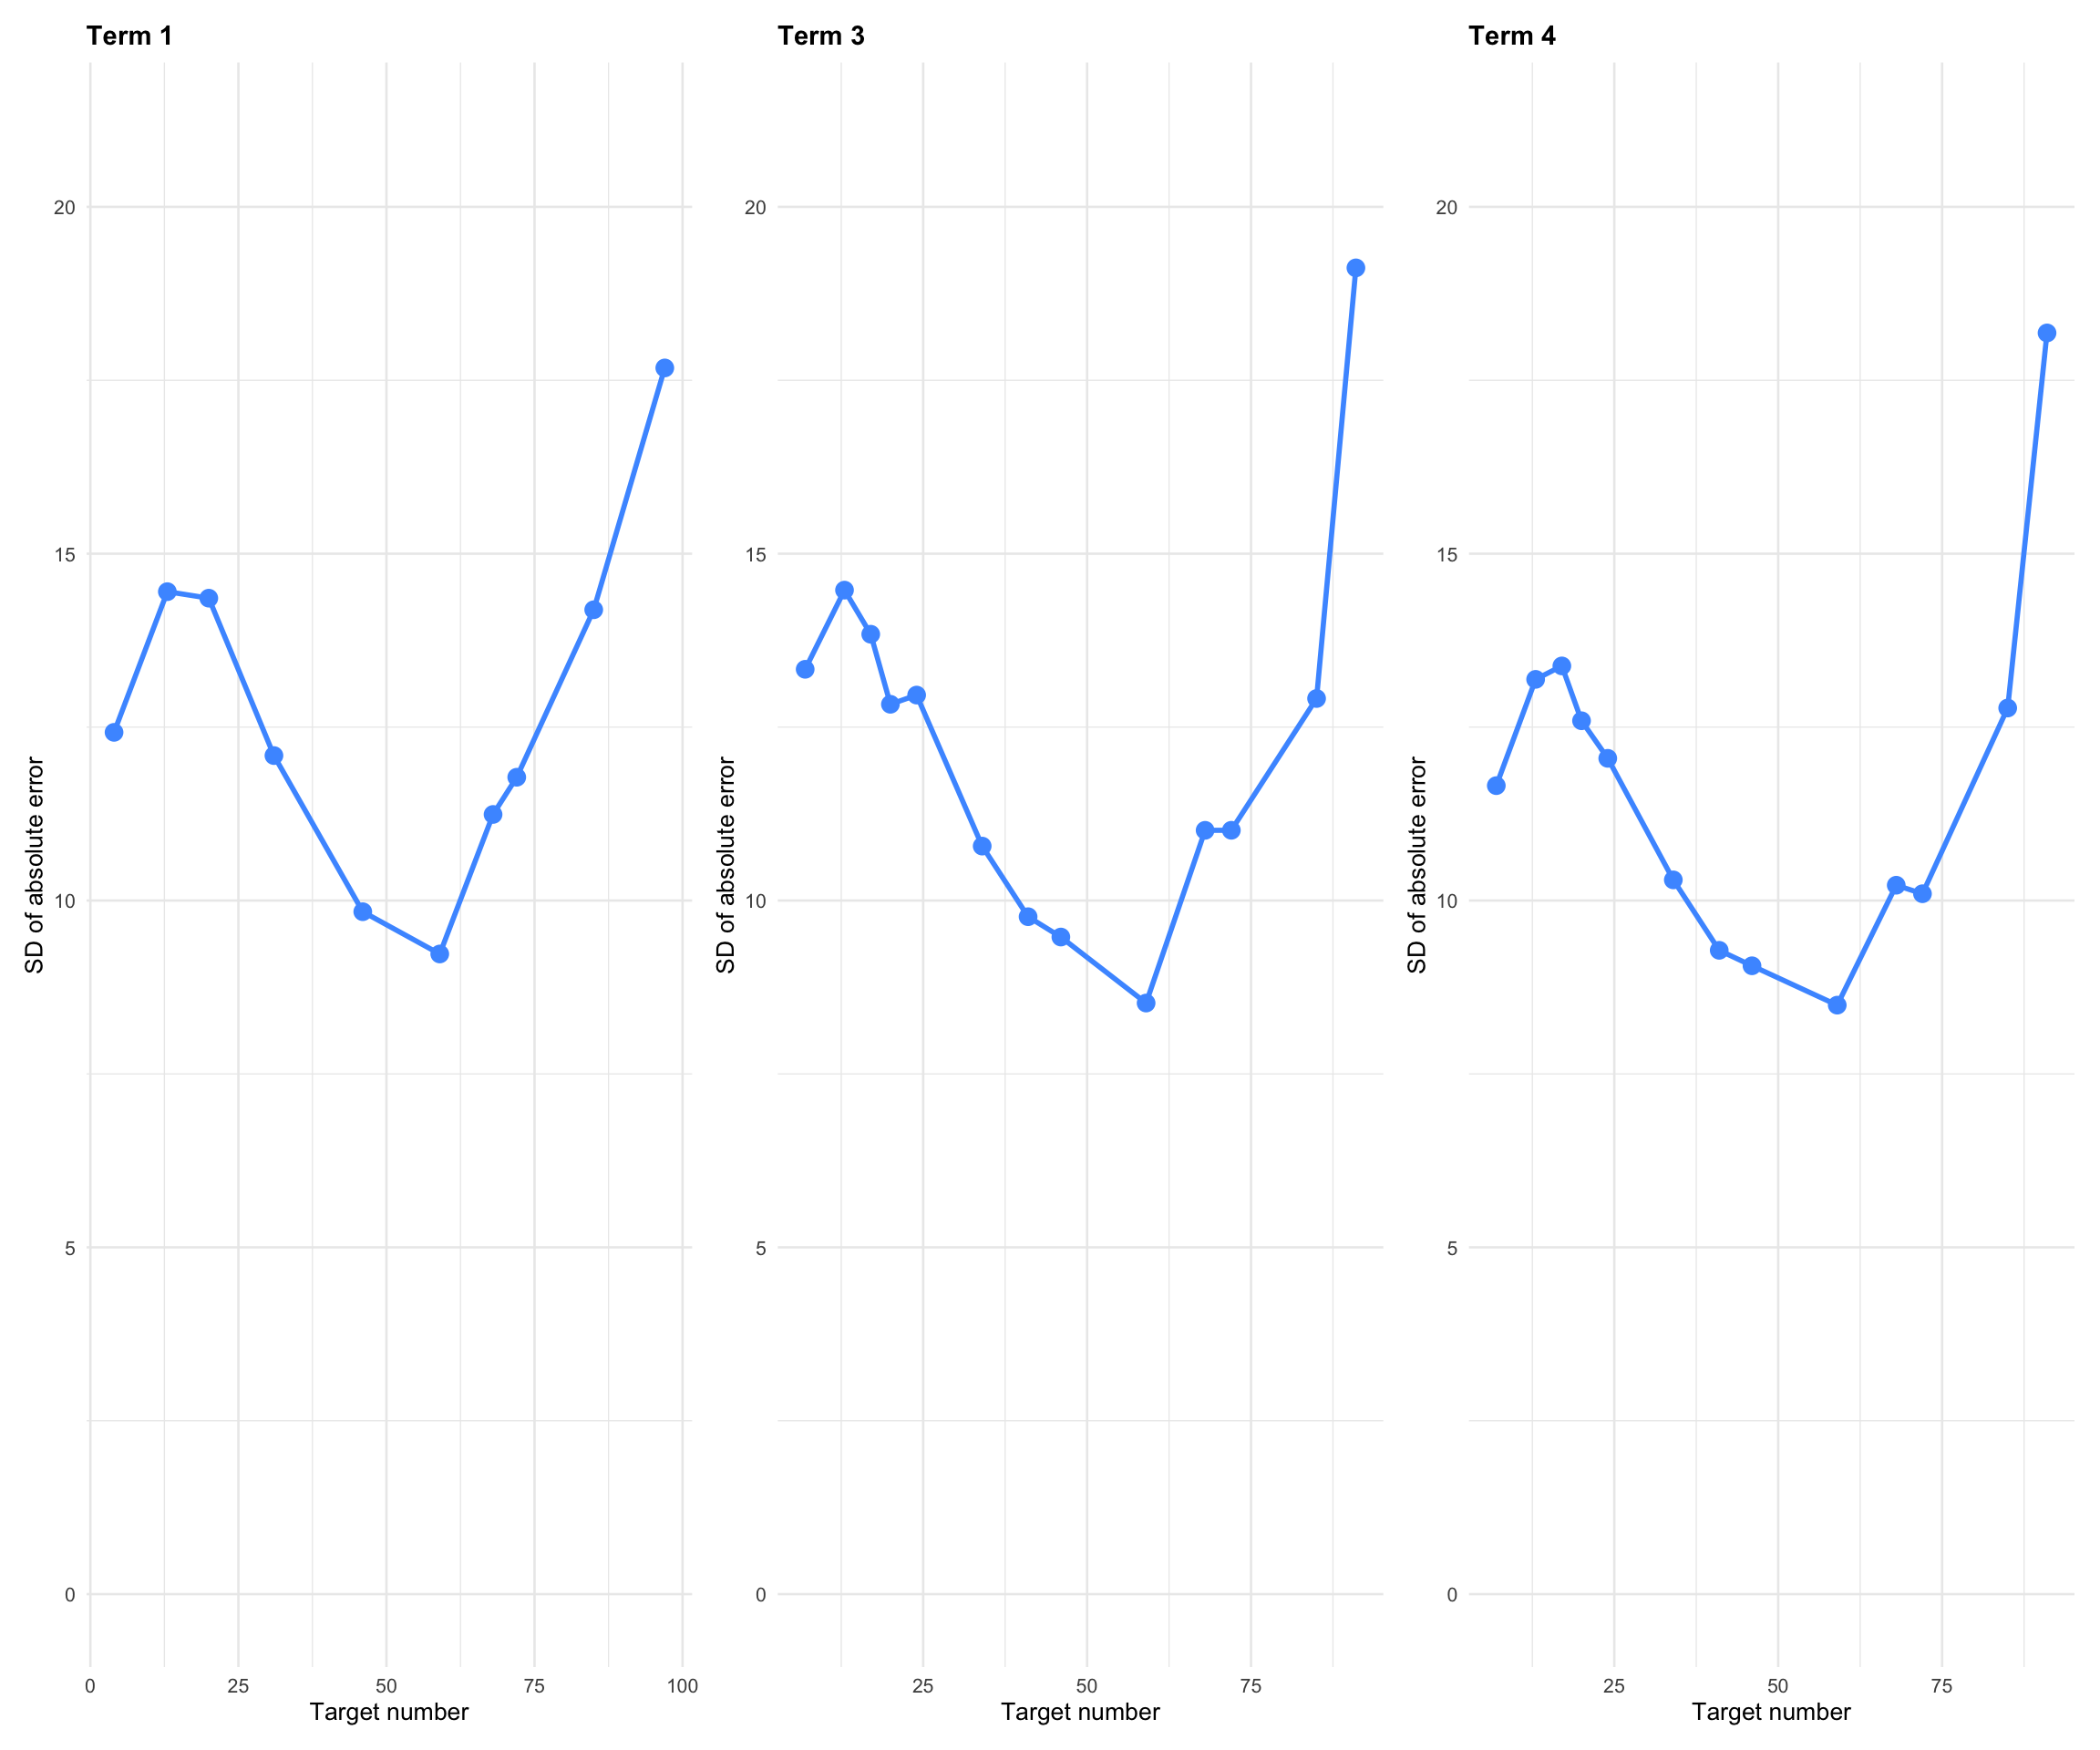
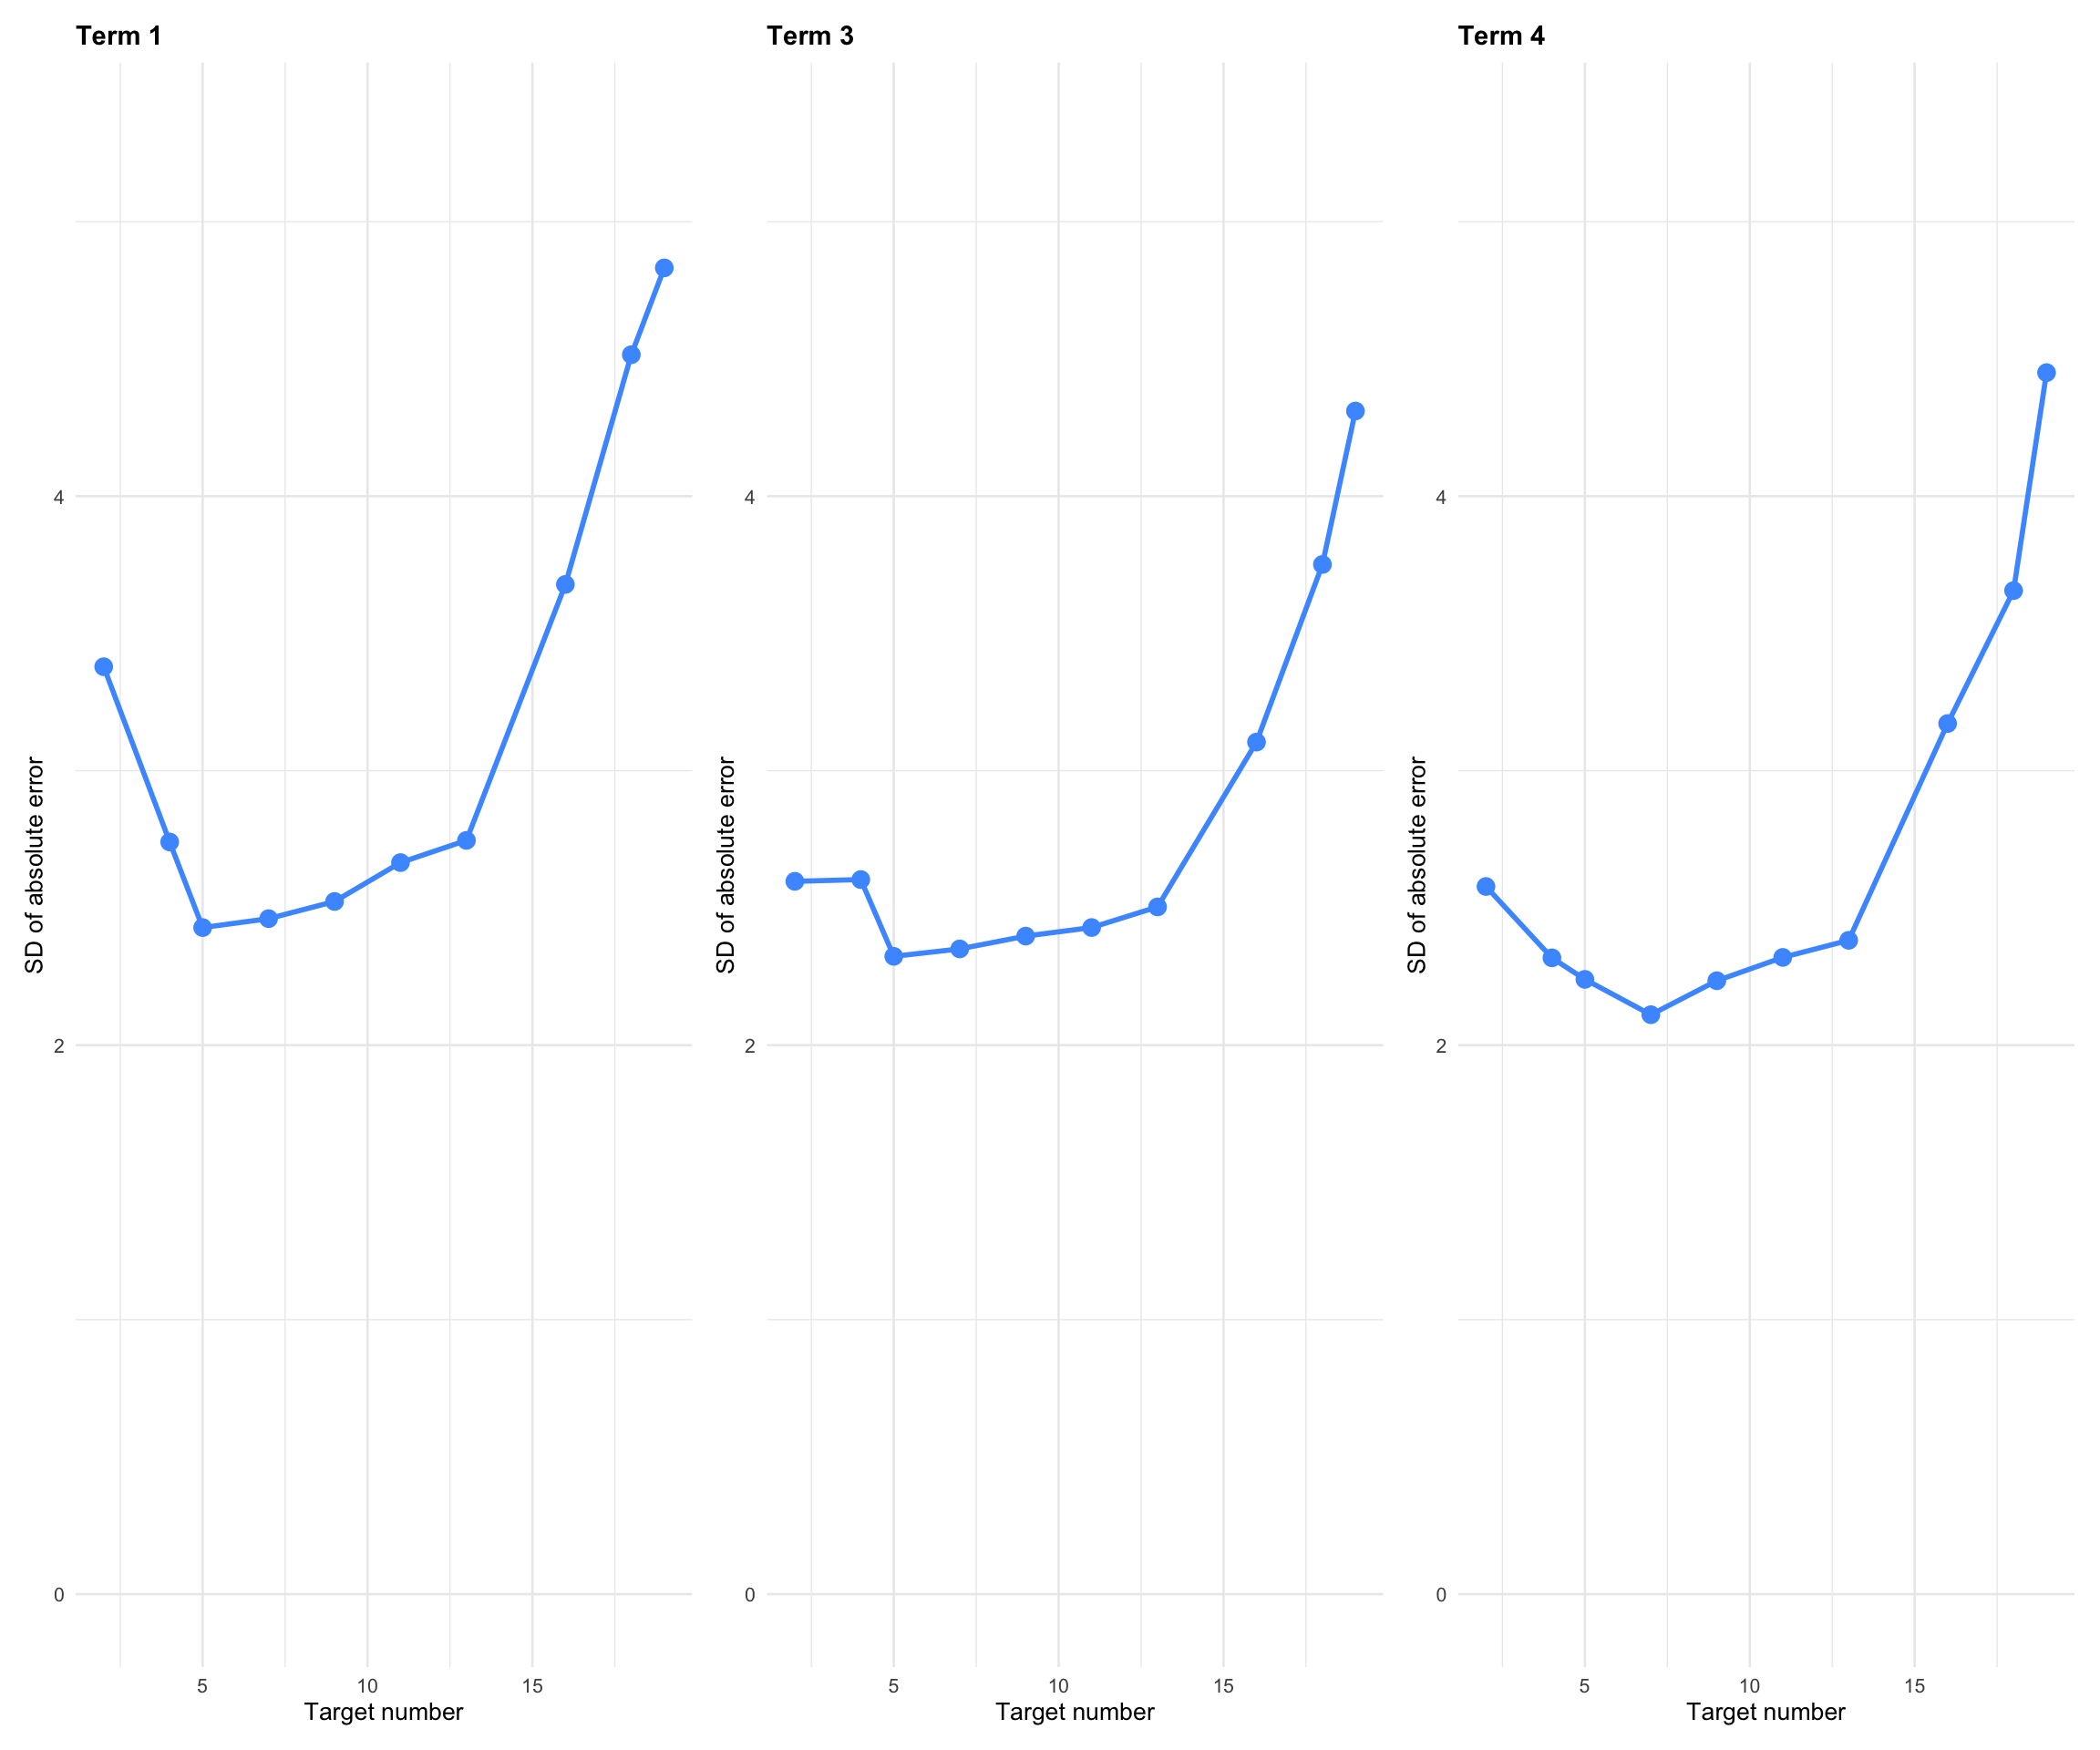
9. SD of absolute error by target
This section shows how variability in estimation error changes with target number.