flowchart TD
    M0["<b>Raw-score benchmark (M0)</b><br/>Comparator<br/>Score earned divided by scorable-response denominator"]
    A1["<b>IRT accuracy foundation (A1)</b><br/>Achievement from valid/scorable responses<br/>No reach adjustment"]
    A2["<b>Accuracy + probe effects (A2)</b><br/>Adds probe/testlet random effects<br/>No reach adjustment — IRT development baseline"]
    A3["<b>Completion-sensitivity model (A3)</b><br/>Adds latent completion dimension<br/>Correlated with θ but separate<br/><i>Result: real signal; did not beat A2 externally</i>"]
    A4["<b>Response-state audit (A4)</b><br/>Classifies each row into 7 states<br/>Context and QC only — not achievement scoring"]
    T1["<b>Speed-only models (T1b/T1c)</b><br/>Clean RT likelihood<br/>Research-only"]
    J["<b>Joint accuracy–RT models (J0/J1/J2)</b><br/>Diagnostics pending<br/>Not decision evidence"]
    QC["<b>Logging/QC requirements</b><br/>A4 informs data contract"]
    D["<b>Completion decision</b><br/>A3 not cleared for scoring"]

    M0 --> A1
    A1 --> A2
    A2 --> A3
    A2 --> A4
    A2 --> T1
    T1 --> J
    A4 --> QC
    A3 --> D
Omitted and Non-Scored Responses
What response records tell us about reach, completion, and non-response — and why these stay outside achievement scoring
1 Summary
The numeracy screener records many item rows for each student administration: whether an item response was scorable, whether response time was positive, whether an item came before or after the last evidence of interaction, and whether the response was correct. These are related but not identical pieces of evidence. This page explains how we separate achievement evidence from response-process evidence.
The legacy is_attempted flag should not be interpreted as true exposure, reach, or effort. In the current data it means valid/scorable response. That distinction matters: collapsing all response-process stages into one binary field makes it impossible to tell apart a student who did not reach an item from one who interacted with it but produced a non-scorable response.
The completion-sensitivity model (A3) showed that completion patterns carry genuine signal — but as a separate latent dimension correlated with achievement, not as a direct adjustment to the achievement score. The response-state category system (A4) is designed for context and QC, not scoring.
2 How response records are structured
A clean response-process model would distinguish each stage:
shown / available → seen → positive RT or focus-event proxy → response entered → valid/scorable → correctCurrent logging does not prove cognitive engagement. Positive RT or a focus event is an interaction proxy, not direct evidence that the student saw, understood, or engaged with the item.
The legacy is_attempted flag does not do this. It records whether the final response is valid and scorable — which is useful, but a row can fail is_attempted for many different reasons: the student may not have reached the item, may have seen but left it blank, may have interacted in a non-scorable way, may have produced a rapid placeholder response, or may have been affected by platform or scoring artifacts.
3 The modelling path for completion and reach
The diagram below shows how each model iteration addressed — or deliberately set aside — the completion and reach question.
3.1 Modelling results summary
| Model | What it added | Why we moved on / current verdict |
|---|---|---|
| M0 | Established the raw-score comparison benchmark: score earned divided by the current scorable-response denominator, with no IRT calibration. | IRT calibration tested whether item difficulty and local dependence could improve measurement and decision evidence. |
| A1 | Showed that IRT can recover a stable achievement dimension from these items. | Probe/testlet effects needed; A2 used as the development baseline. |
| A2 | Absorbed local dependence within probes via random effects; improved model fit. | A3 adds signal but did not clearly improve external-outcome prediction. A2 remains the development baseline. |
| A3 | Demonstrated that completion/valid-scorable-response status is a distinct, correlated latent dimension (r ≈ 0.20 Foundation, 0.32 Year 1). Improved an internal reliability-like index over A2, but this reflects systematic completion behaviour and does not prove improved achievement measurement. | Not a true reach model. Does not distinguish truly unreached items from other nonresponse causes. Remains research-only. |
| A4 | Provided a principled row-level classification of response evidence: separates trailing nonreach from valid responses, RT-positive nonvalid interactions, and other states. | Useful QC and audit layer. States must not be scored as wrong answers inside the achievement likelihood. |
Note
A4 response-state categories inform the data contract for the joint accuracy–RT models (J0/J1/J2) — specifically, which rows enter the clean speed likelihood. The joint models are covered on the Speed & Profiles page.
4 Future staged response flags
Future logging should support a staged response tree. The exact names below are proposed audit labels, not a claim that these fields already exist in the current operational data. The modelling goal is stable: estimate different response-process stages instead of forcing all nonvalid rows into one category.
| Stage | Possible flag | Why it matters |
|---|---|---|
| Available | item_available | Defines the denominator for exposure. |
| Seen | item_seen | Separates not-reached from reached-but-unanswered. |
| Positive RT or focus-event proxy | positive_rt_or_focus | Shows a logged interaction proxy even if the final response is not scorable; not proof of engagement. |
| Responded | response_recorded | Separates blanks from recorded nonvalid responses. |
| Valid/scorable | valid_scorable_response | Matches current is_attempted semantics. |
| Correct | is_correct | Feeds the achievement likelihood only after response validity is established. |
5 Completion-sensitivity modelling: what we found
The completion-sensitivity model (A3) added a second latent dimension alongside achievement. In the M3 decision runs the latent achievement/valid-scorable-response correlation was about 0.20 in Foundation and 0.32 in Year 1. A3 also improved the internal reliability-like index over A2: 0.586 → 0.611 in Foundation and 0.708 → 0.748 in Year 1.
That is useful research evidence, but not an operational result. The improved reliability-like index reflects systematic completion/valid-scorable-response behaviour; it does not prove that achievement measurement improved. A3 did not clearly beat A2 against external outcomes or classification evidence. It also cannot be promoted as a reach model because it does not know whether an item was truly reached — it mixes valid/scorable response status, trailing nonreach proxies, seen-but-nonvalid responses, rapid blanks, and administration artefacts.
6 Response-state categories: how each item row is classified
A4 states are row-level evidence classifications. They are not direct observations of cognition, exposure, engagement, or motivation.
Operational pseudo-code:
For each person × probe:
1. Identify rows with valid/scorable response.
2. Identify rows with positive RT.
3. Define evidence row = valid/scorable OR positive RT.
4. Let first_evidence = first row with evidence.
5. Let last_evidence = last row with evidence.
6. Classify each row:
   - valid_scorable_response if valid/scorable and RT > 0
   - valid_scorable_zero_rt_qc if valid/scorable and RT == 0
   - rt_positive_nonvalid_response if not valid/scorable and RT > 0
   - trailing_nonreach_proxy if no evidence and row > last_evidence
   - leading_unseen_proxy if no evidence and row < first_evidence
   - interior_unseen_or_blank_proxy if no evidence and between first and last evidence
   - no_evidence_probe if no evidence anywhere in probe
Missingness mechanisms are separated as far as the current logs permit: missing by design, trailing nonreach proxy, seen/available but nonvalid, technical missing, and unknown. Only valid/scorable responses enter the achievement likelihood. Clean speed likelihoods use valid/scorable positive-RT rows under the RT data contract. The other mechanisms are audit/context information unless a later model explicitly defines and validates a different likelihood.
| State | Meaning |
|---|---|
| valid_scorable_response | Legacy is_attempted == TRUE; valid/scorable response, not necessarily exposure. |
| valid_scorable_zero_rt_qc | Valid/scorable response with zero RT; QC edge case. |
| rt_positive_nonvalid_response | Positive RT but no valid/scorable response; seen/interacted proxy but mechanism is mixed. |
| trailing_nonreach_proxy | Item after last valid/scorable or positive-RT evidence. |
| interior_unseen_or_blank_proxy | No valid response and no RT between first and last seen proxy. |
| leading_unseen_proxy | No valid response and no RT before first seen proxy; edge/anomaly state. |
| no_evidence_probe | No valid response and no positive RT anywhere in the probe. |
7 Evidence: how response states vary across students
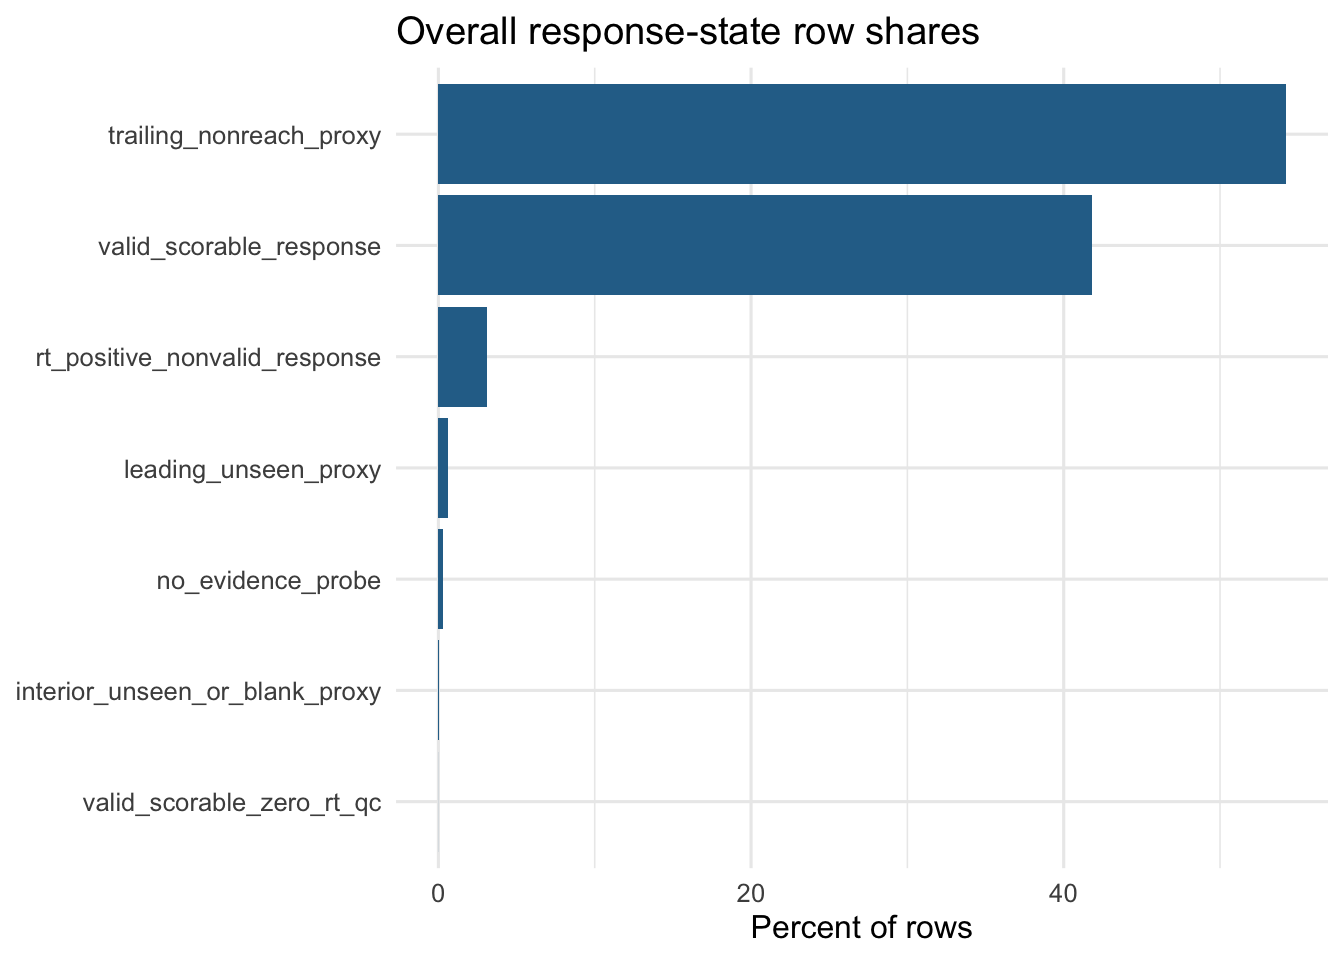
These percentages are row-level shares over the analytic item-row table. They are not percentages of students, presented items, or true opportunities.
| Year | N person-admins | Achievement metric | Valid-rate vs current achievement | Trailing-rate vs current achievement | RT+ nonvalid vs current achievement | Valid-rate vs T1b speed | Trailing-rate vs T1b speed |
|---|---|---|---|---|---|---|---|
| Foundation | 5,062 | Raw-score benchmark | 0.304 | -0.137 | -0.295 | 0.584 | -0.735 |
| Year 1 | 5,127 | Raw-score benchmark | 0.285 | -0.246 | -0.079 | 0.667 | -0.777 |
These correlations are point estimates only. Intervals are not shown here. They confirm the states are meaningful response-process proxies, but they are not evidence that trailing or nonresponse should be scored as wrong answers.
8 Response states by achievement band
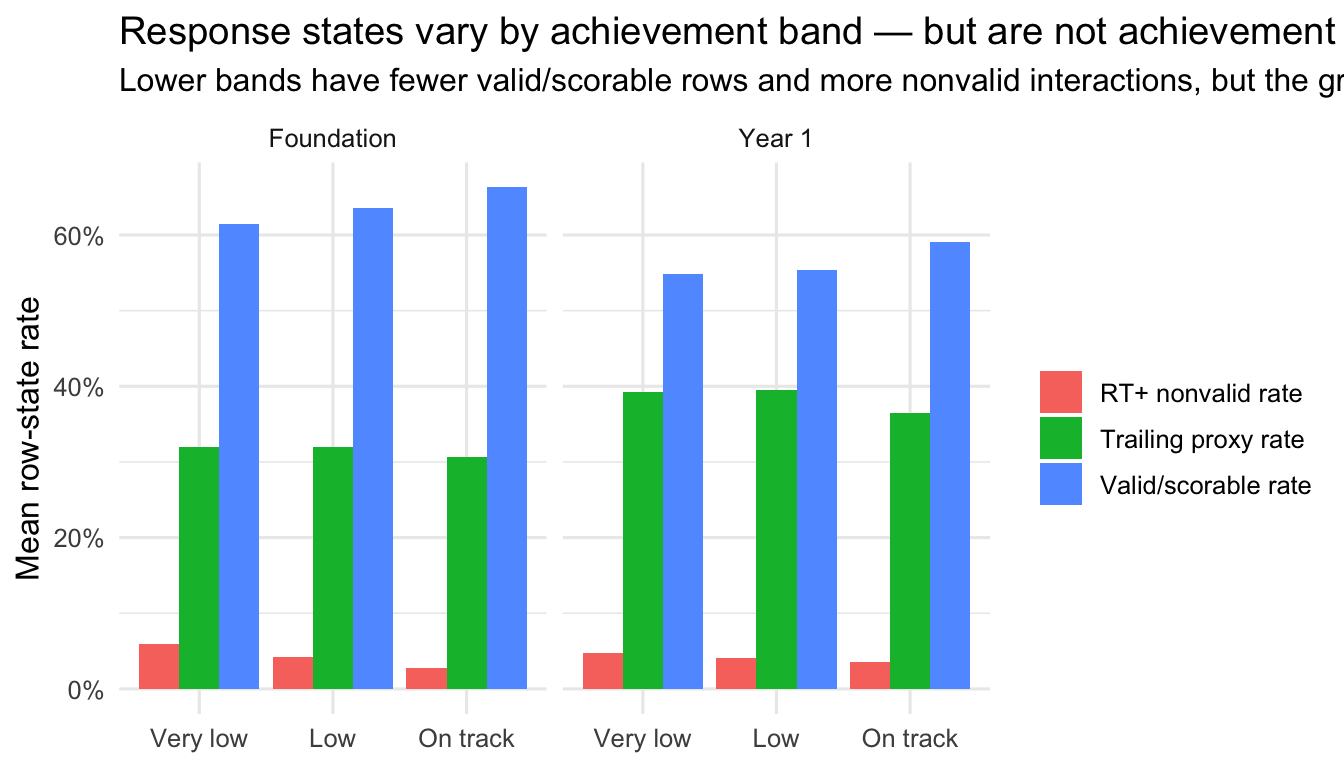
The pattern is substantively useful: lower achievement bands tend to have lower valid/scorable rates and more RT-positive nonvalid responses. But the state rates are not clean monotone ability indicators, and trailing is strongly entangled with speed and completion. This supports using response-state categories as context and QC, not as scoring adjustments.
9 Response states belong in context, not in the score
Response-state categories should stay outside the achievement likelihood because they mix mechanisms. A trailing state may reflect speed, disengagement, item order, time limit, device or platform behaviour, or administration interruption. A positive-RT nonvalid state may reflect genuine interaction, but the reason it became nonvalid is not uniquely psychometric. These states are therefore useful for audit, form design, administration review, and future response-process profiles.
10 Modality and form audit caveat
The arithmetic form labels require care. The Year 1 Term 3 ASDD_2025 / ASDD legacy subtraction drag/drop form has unusually high RT-positive nonvalid rates, consistent with a scoring or modality artifact. It is excluded from the clean speed likelihood until the issue is resolved.
The broader AADD/ASDD label family is also hazardous to interpret by filename alone. For example, AADD_2025-New maps to multiple-choice addition (AAMC), while AADD_2025-MOY* is curated as tap-tap addition (AATT). The modelling response is not to single out one form arbitrarily: it is to audit modality, relabel where the mapping is known, exclude known problematic legacy rows from clean RT modelling, and keep the caveat visible.