Student Metadata: 7,967 students x 35 columnsCleaned Responses: 6,362 unique studentsPAT Outcomes: 714 students with scoresTeacher Ratings: 2,358 students with ratingsDemographics, Data Quality, and Linkage Analysis
Student Metadata: 7,967 students x 35 columnsCleaned Responses: 6,362 unique studentsPAT Outcomes: 714 students with scoresTeacher Ratings: 2,358 students with ratings| column | type | category |
|---|---|---|
| atsi_status | character | Background |
| disability_level | character | Background |
| disability_type | character | Background |
| has_disability | logical | Background |
| is_lbote | logical | Background |
| data_consent | logical | Consent |
| age_raw | character | Demographics |
| age_years | numeric | Demographics |
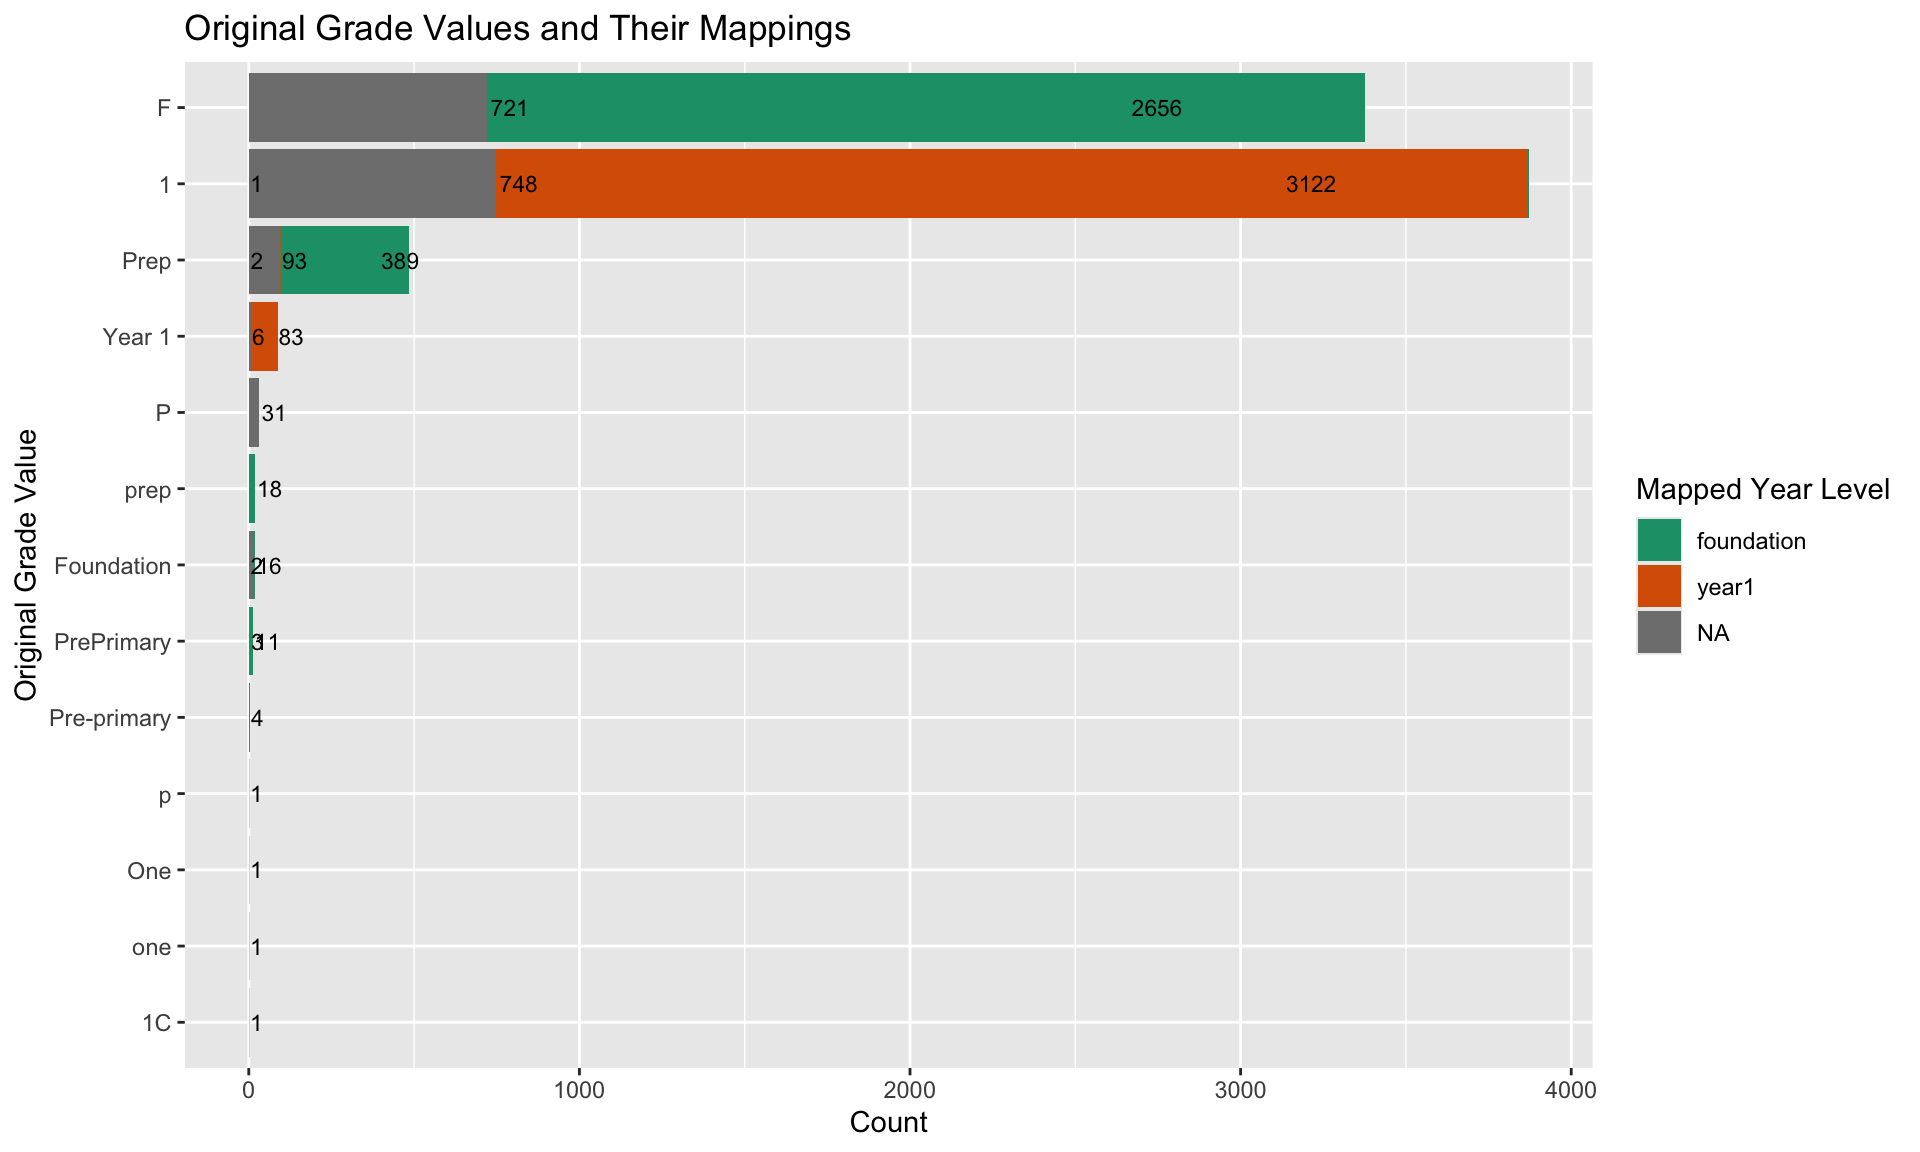
| grade_normalised | character | Demographics |
| grade_raw | character | Demographics |
| year_level_from_grade | character | Demographics |
| year_level_screener | character | Demographics |
| class_name | character | Identifiers |
| org_identifier | character | Identifiers |
| org_unit | character | Identifiers |
| org_unit_identifier | character | Identifiers |
| organisation | character | Identifiers |
| student_id | character | Identifiers |
| age_years_implausible | logical | SES |
| any_parent_employed | logical | SES |
| birth_month | integer | SES |
| birth_month_suspect | logical | SES |
| birth_year | integer | SES |
| birth_year_suspect | logical | SES |
| class_hash_id | character | SES |
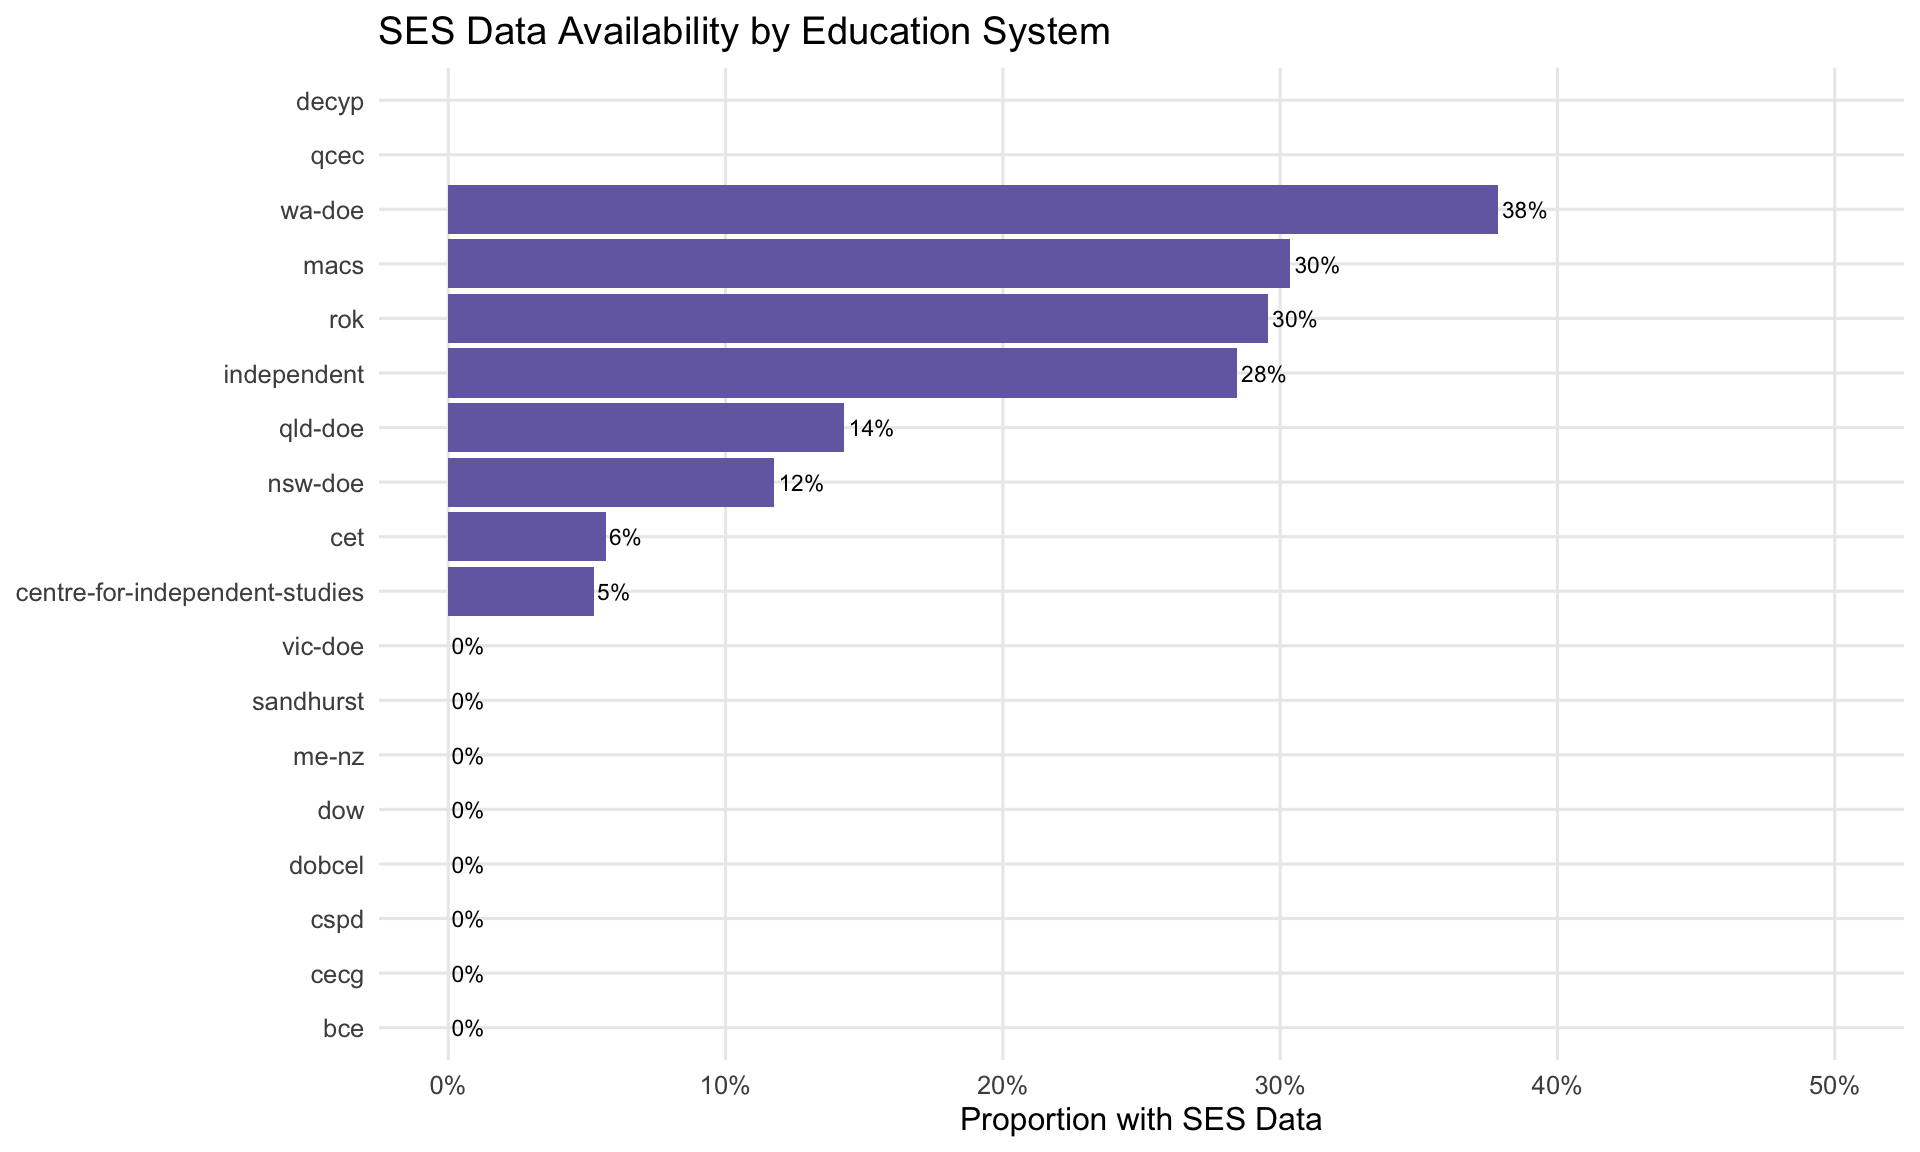
| has_ses_data | logical | SES |
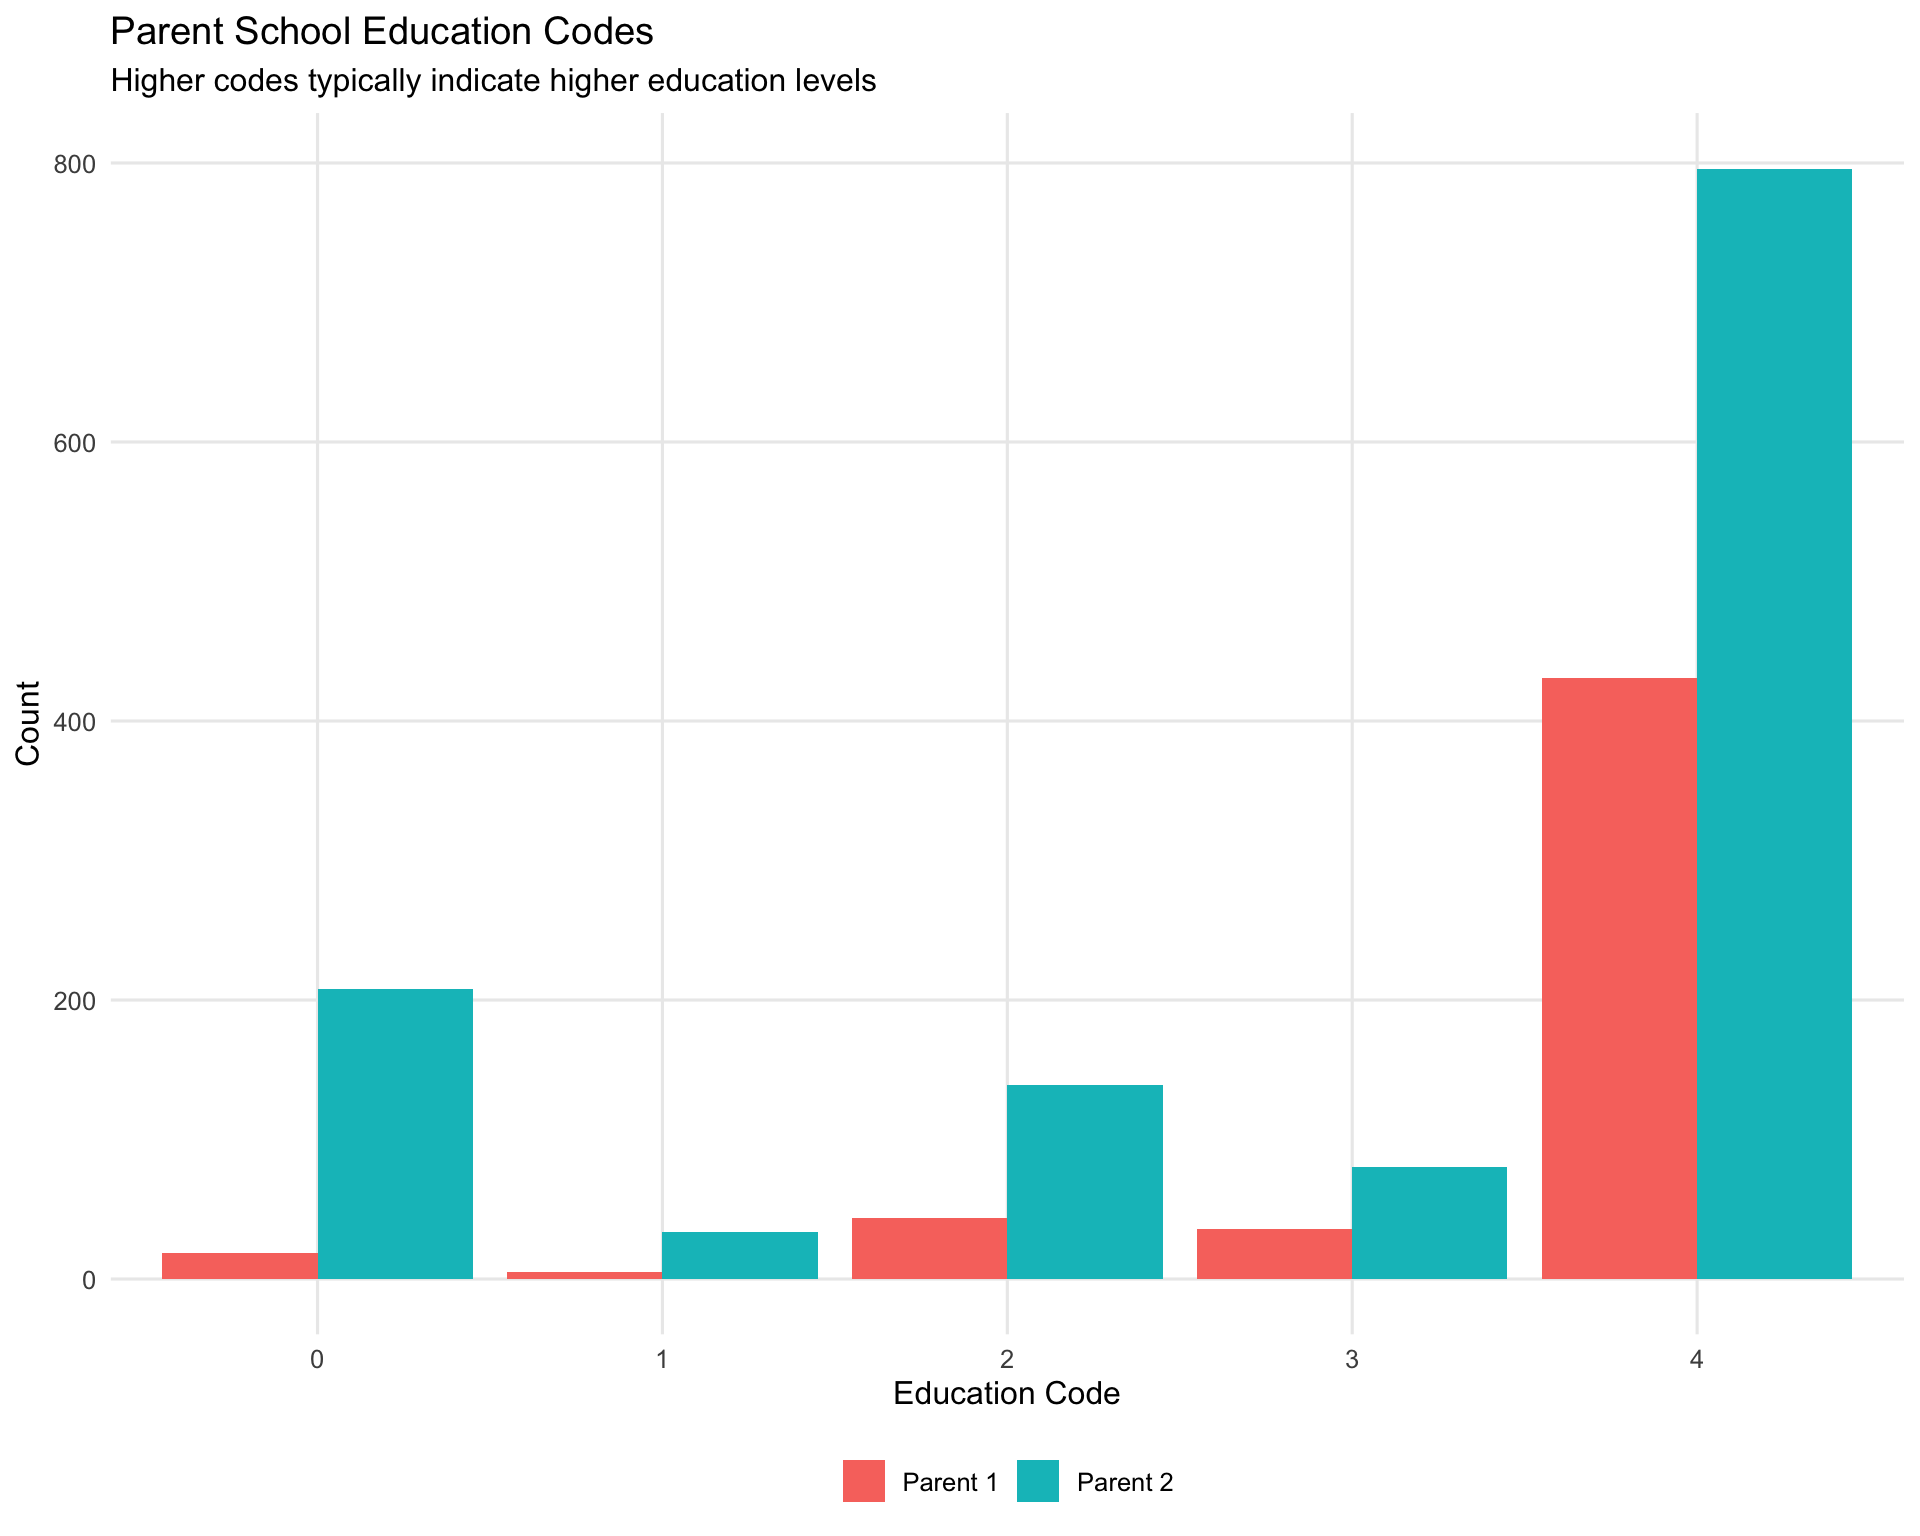
| p1_education | integer | SES |
| p1_nonschool_education | integer | SES |
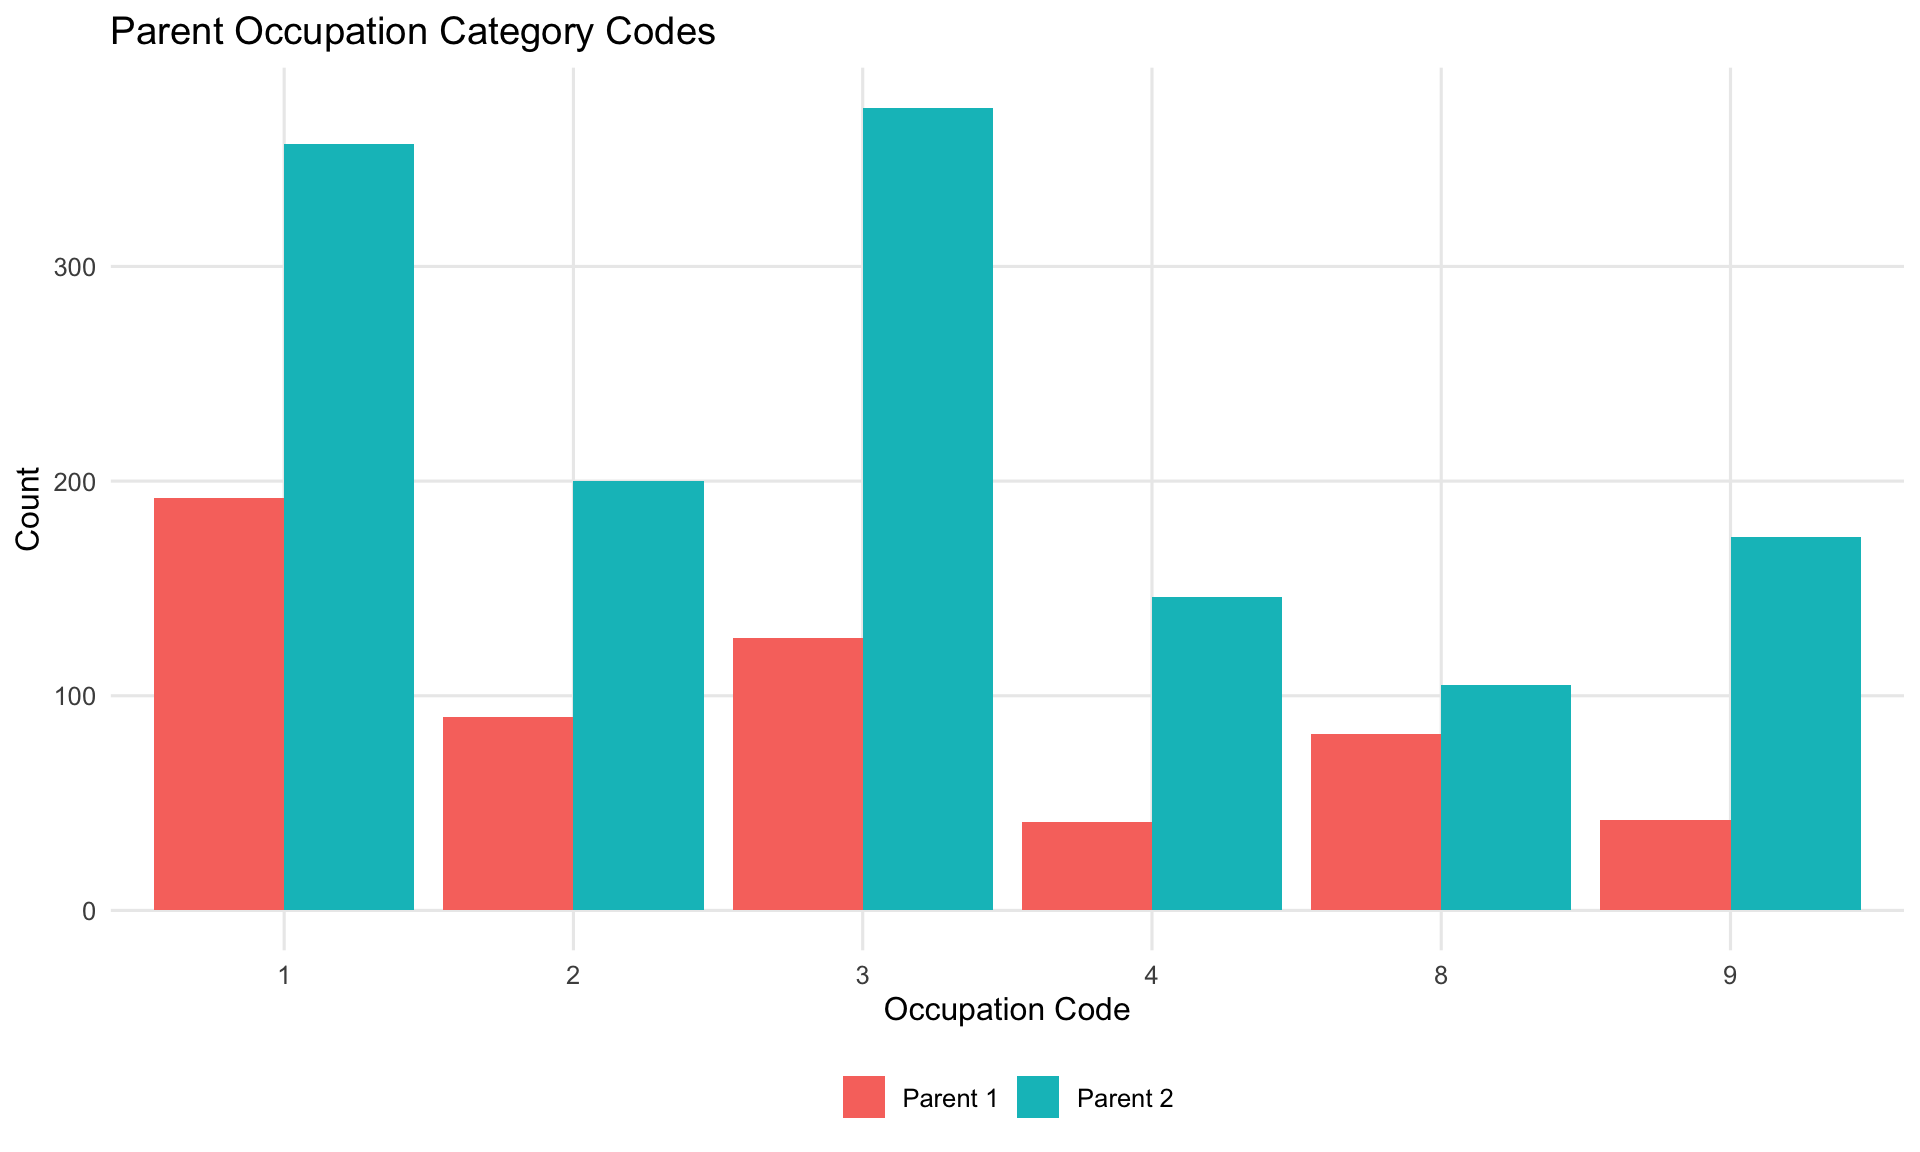
| p1_occupation | integer | SES |
| p2_education | integer | SES |
| p2_nonschool_education | integer | SES |
| p2_occupation | integer | SES |
| raw_age_check | character | SES |
| year_entry | integer | SES |
| year_level_mismatch | logical | SES |
| column | missing_rate | missing_pct | n_missing | status |
|---|---|---|---|---|
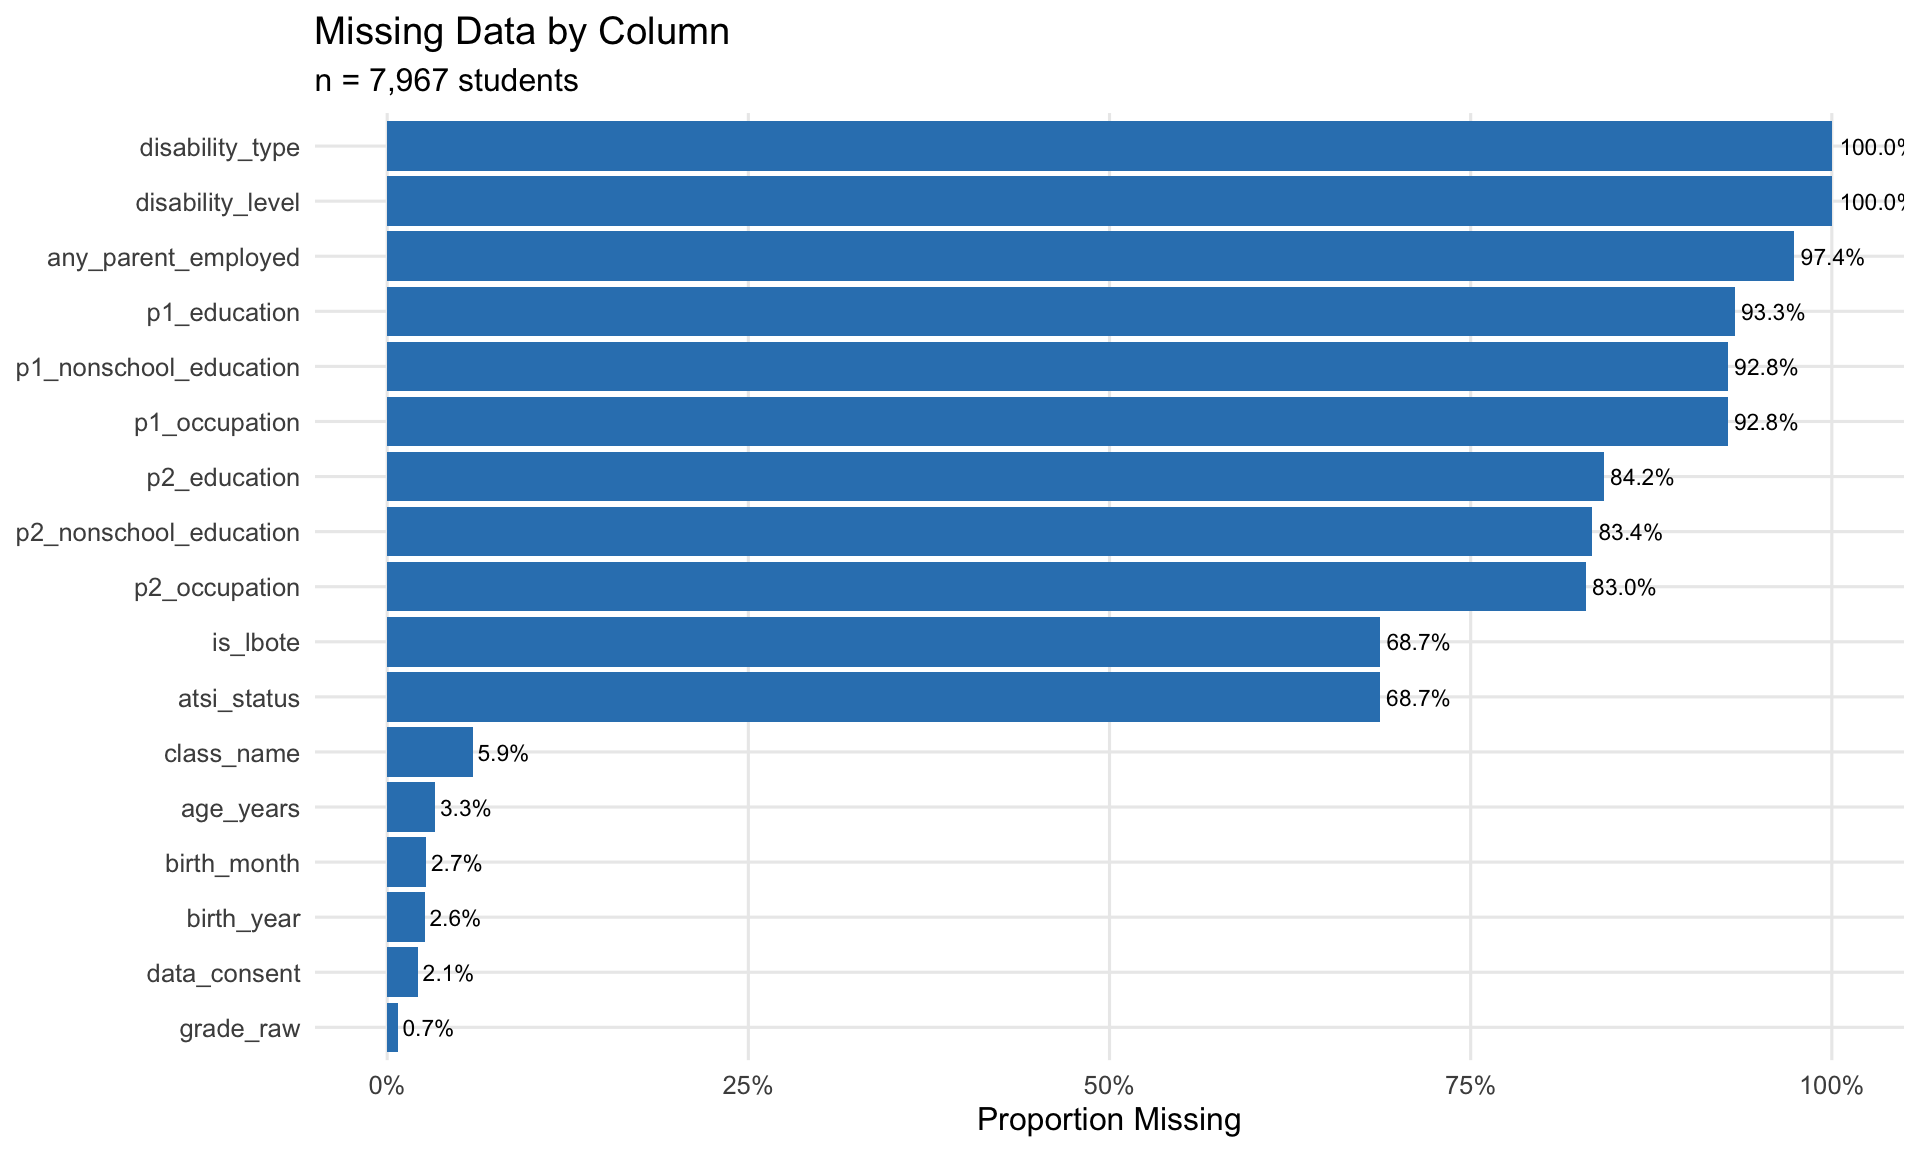
| disability_type | 1.0000000 | 100.0% | 7967 | > 50% missing |
| disability_level | 1.0000000 | 100.0% | 7967 | > 50% missing |
| any_parent_employed | 0.9741433 | 97.4% | 7761 | > 50% missing |
| p1_education | 0.9328480 | 93.3% | 7432 | > 50% missing |
| p1_nonschool_education | 0.9280783 | 92.8% | 7394 | > 50% missing |
| p1_occupation | 0.9279528 | 92.8% | 7393 | > 50% missing |
| p2_education | 0.8422242 | 84.2% | 6710 | > 50% missing |
| p2_nonschool_education | 0.8341910 | 83.4% | 6646 | > 50% missing |
| p2_occupation | 0.8297979 | 83.0% | 6611 | > 50% missing |
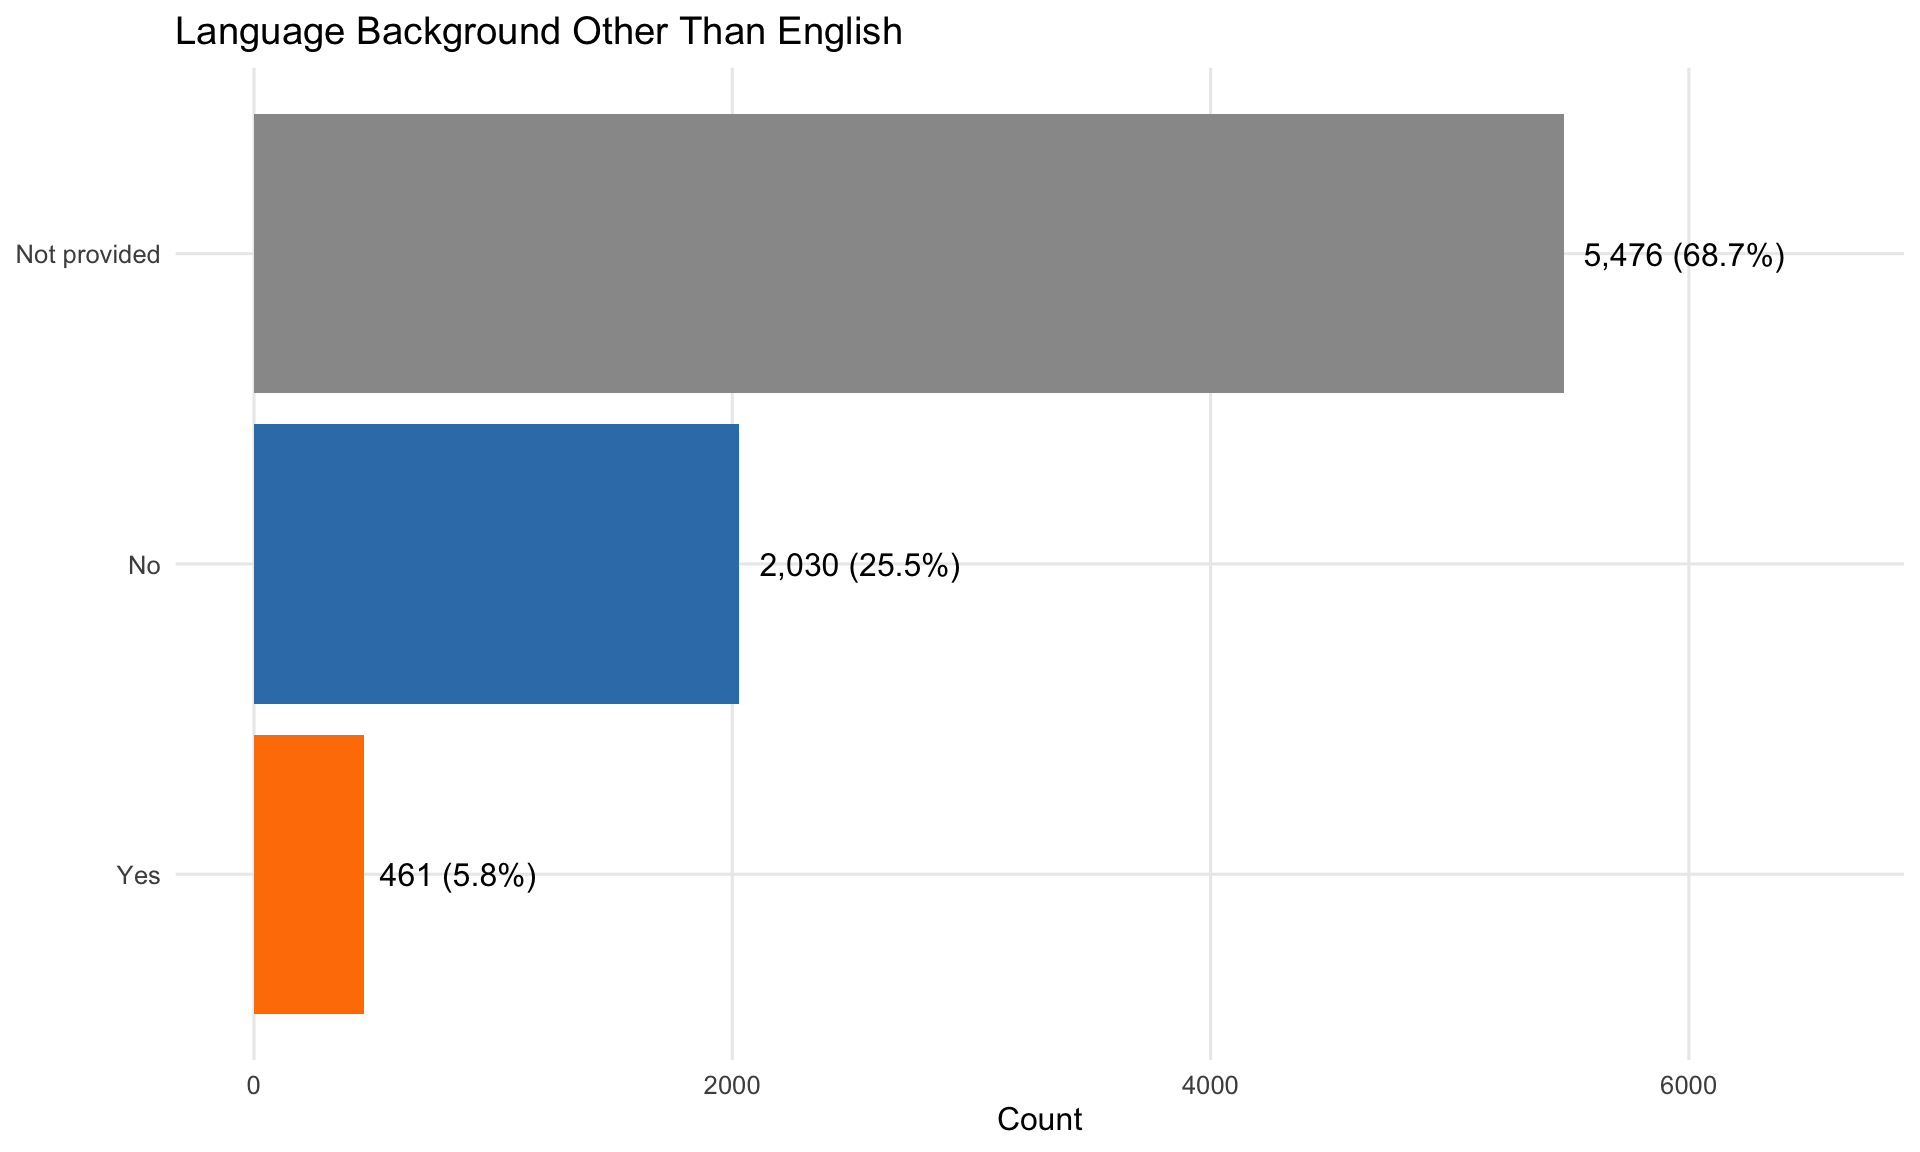
| is_lbote | 0.6873353 | 68.7% | 5476 | > 50% missing |
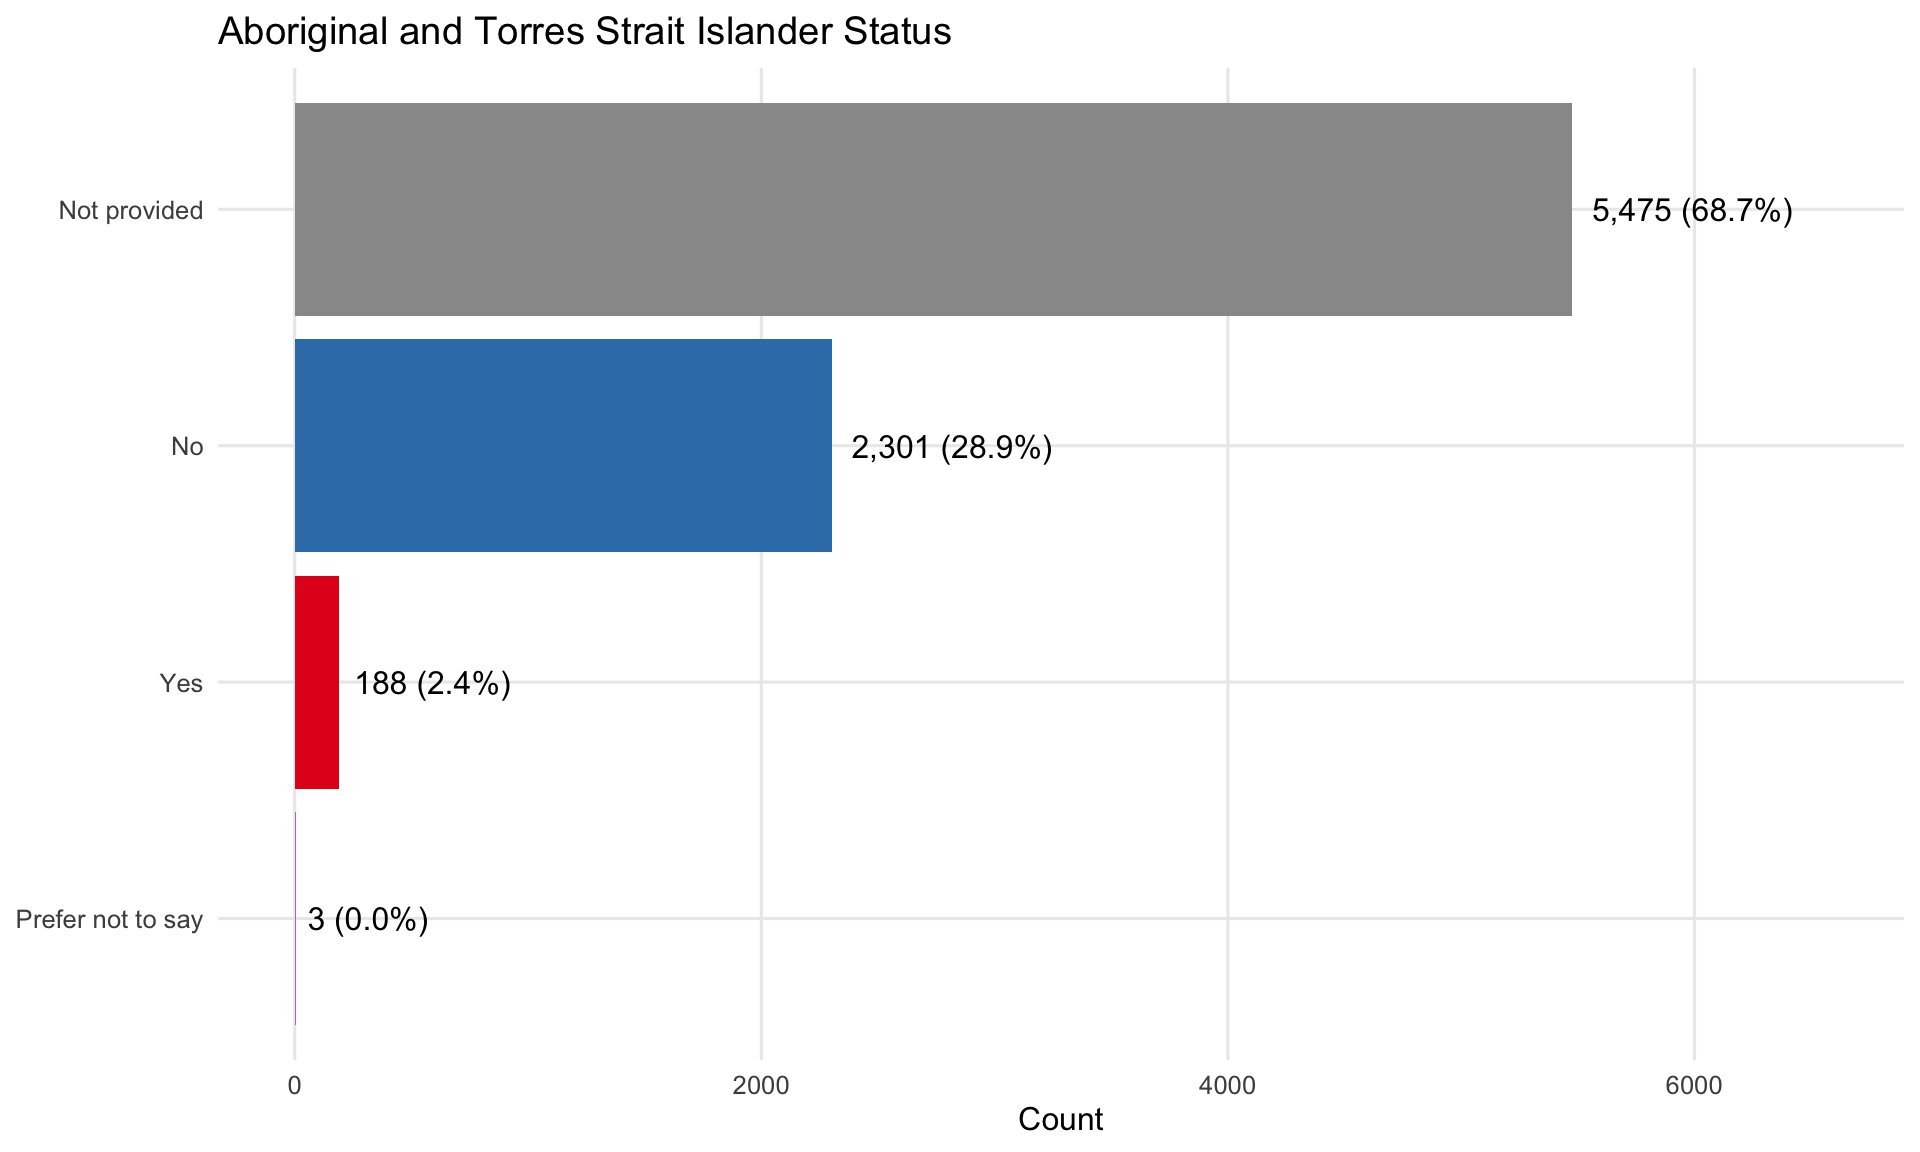
| atsi_status | 0.6872097 | 68.7% | 5475 | > 50% missing |
| year_level_screener | 0.2109954 | 21.1% | 1681 | 10-50% missing |
| age_raw | 0.1670641 | 16.7% | 1331 | 10-50% missing |
| class_name | 0.0591189 | 5.9% | 471 | < 10% missing |
| class_hash_id | 0.0591189 | 5.9% | 471 | < 10% missing |
| age_years | 0.0268608 | 2.7% | 214 | < 10% missing |
| birth_month | 0.0267353 | 2.7% | 213 | < 10% missing |
| birth_year | 0.0258567 | 2.6% | 206 | < 10% missing |
| data_consent | 0.0210870 | 2.1% | 168 | < 10% missing |
| grade_normalised | 0.0071545 | 0.7% | 57 | < 10% missing |
| grade_raw | 0.0071545 | 0.7% | 57 | < 10% missing |
| student_id | 0.0000000 | 0.0% | 0 | Complete |
| org_unit | 0.0000000 | 0.0% | 0 | Complete |
| organisation | 0.0000000 | 0.0% | 0 | Complete |
| org_identifier | 0.0000000 | 0.0% | 0 | Complete |
| org_unit_identifier | 0.0000000 | 0.0% | 0 | Complete |
| year_level_from_grade | 0.0000000 | 0.0% | 0 | Complete |
| year_level_mismatch | 0.0000000 | 0.0% | 0 | Complete |
| age_years_implausible | 0.0000000 | 0.0% | 0 | Complete |
| birth_month_suspect | 0.0000000 | 0.0% | 0 | Complete |
| birth_year_suspect | 0.0000000 | 0.0% | 0 | Complete |
| raw_age_check | 0.0000000 | 0.0% | 0 | Complete |
| year_entry | 0.0000000 | 0.0% | 0 | Complete |
| has_disability | 0.0000000 | 0.0% | 0 | Complete |
| has_ses_data | 0.0000000 | 0.0% | 0 | Complete |
Data completeness varies significantly across schools. The overall completeness score is calculated as the average of five key fields:
A score of 100% means all five fields are complete for all students in that school; 0% means none are recorded.
Schools with complete demographic data (>90%): 22 Schools with sparse data (<10%): 0 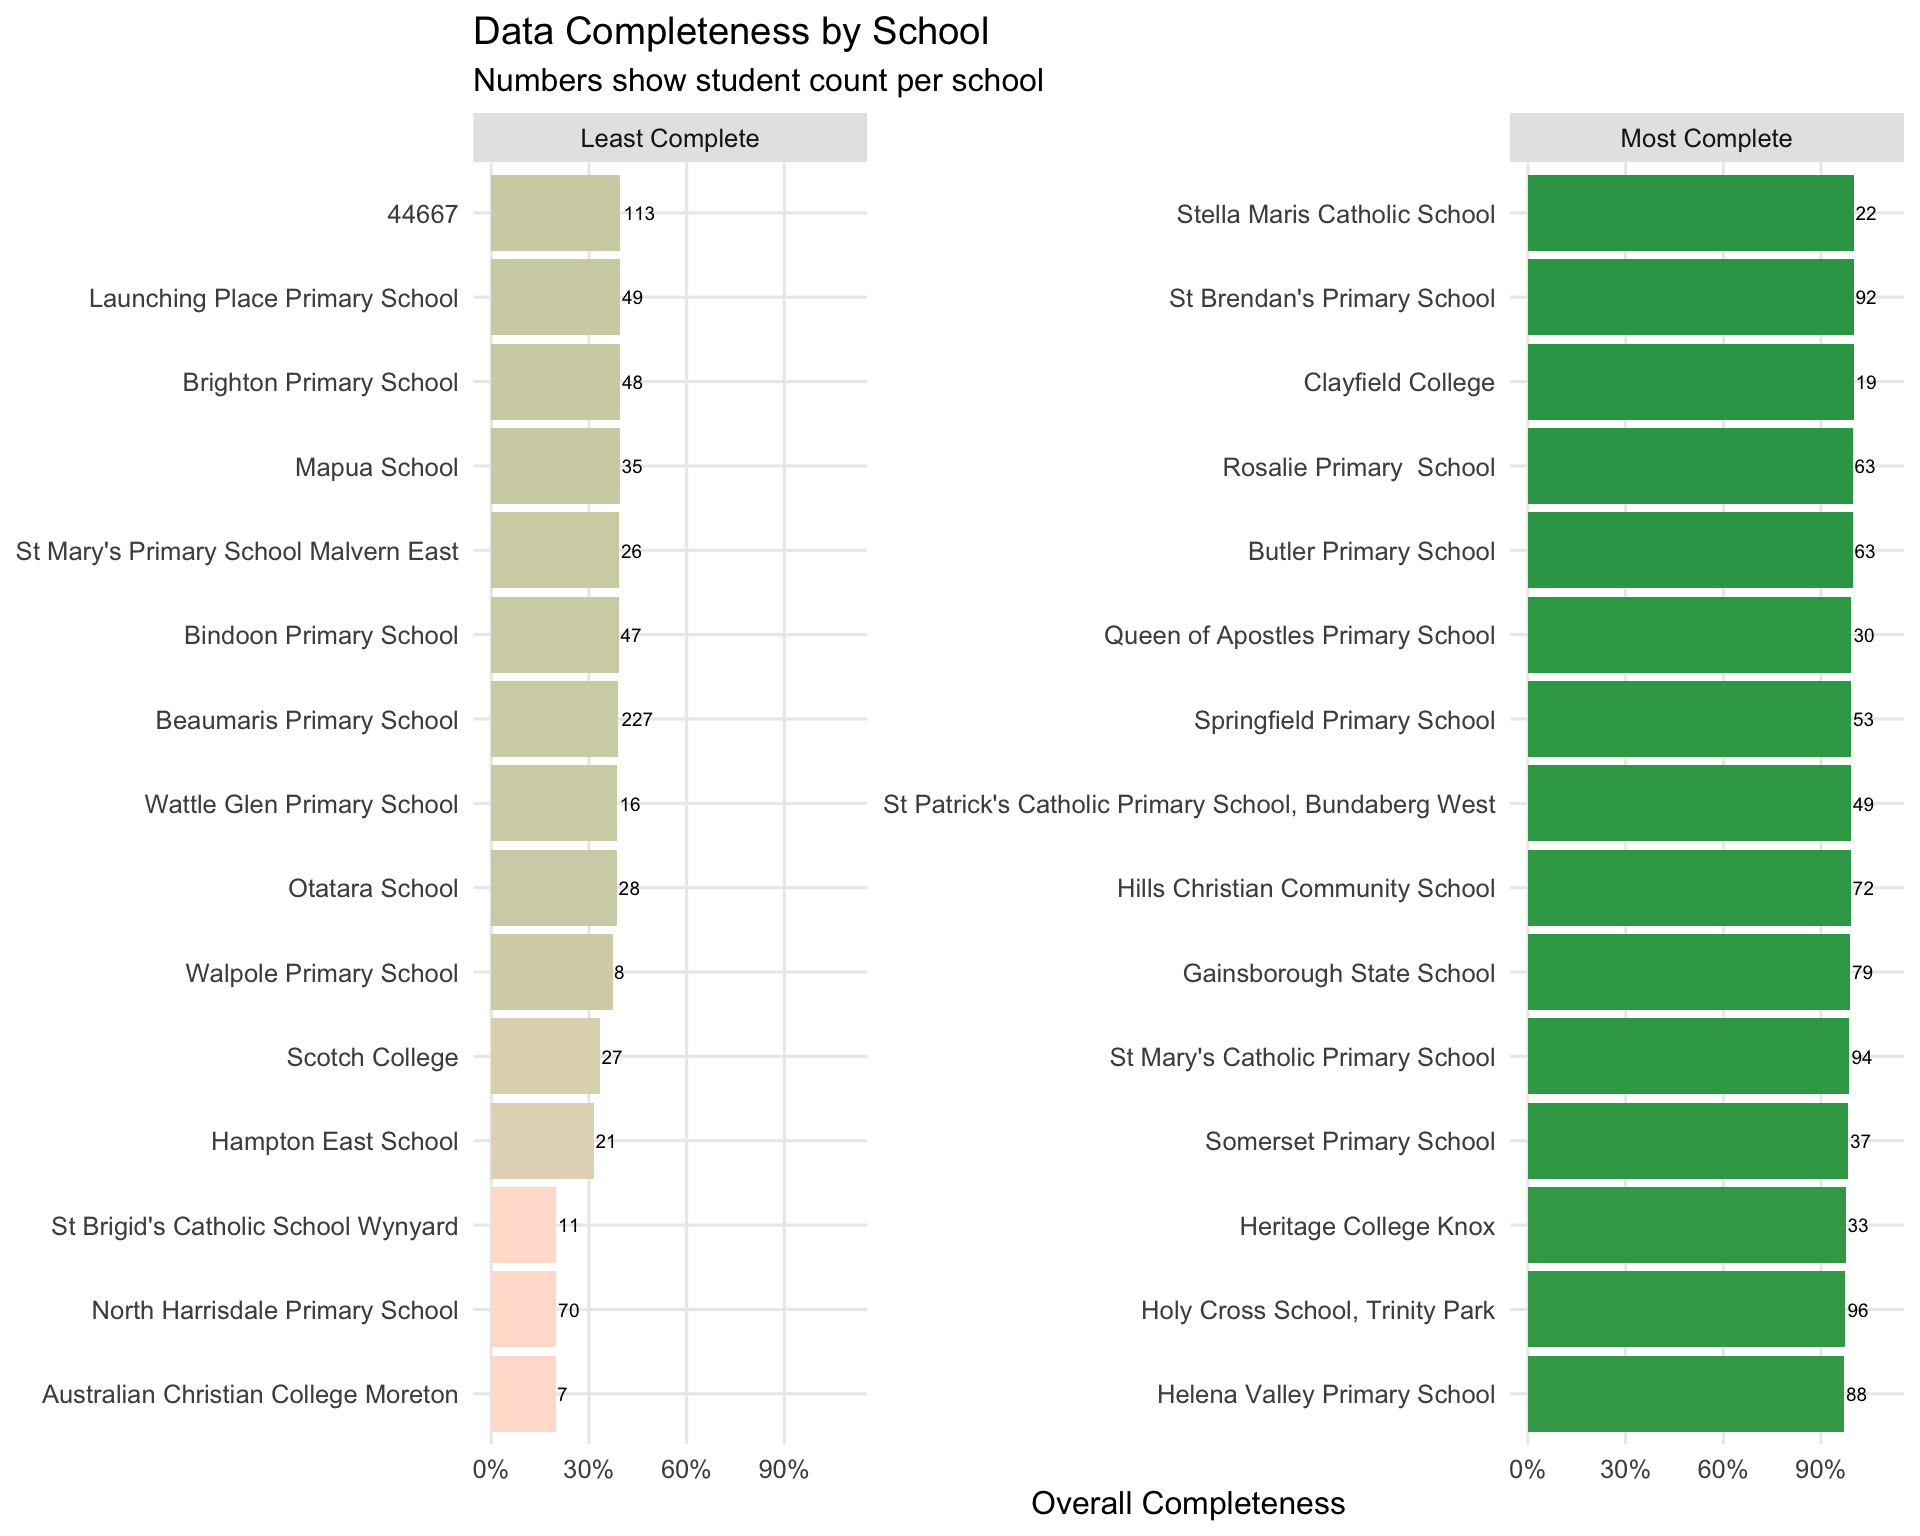
Students per school:# A tibble: 1 × 6
min q1 median mean q3 max
<int> <dbl> <dbl> <dbl> <dbl> <int>
1 2 22 42.5 53.1 72.8 253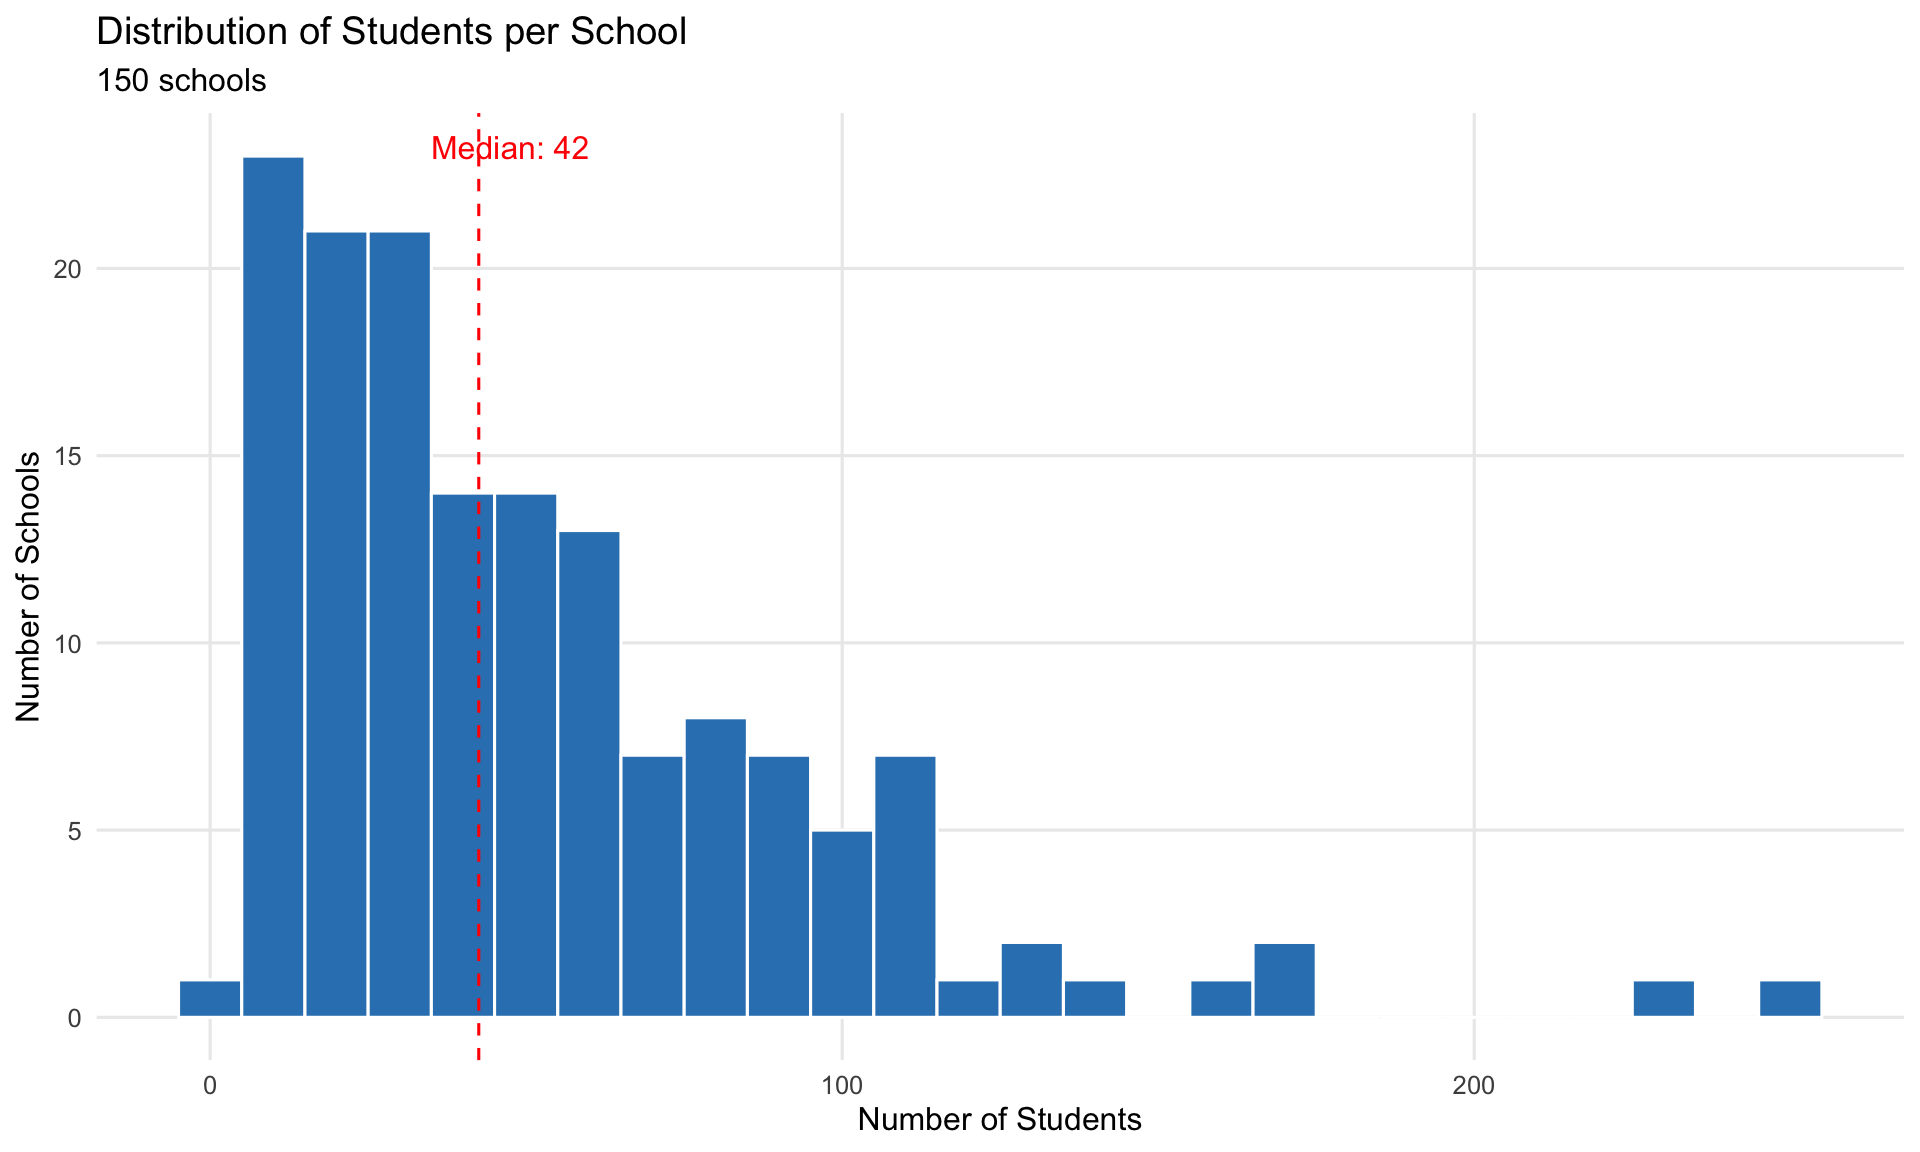
Total classes: 618 Class size summary: Min. 1st Qu. Median Mean 3rd Qu. Max.
1.00 7.00 11.00 12.13 16.00 59.00 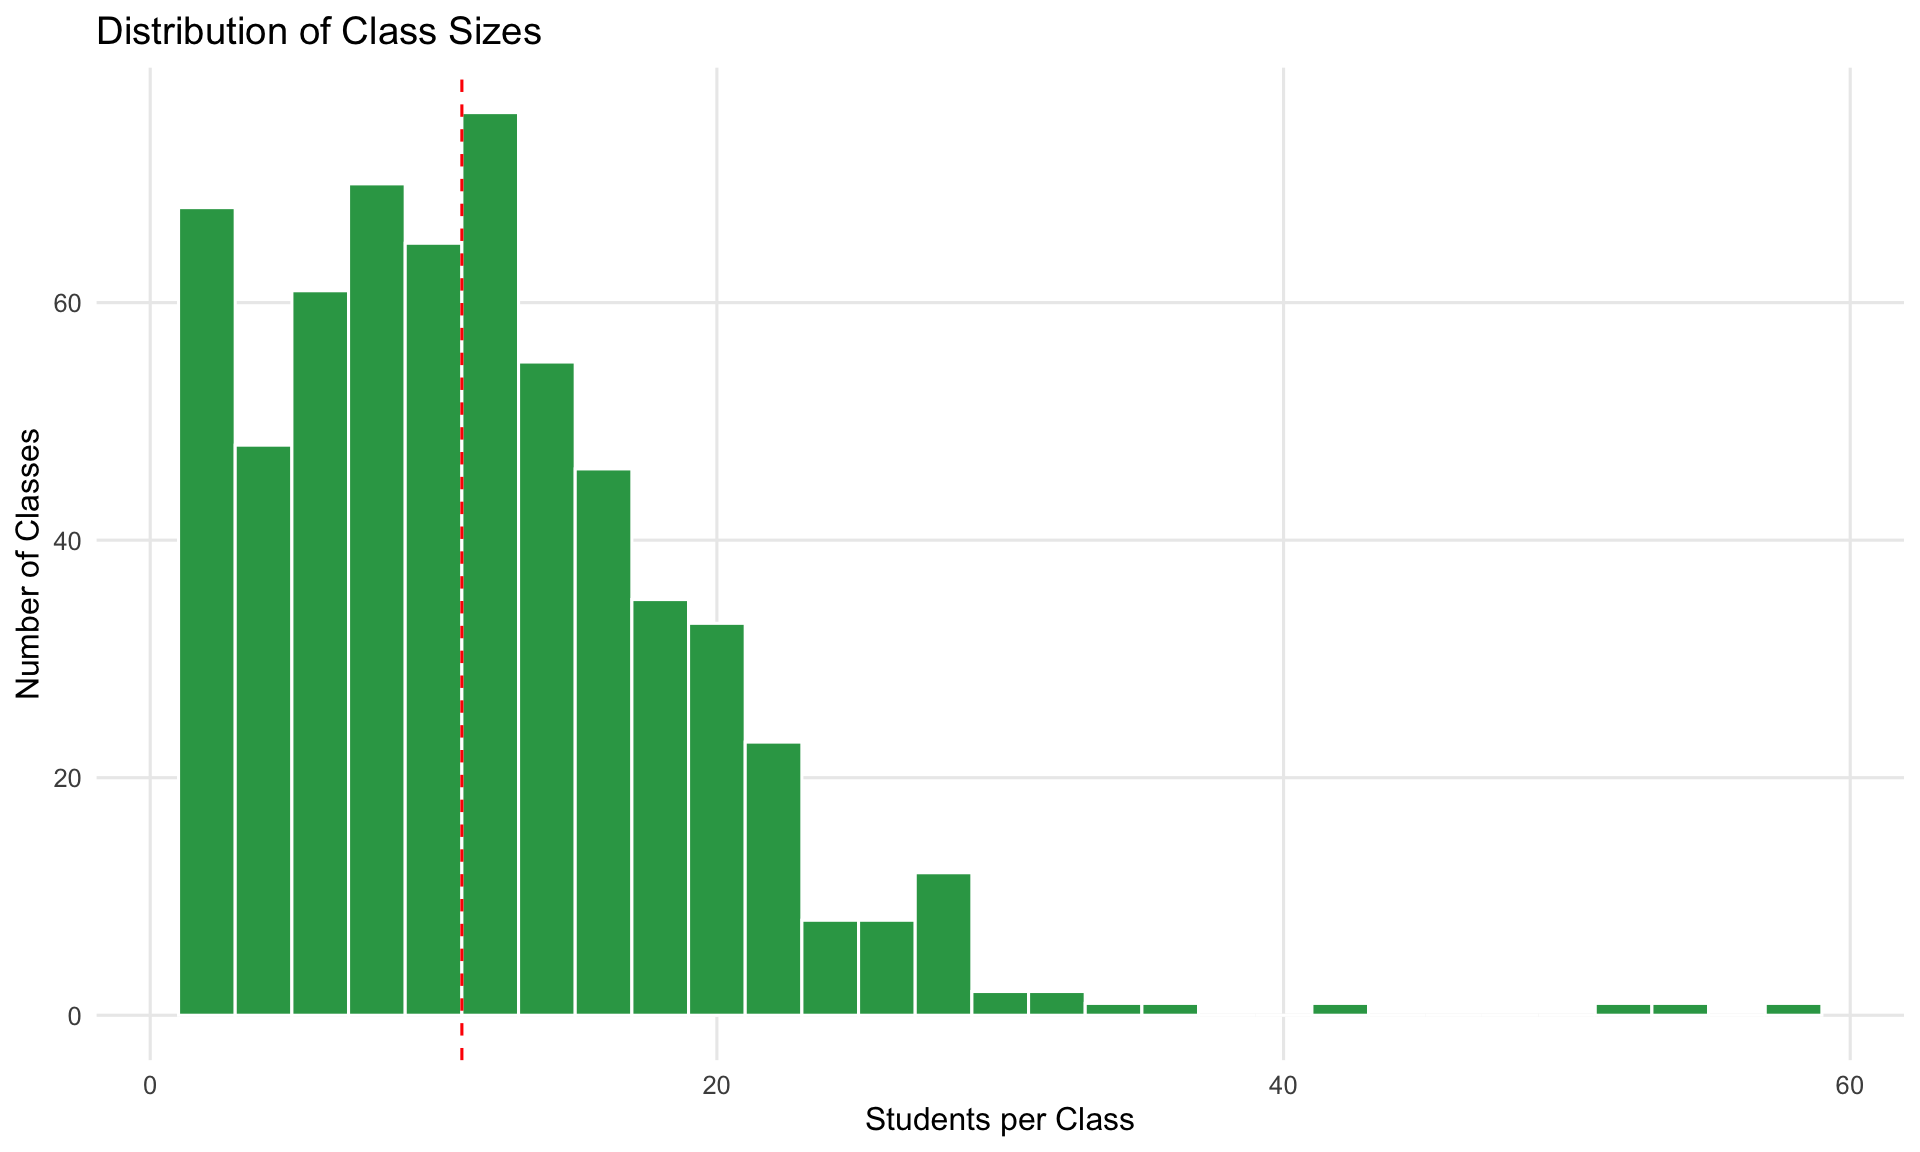
=== Classes per school by year level ===Foundation classes per school: Min. 1st Qu. Median Mean 3rd Qu. Max.
0.00 1.00 1.00 1.73 3.00 9.00
Year 1 classes per school: Min. 1st Qu. Median Mean 3rd Qu. Max.
0.00 1.00 2.00 2.02 3.00 8.00 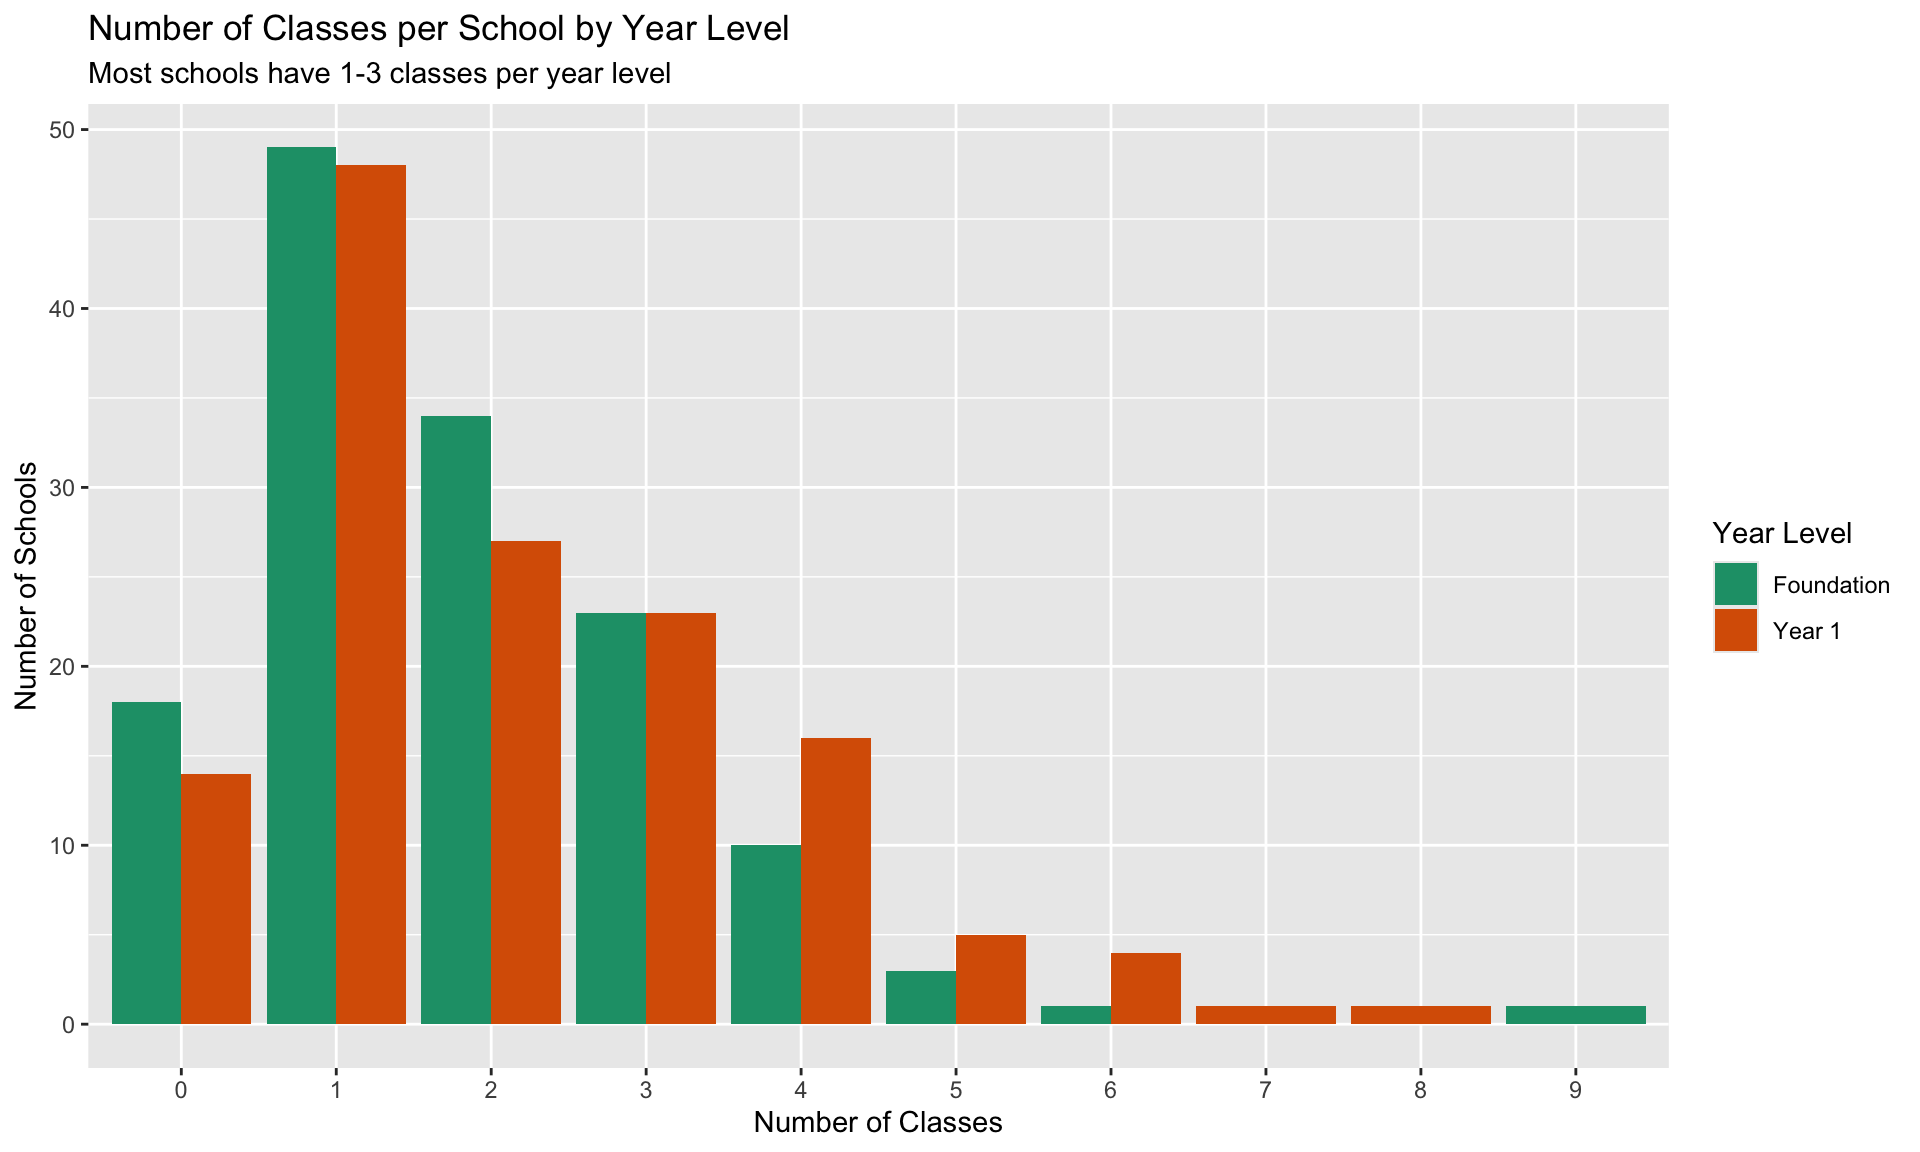
| School | F Classes | Y1 Classes | F Avg Size | Y1 Avg Size |
|---|---|---|---|---|
| Gilgai Plains Primary School | 9 | 7 | 16.3 | 14.6 |
| Bentleigh West Primary School | 6 | 5 | 10.3 | 11.0 |
| Kin Kora State School | 5 | 6 | 6.0 | 5.7 |
| Mackay West State School | 5 | 6 | 6.2 | 6.2 |
| Rosalie Primary School | 4 | 5 | 9.2 | 5.2 |
| Templestowe Heights Primary School | 4 | 5 | 11.8 | 10.8 |
| Wimba Primary School | 5 | 4 | 4.6 | 2.2 |
| Brighton Primary School | 4 | 4 | 8.2 | 3.8 |
| Butler Primary School | 2 | 6 | 13.0 | 6.2 |
| Carnegie Primary School | 4 | 4 | 6.2 | 8.0 |
| Gainsborough State School | 0 | 8 | 0.0 | 8.5 |
| Makybe Rise PS | 4 | 4 | 14.5 | 12.2 |
| Mount Lockyer PS | 3 | 5 | 15.0 | 10.6 |
| Our Lady Queen of Peace Greystanes | 4 | 4 | 6.0 | 6.5 |
| Beaumaris Primary School | 4 | 3 | 11.8 | 12.3 |
# A tibble: 3 × 6
  year_level_screener     n mean_age sd_age min_age max_age
  <chr>               <int>    <dbl>  <dbl>   <dbl>   <dbl>
1 foundation           3013     5.43  0.450    3.42    11.5
2 year1                3152     6.44  1.94     3.67   112.
3 <NA>                 1588     5.91  0.725    3.42    13.8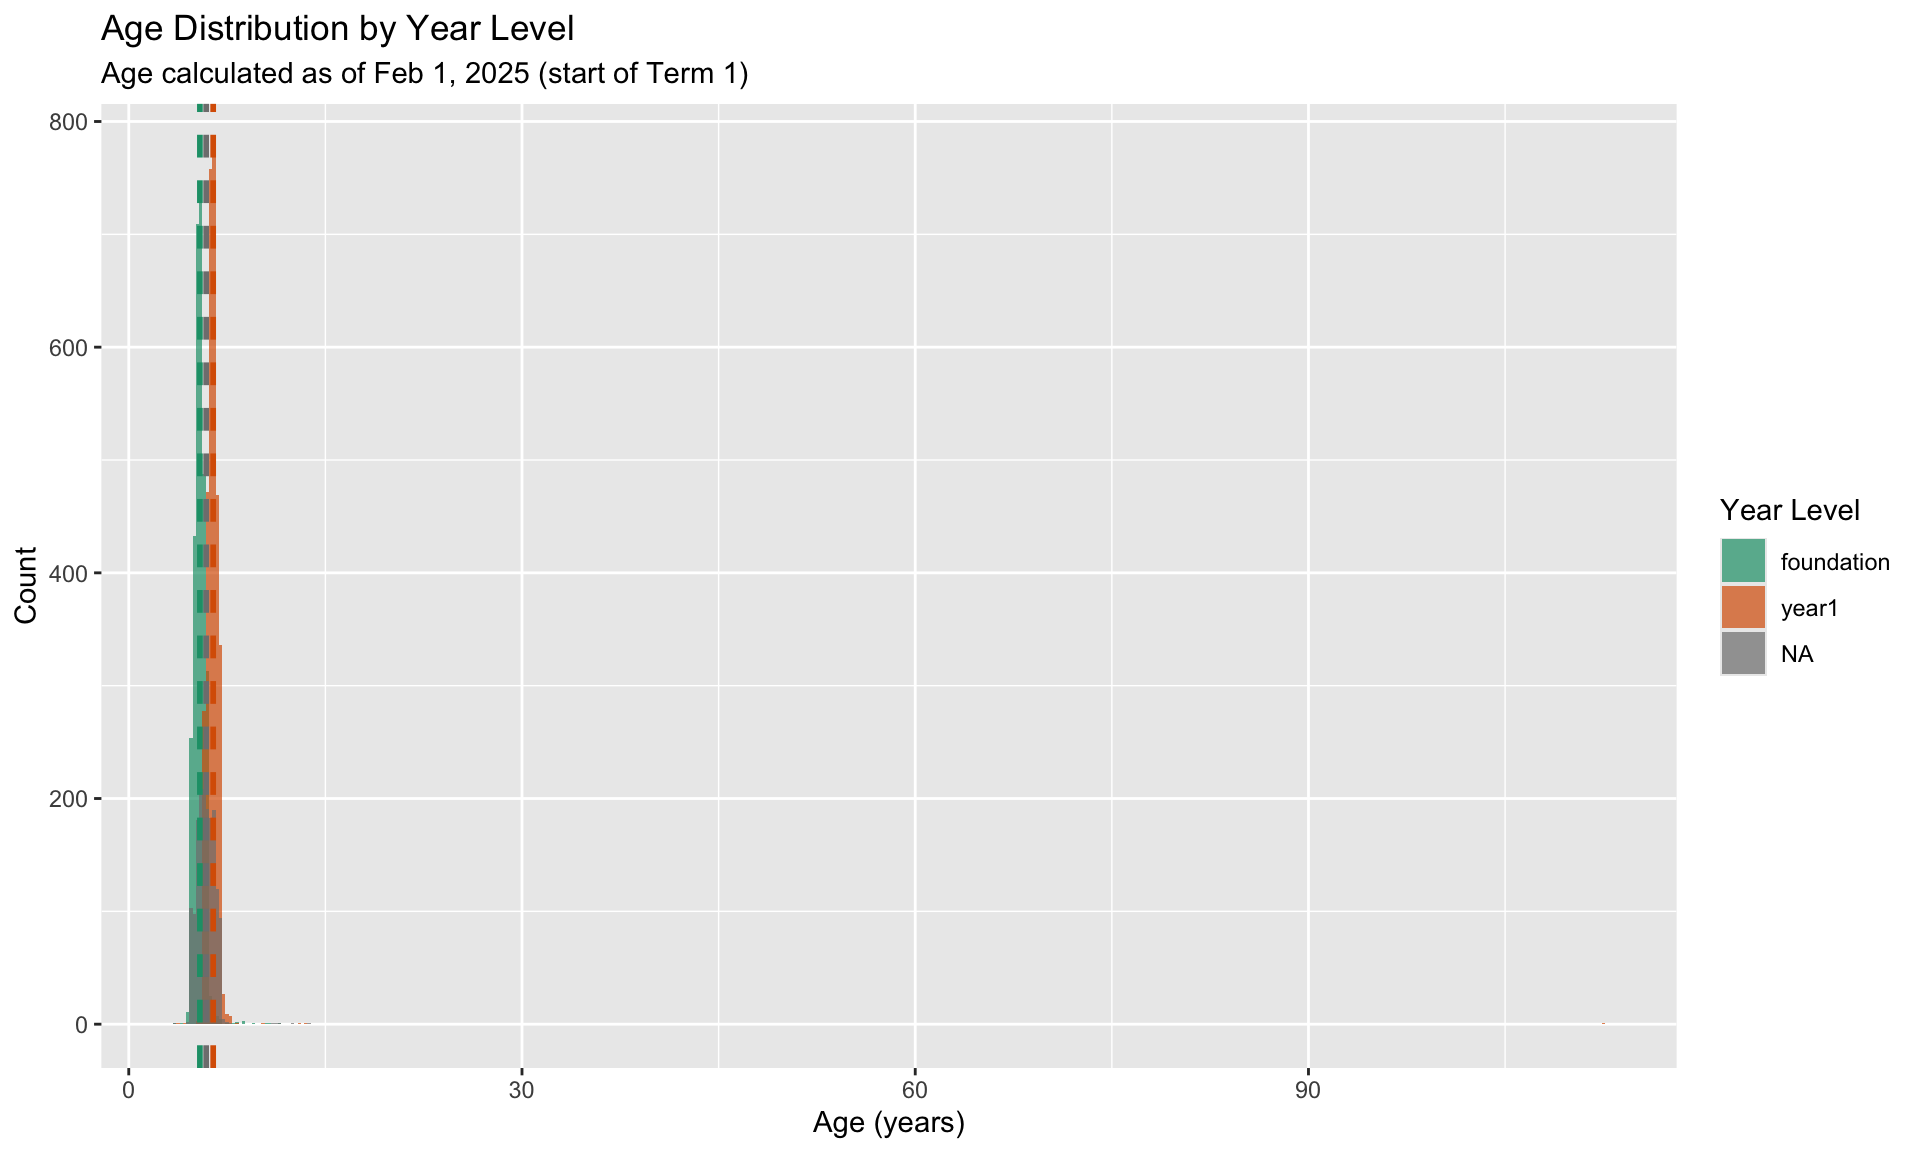
Students with disability information: 0 (0.0%) Students with any SES data: 1373 (17.2%) 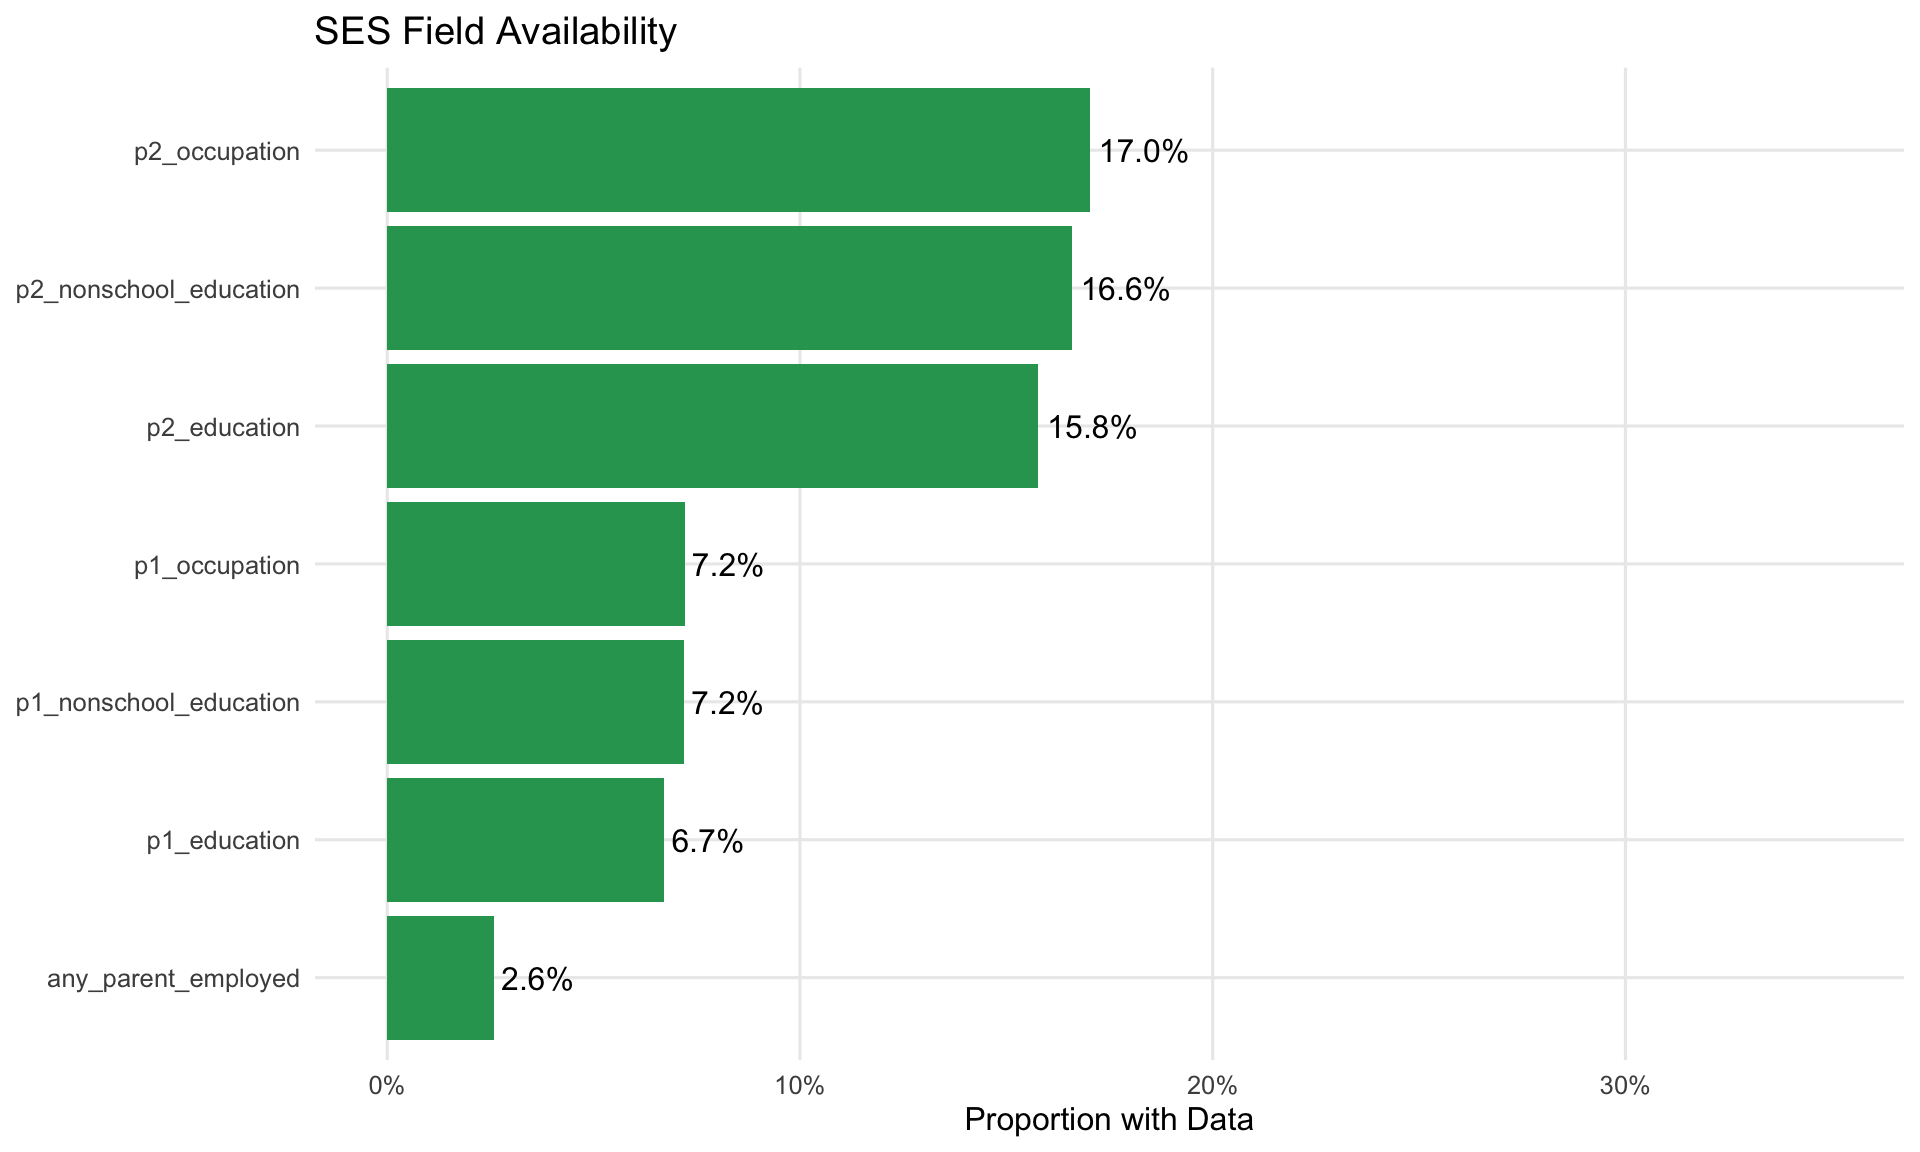
| dataset | n_students | in_metadata | pct_in_metadata | not_in_metadata |
|---|---|---|---|---|
| Metadata | 7967 | 7967 | 1.0000000 | 0 |
| Responses | 6362 | 6360 | 0.9996856 | 2 |
| PAT Scores | 714 | 714 | 1.0000000 | 0 |
| Teacher Ratings | 2358 | 2358 | 1.0000000 | 0 |
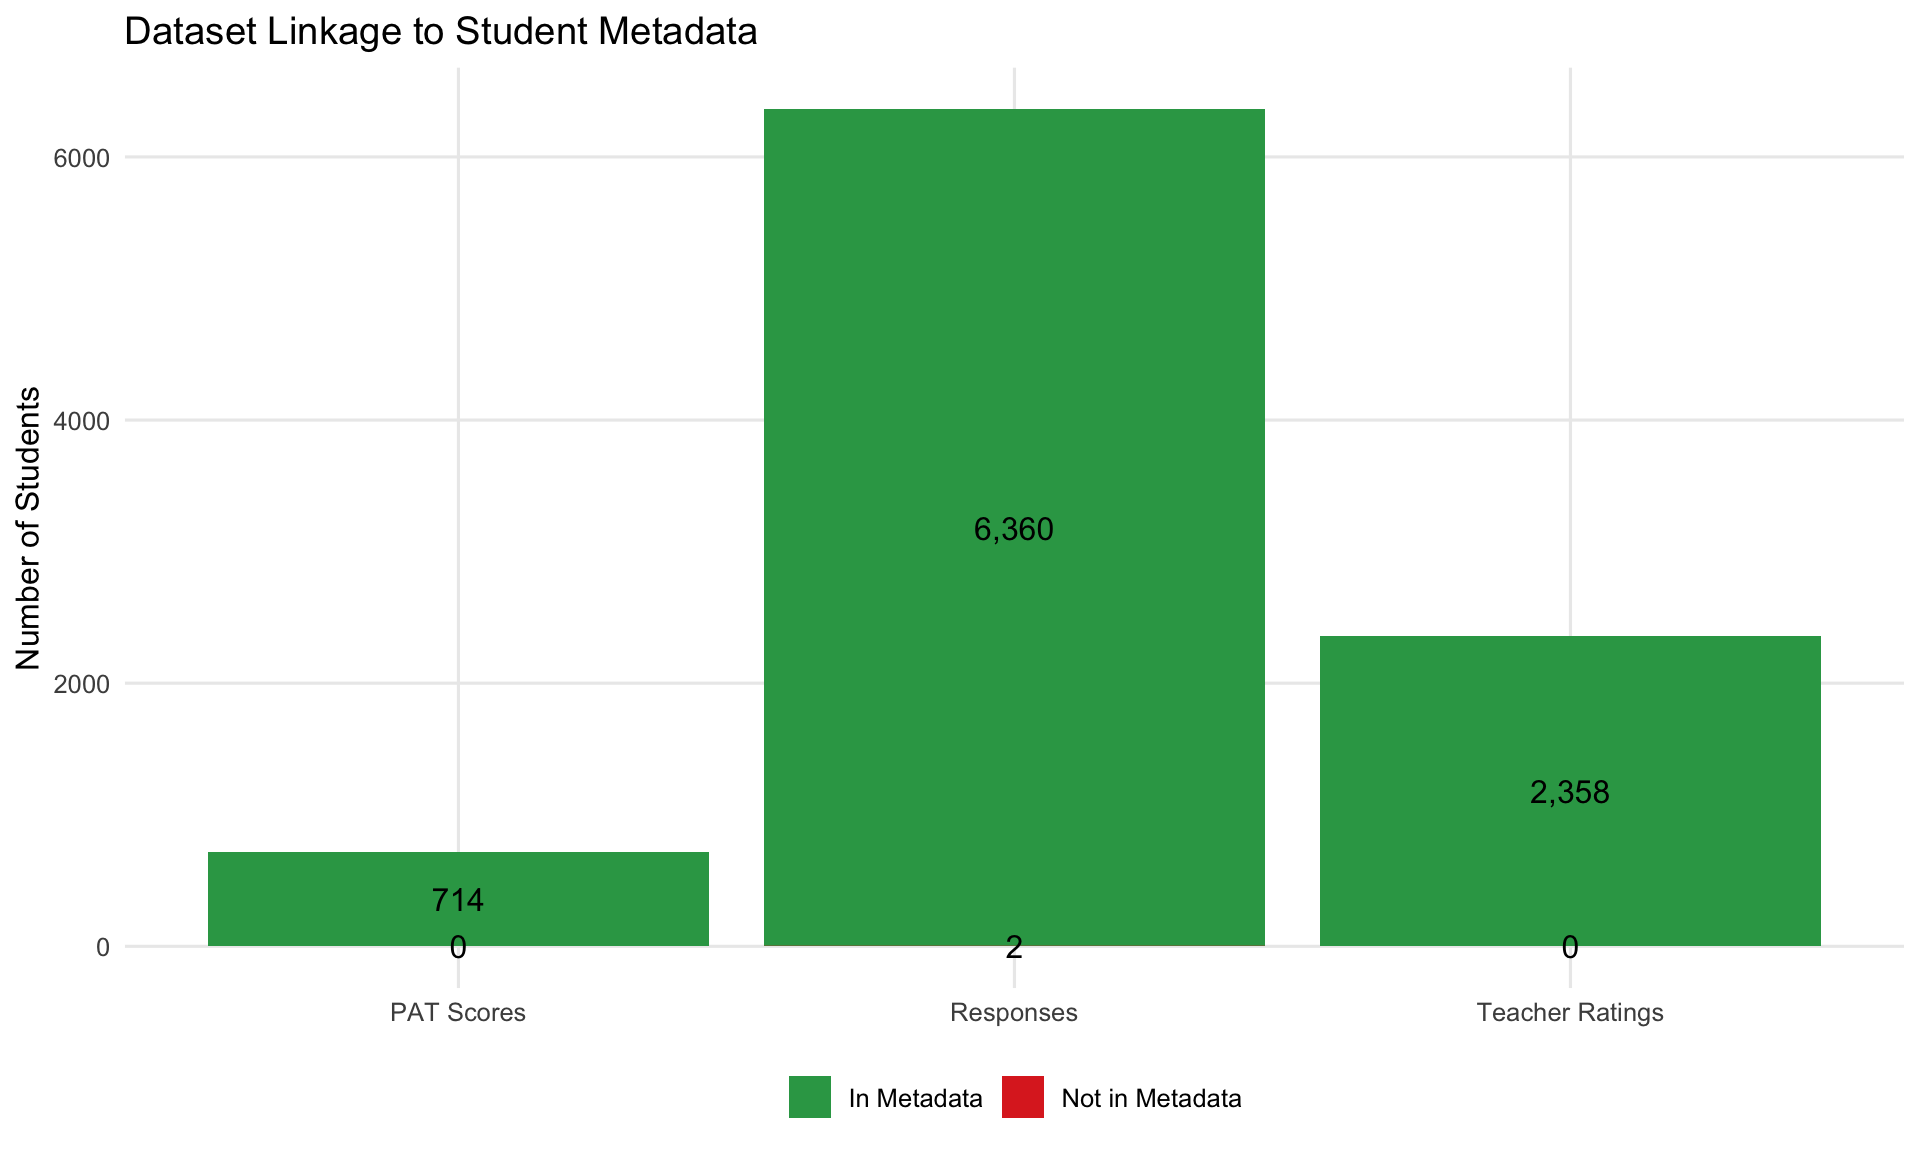
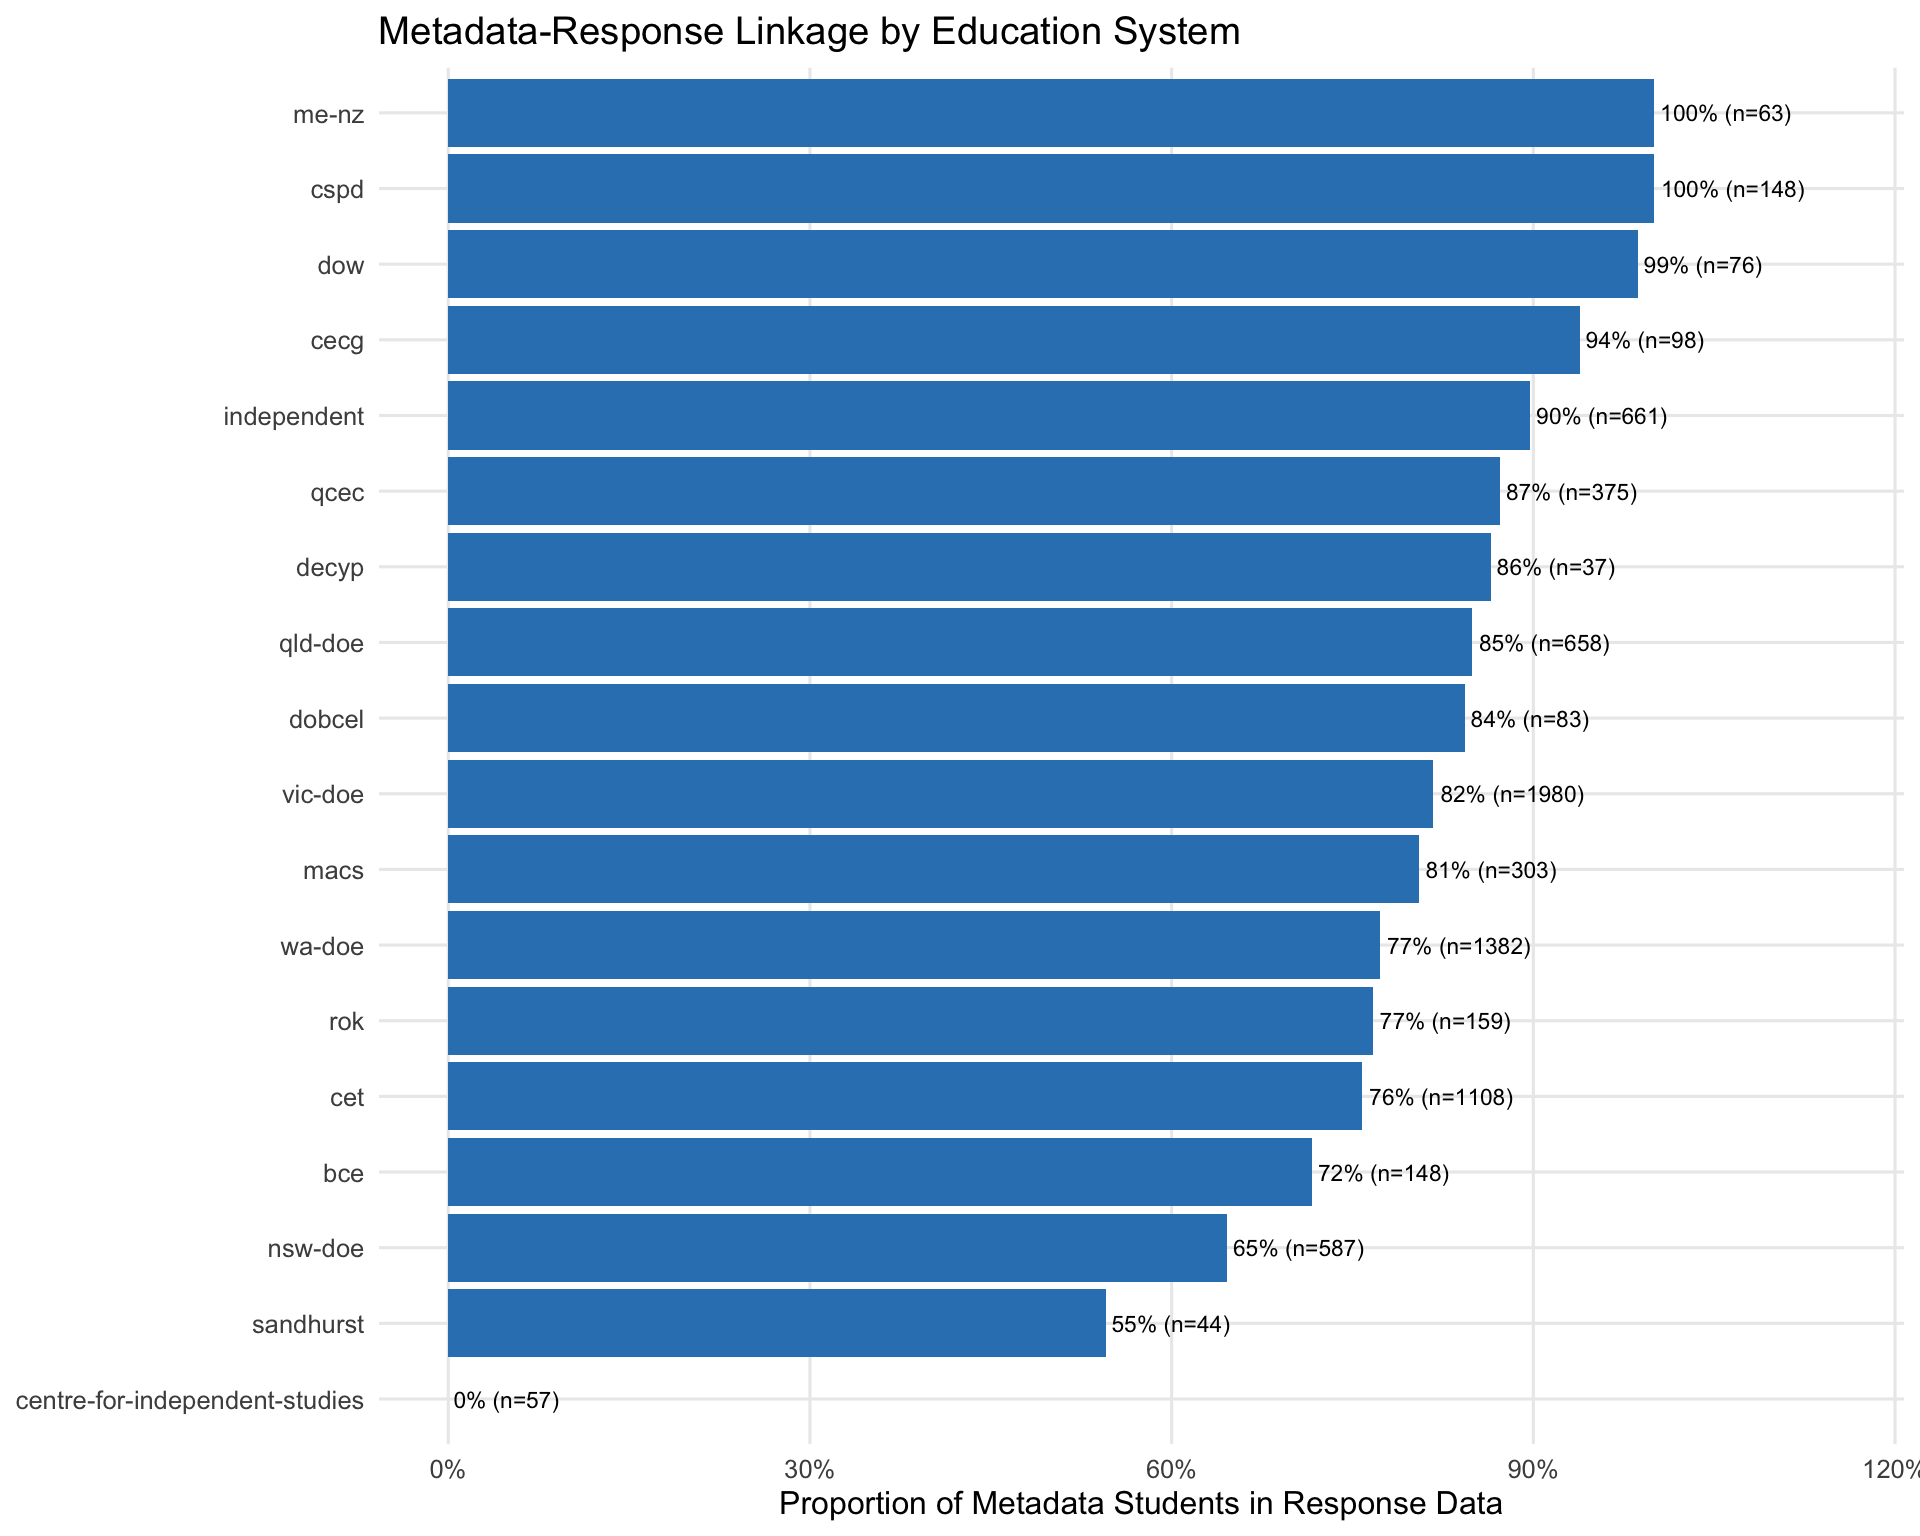
Metadata students found in responses: 6360 / 7967 (79.8%) Metadata students with PAT scores: 714 / 7967 (9.0%) Metadata students with teacher ratings: 2358 / 7967 (29.6%) | year_level_screener | n_students | in_responses | with_pat | with_teacher | pct_responses | pct_pat | pct_teacher |
|---|---|---|---|---|---|---|---|
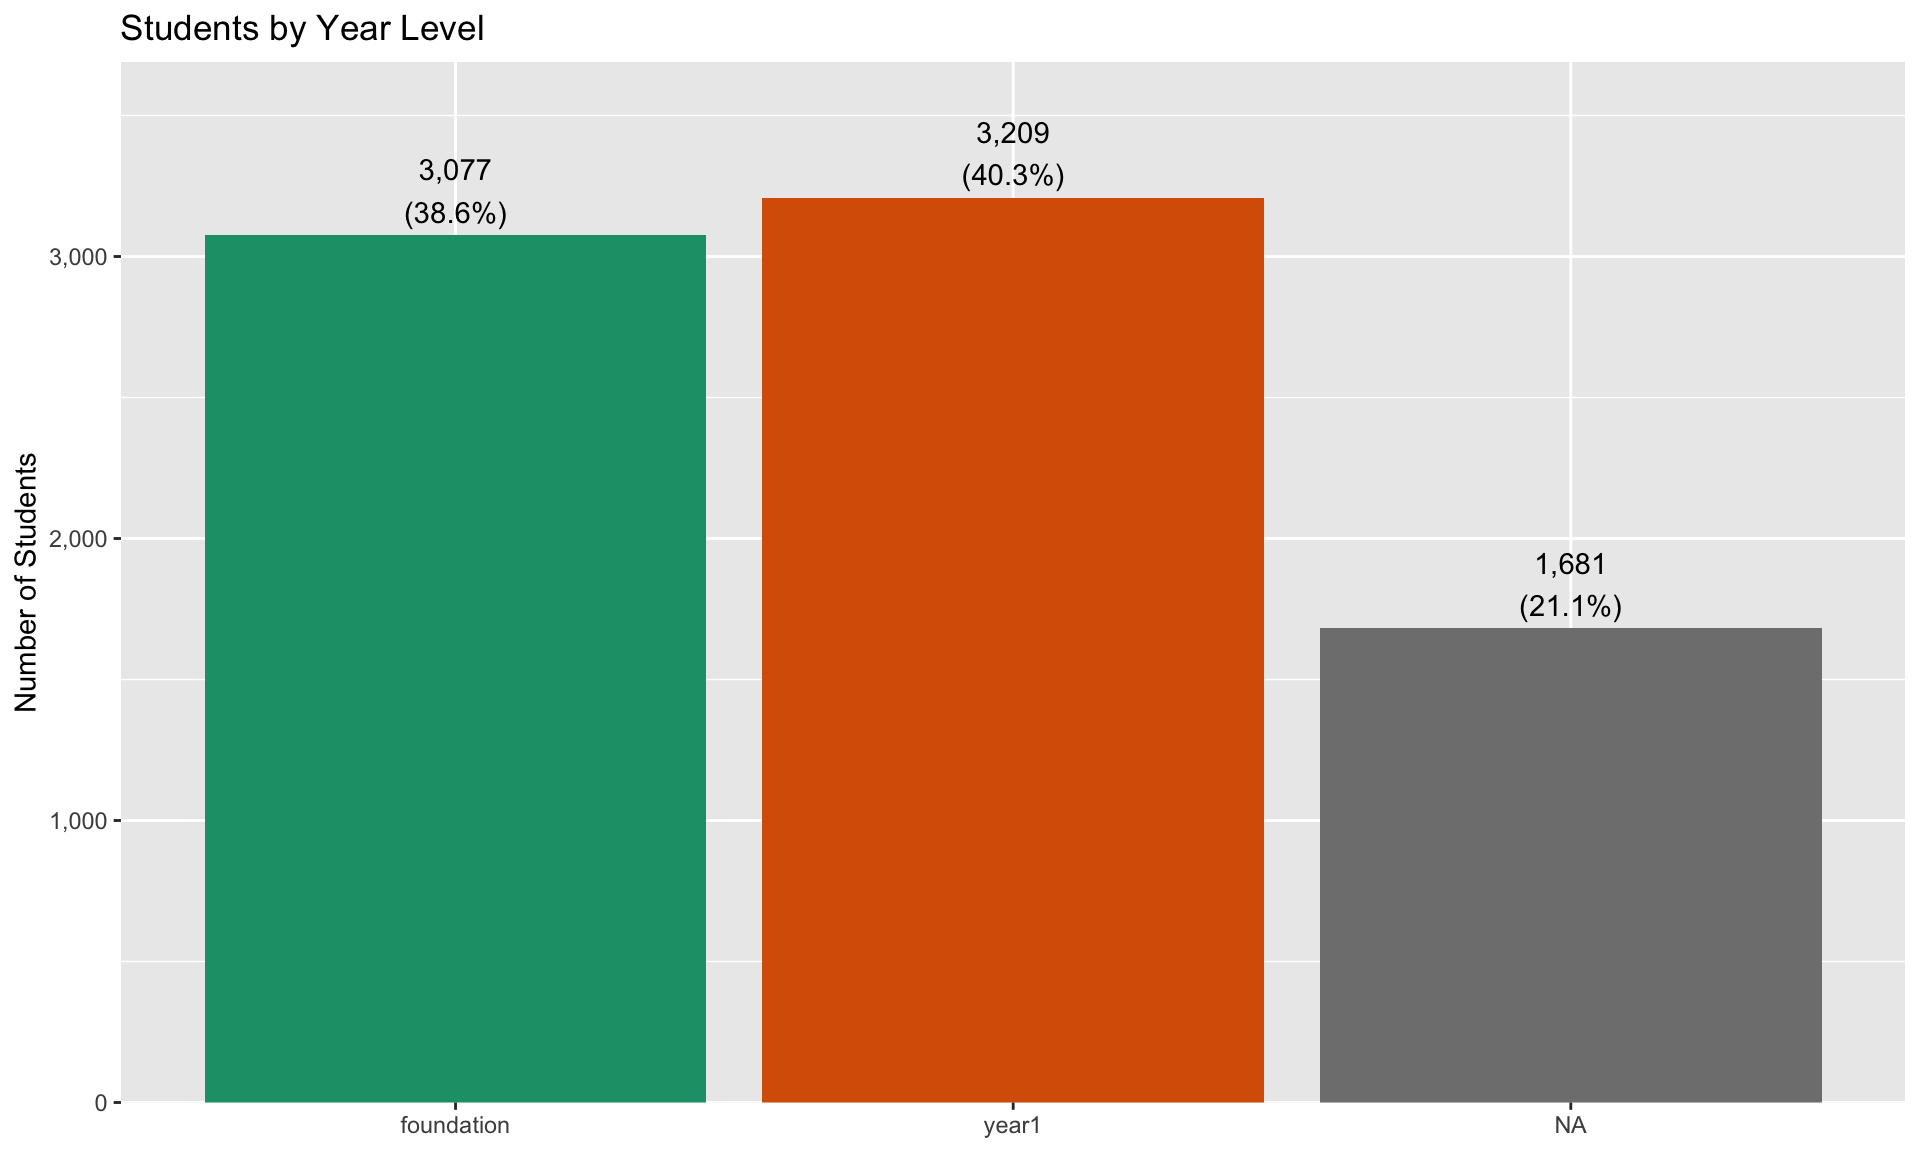
| foundation | 3077 | 3077 | 238 | 1061 | 3077 | 0.0773481 | 0.3448164 |
| year1 | 3209 | 3209 | 464 | 1179 | 3209 | 0.1445933 | 0.3674042 |
| NA | 1681 | 74 | 12 | 118 | 74 | 0.0071386 | 0.0701963 |
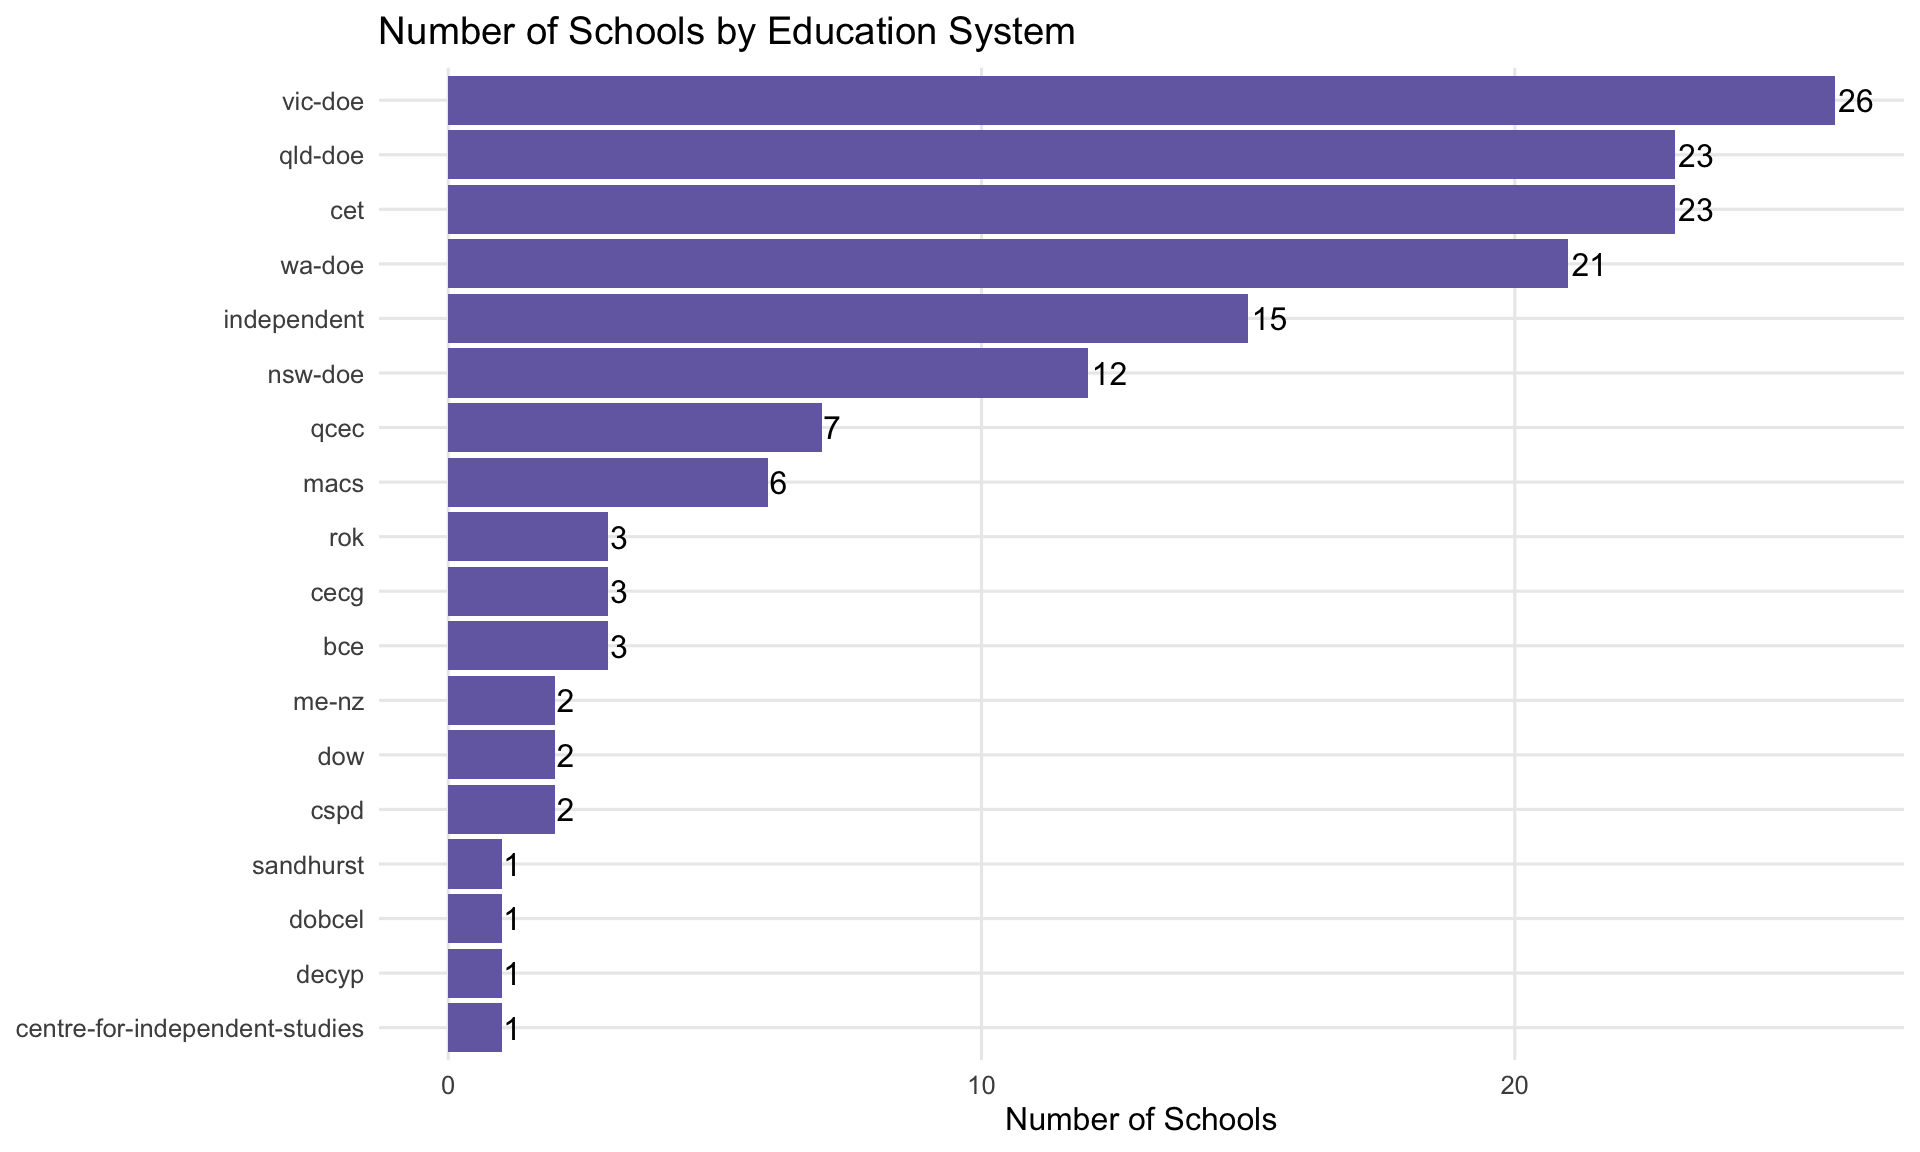
=== DATASET OVERVIEW ===Total students: 7,967 Schools: 150 Classes: 633 Education systems: 18 === YEAR LEVEL ===Foundation: NA (NA) Year 1: NA (NA) === DATA COMPLETENESS ===Age data available: 97.3% ATSI status known: 31.3% LBOTE status known: 31.3% SES data available: 17.2% Data consent recorded: 97.9% === DATA QUALITY FLAGS ===Students with disability info: 0 === LINKAGE ===In response data: 79.8% Have PAT scores: 714 students ( 9.0% of metadata)Have teacher ratings: 2,358 students ( 29.6% of metadata)Report generated: 2026-06-13 18:15:42.722262