flowchart LR
  A["One overall pace<br/>per student"] ~~~ B["One pace<br/>per subtest"] ~~~ C["Overall pace<br/>+ subtest residual"]
Accuracy-speed modelling
1. Intro
This report walks through how the joint accuracy + response-time (RT) models for Foundation and Year 1 were built, what each iteration tried, and how each variant performs against the gates we use to decide whether a model is fit for purpose. It is written for the internal IRT/data team and uses plain language to support review and decisions.
Glossary
| Term | Plain meaning | Internal label |
|---|---|---|
| Achievement score | how well a student is doing on the math items | theta |
| Response pace | how quickly a student is responding, relative to typical | tau |
| Rapid response | unusually fast for that specific item | per-item/subtest p05 flag |
| Subtest type | the type of task, e.g. number line or magnitude comparison | test_subgroup |
| Benchmark accuracy-only model | broad achievement with subtest/testlet effects, no RT | A2 |
Headline summary
Two model designs are currently candidates: the per-subtest/item rapid-threshold joint model (J2b) and the expanded selected-subtest joint model (J3a conservative).
- Foundation: passes the current diagnostics/stability checks at both 500/500 and 1000/1000 MCMC settings; broader external and movement checks are still being filled in.
- Year 1 J2b: passes diagnostics/stability checks after a source correction (addition multi-choice + subtraction multi-choice + missing number).
- Year 1 J3a conservative: 1000/1000 cisbox run complete and passes basic diagnostics/stability against corrected J2b.
- J3a moderate (adds Magnitude Comparison RT): Foundation cisbox run complete and clean diagnostically, but it moves theta substantially vs conservative; keep exploratory. Year 1 moderate exploratory run is still in progress.
- J3b hierarchical response pace: Foundation 100/100 smoke complete; promising, but needs longer-run diagnostics.
- T2 speed-only counterparts: Foundation 100/100 smokes complete for separate tau, hierarchical tau, and tau + task timing.
- J3a broad (adds true ASDD modality): smoke-tested only; held as a sensitivity / stress-test.
Current preferred internal candidate: Foundation J3a conservative; Year 1 J3a conservative now passes the completed 1000/1000 basic gate against corrected J2b. Achievement and response pace remain separate constructs: slower correct responses do not reduce achievement estimates.
Several validation gates remain open and are tracked in the scorecard in §12.
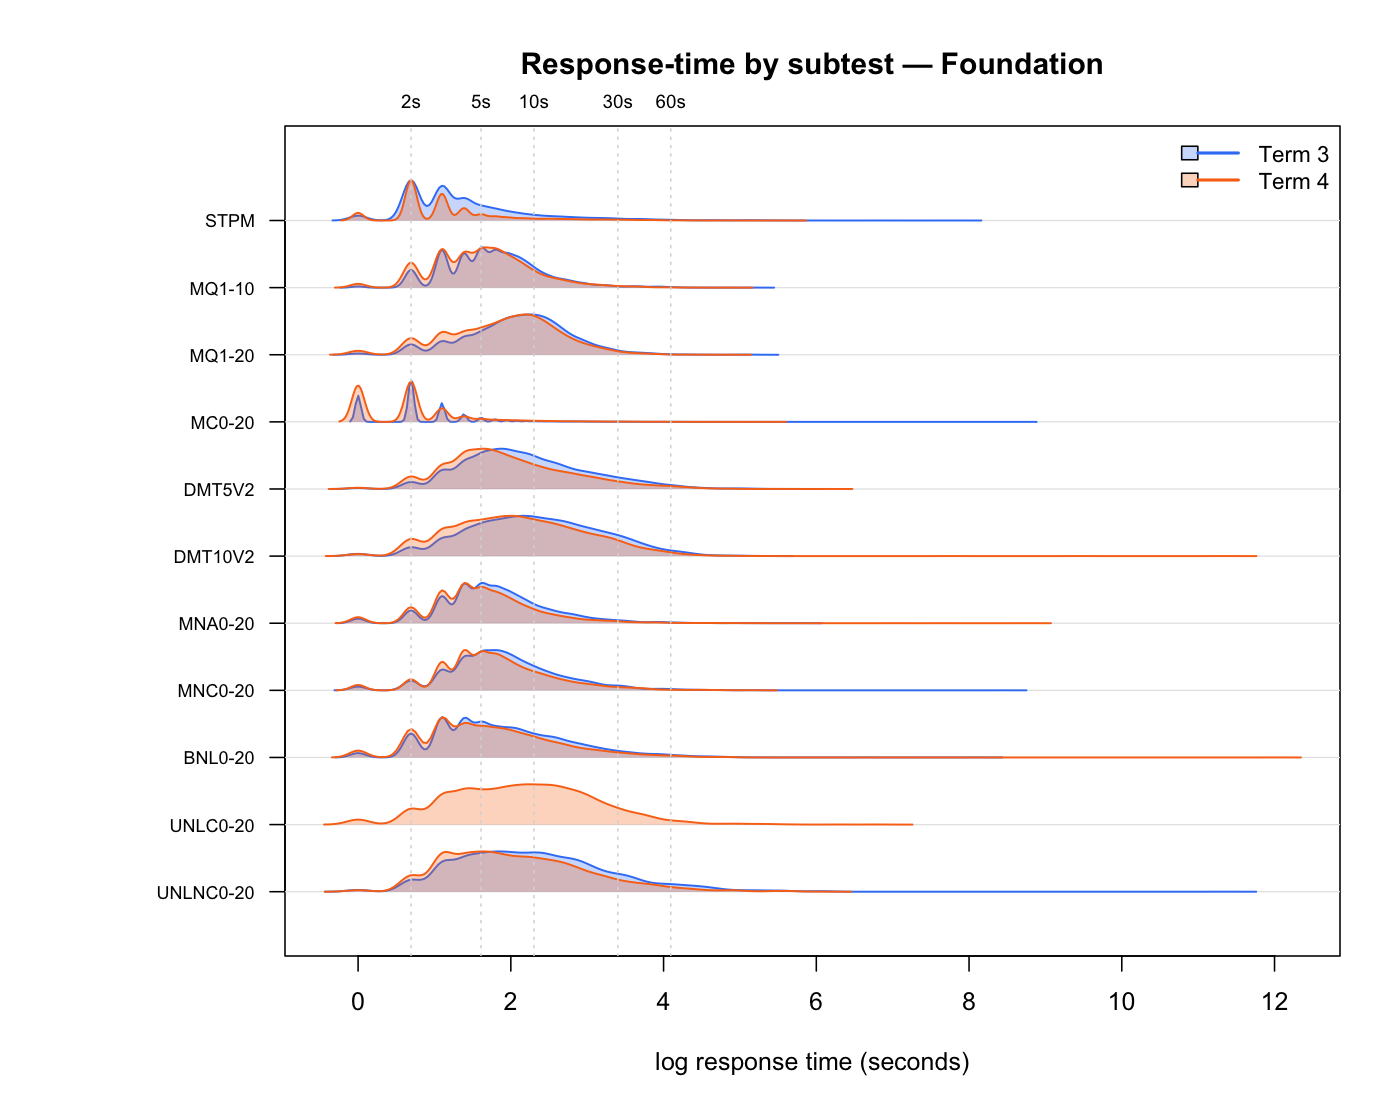
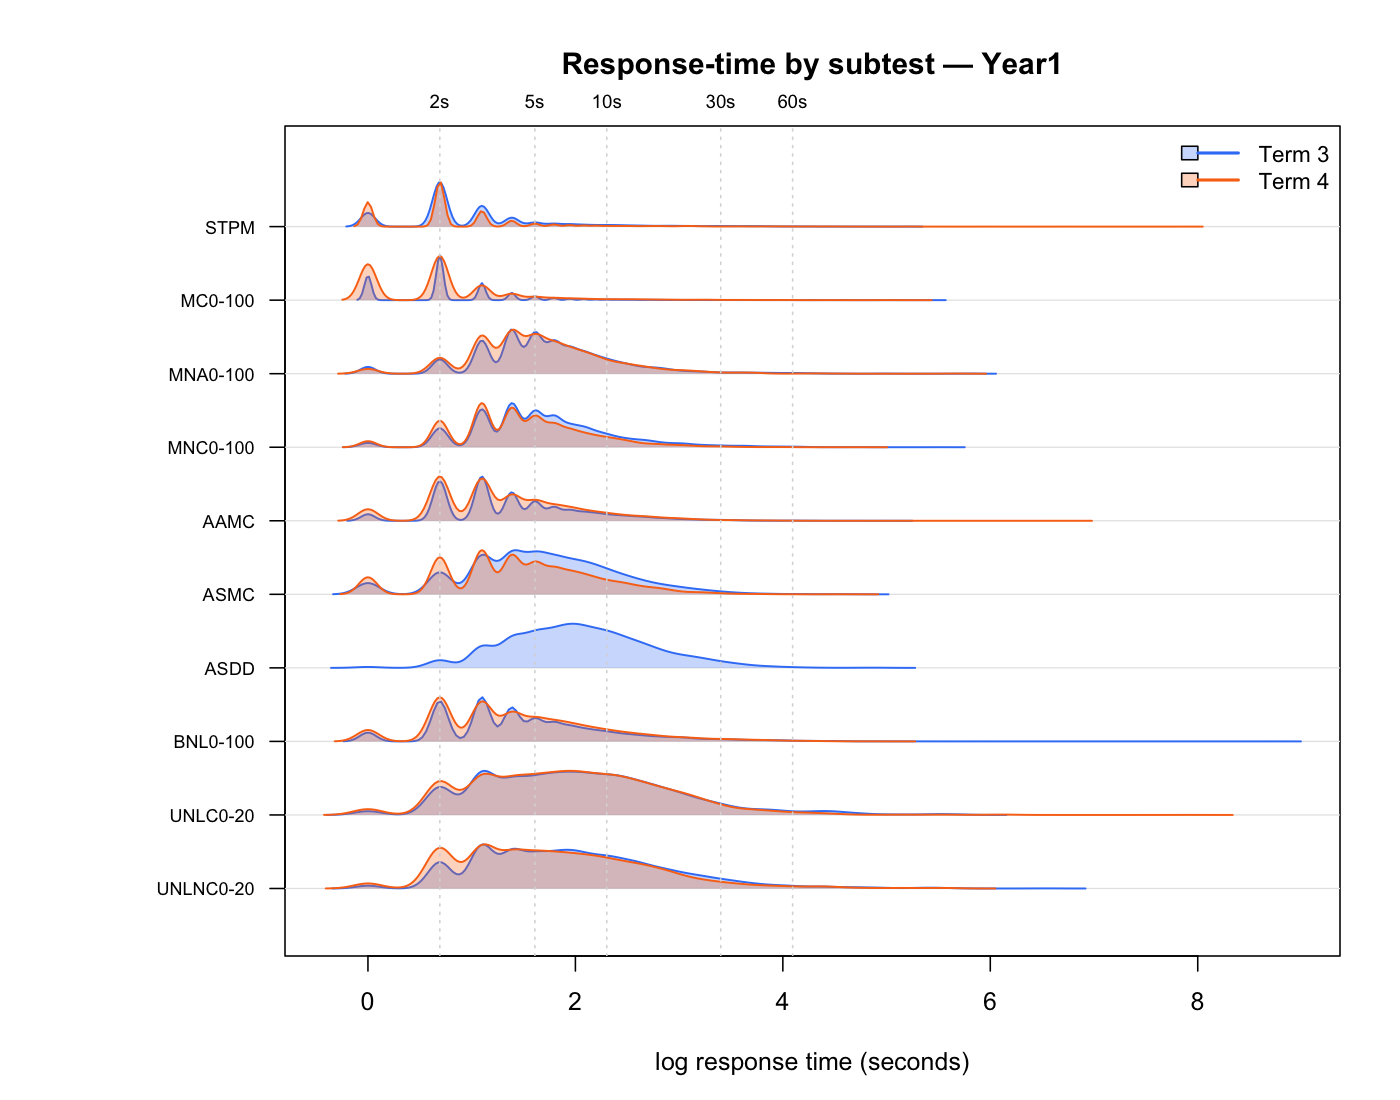
2. Distribution of response time
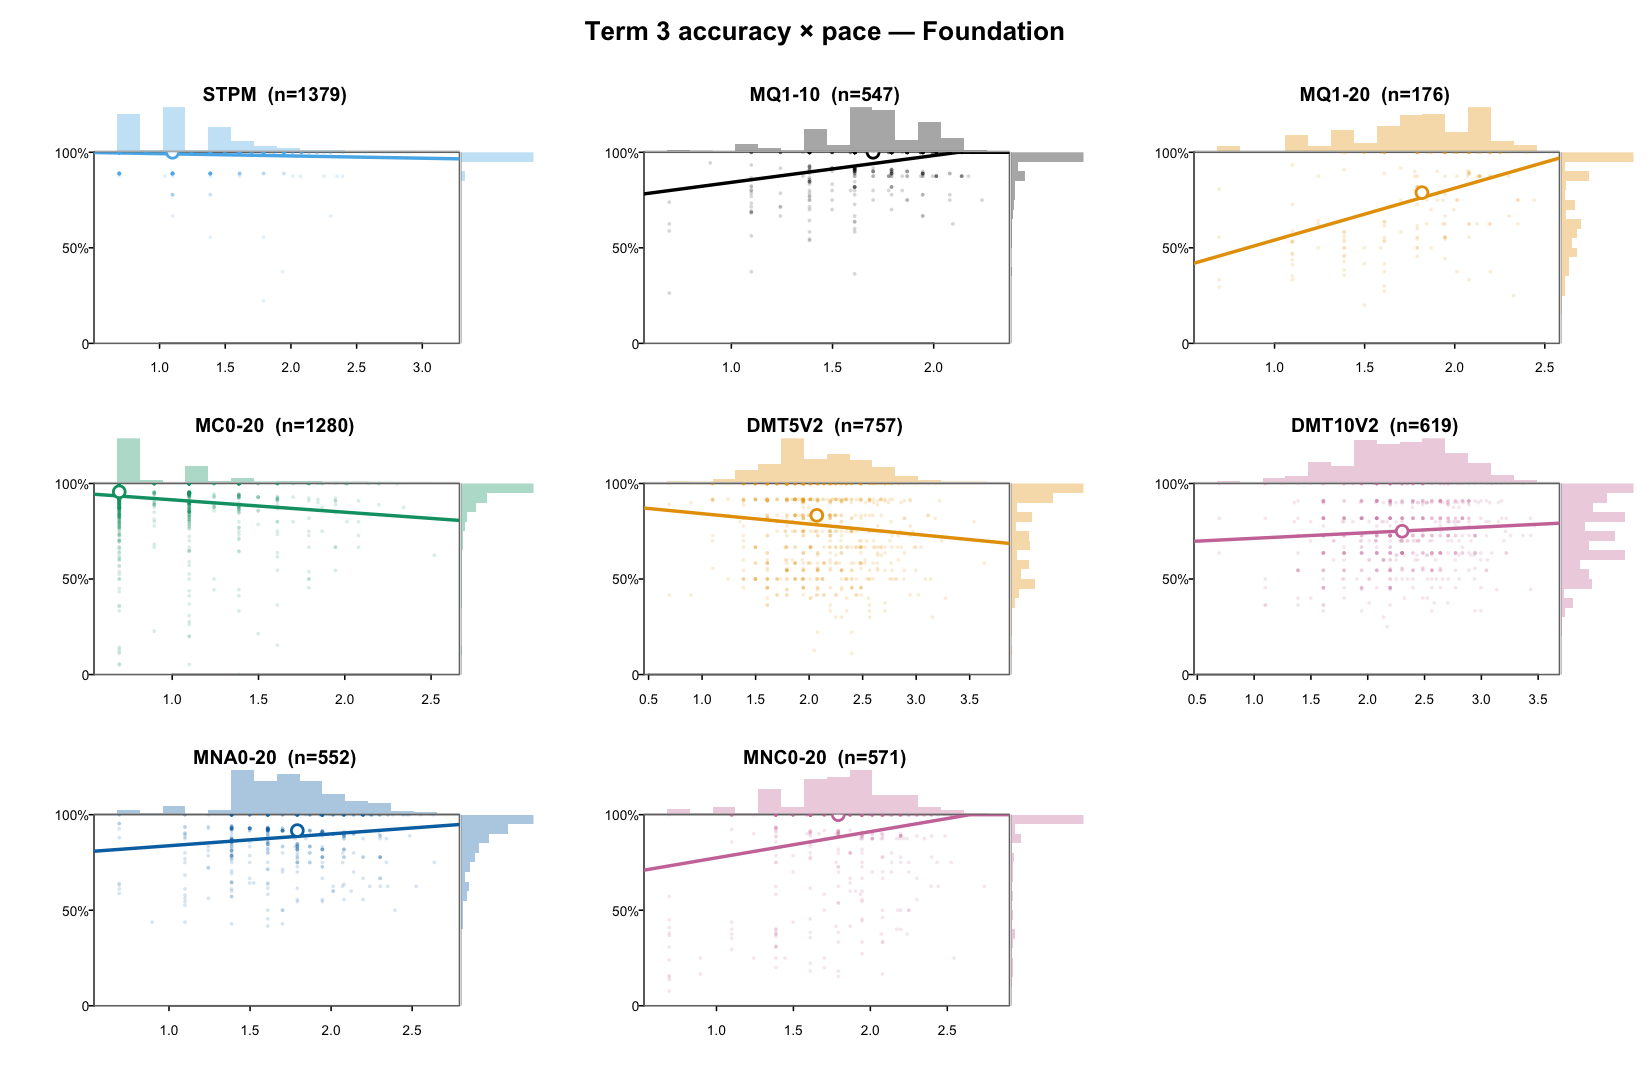
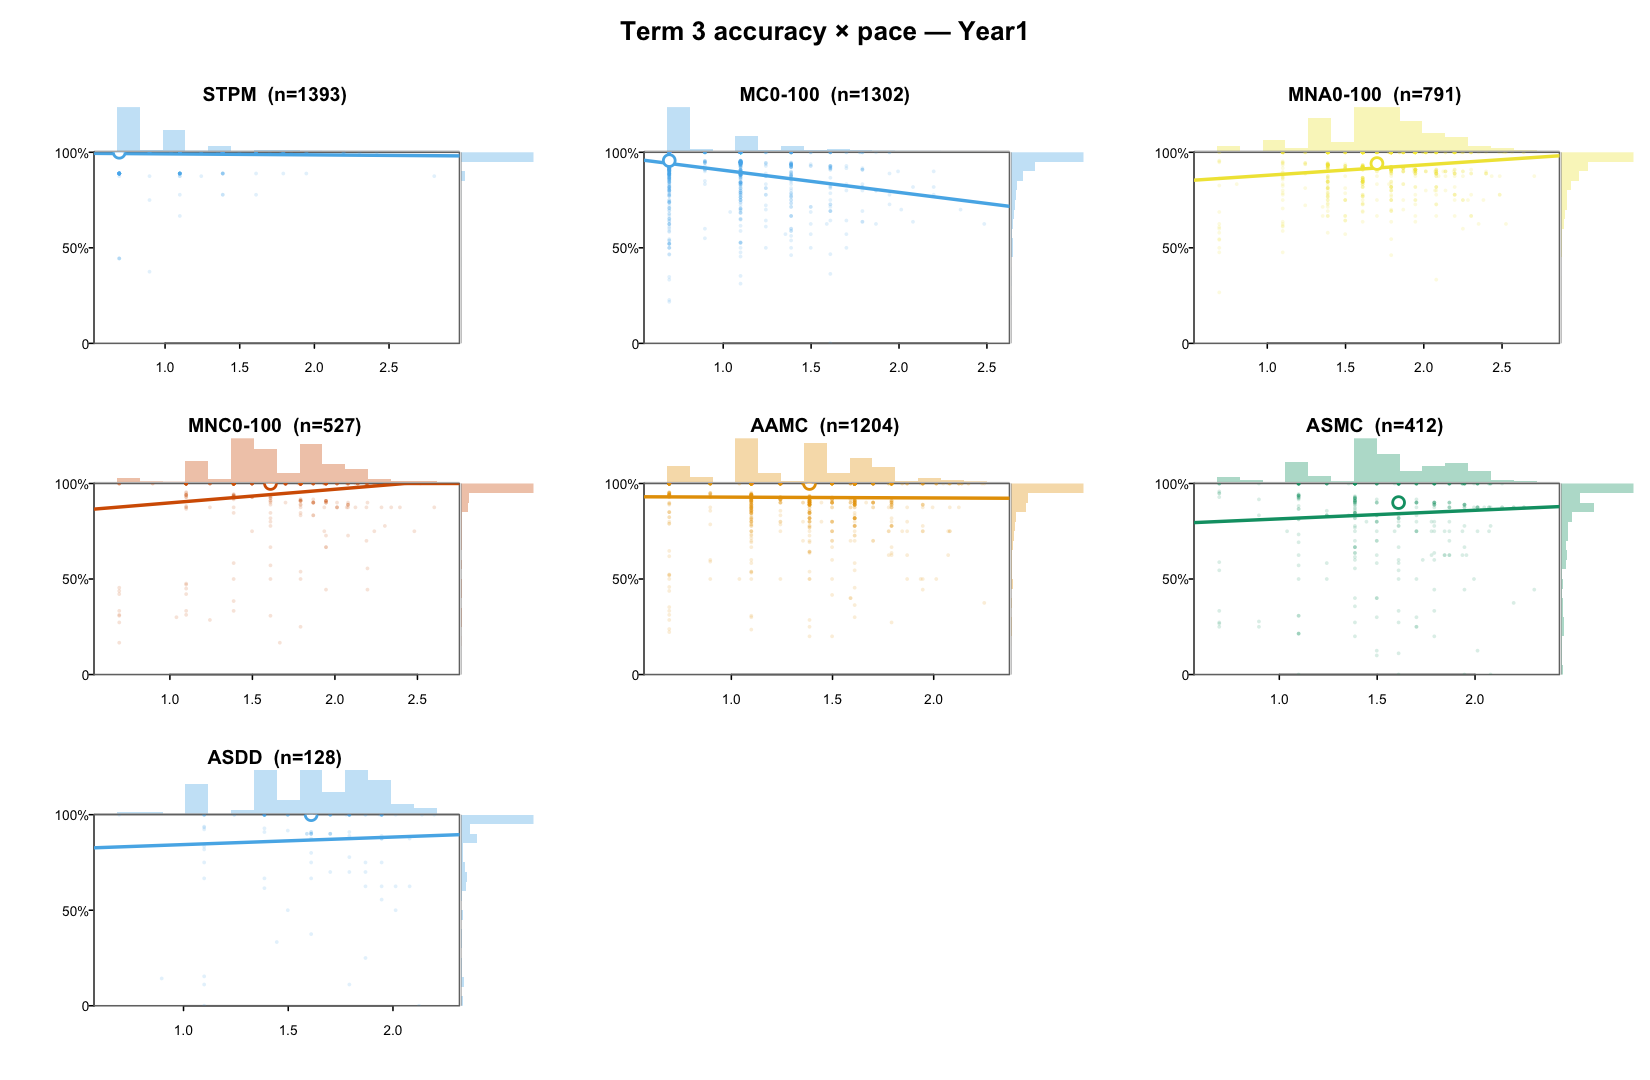
Before any modelling, look at the raw response-time evidence. The first plot shows RT distributions; the second shows accuracy against median RT.
3. Response-time modelling
Before combining response time with accuracy, what structure does response pace appear to have on its own?
This section supersedes the earlier response-time modelling notes in the IRT development page group. It focuses on a fast, auditable Term 3 speed-only comparison. Achievement estimates remain separate: these response-pace models do not change the current achievement anchor or achievement bands.
Three plausible shapes for response pace are being compared:
3.1 Scope and data
The main construct is Term 3 timed-math response pace. ABR rows, practice rows, invalid/non-scorable rows, and non-positive response times are excluded. STPM/STDD are not pooled into the main timed-math construct; they are reserved for separate platform/interface response-pace context checks.
| Analysis set | Included | Excluded | Why |
|---|---|---|---|
| Main timed-math set | time-limited math subtests | STPM/STDD, untimed tasks, ABR, invalid/non-positive RT | tests timed-math response pace |
| Non-math context set | STPM; STDD separately where available | math tasks | checks general interaction-speed context |
| Foundation linking sensitivity | F-A only, F-B only, MC0-20 only, family hierarchy | — | checks thin Foundation A/B linking |
The report below focuses on interpretable modelling evidence. The main timed-math comparisons are shown for both Foundation and Year 1. STPM/STDD remain planned context checks after the one-subtest context specification is patched.
3.2 Subtest coverage and linking
| Year | Cohort | Included timed-math subtests | Shared A/B link |
|---|---|---|---|
| Foundation | F-A | MQ1-10, MC0-20, MNC0-20 | MC0-20 |
| Foundation | F-B | MQ1-20, MC0-20, MNA0-20 | MC0-20 |
| Year 1 | Y1-A | AAMC, ASMC, ASDD, MC0-100, MNA0-100 | AAMC, ASMC, ASDD, MC0-100 |
| Year 1 | Y1-B | AAMC, ASMC, ASDD, MC0-100, MNC0-100 | AAMC, ASMC, ASDD, MC0-100 |
Year 1 is strongly linked across A/B cohorts. Foundation is more thinly linked: MC0-20 is the only shared timed-math subtest, so Foundation pooled results need explicit form-split sensitivity checks.
3.3 Models fitted
| Plain-English model | Statistical idea | Question answered |
|---|---|---|
| Overall timed-math pace | one student pace effect | Is one pace factor enough? |
| Separate subtest pace | student pace within each subtest | Do subtests need distinct pace estimates? |
| Hierarchical pace | overall pace + subtest residual pace | Can we keep both general and subtest-specific pace? |
| Overall pace + task timing | one pace plus task/testlet timing effects | Are differences mainly task-side rather than student-side? |
| STPM / STDD context | non-math interaction-speed pace | How much is general platform/interface pace? |
| Foundation linking sensitivities | F-A only, F-B only, MC0-20 only, family hierarchy | Is Foundation A/B pooling stable? |
3.4 Pooled vs subtest-specific pace
This plot compares one overall timed-math pace estimate with subtest-specific pace estimates. Each dot is one student-administration × subtest combination.
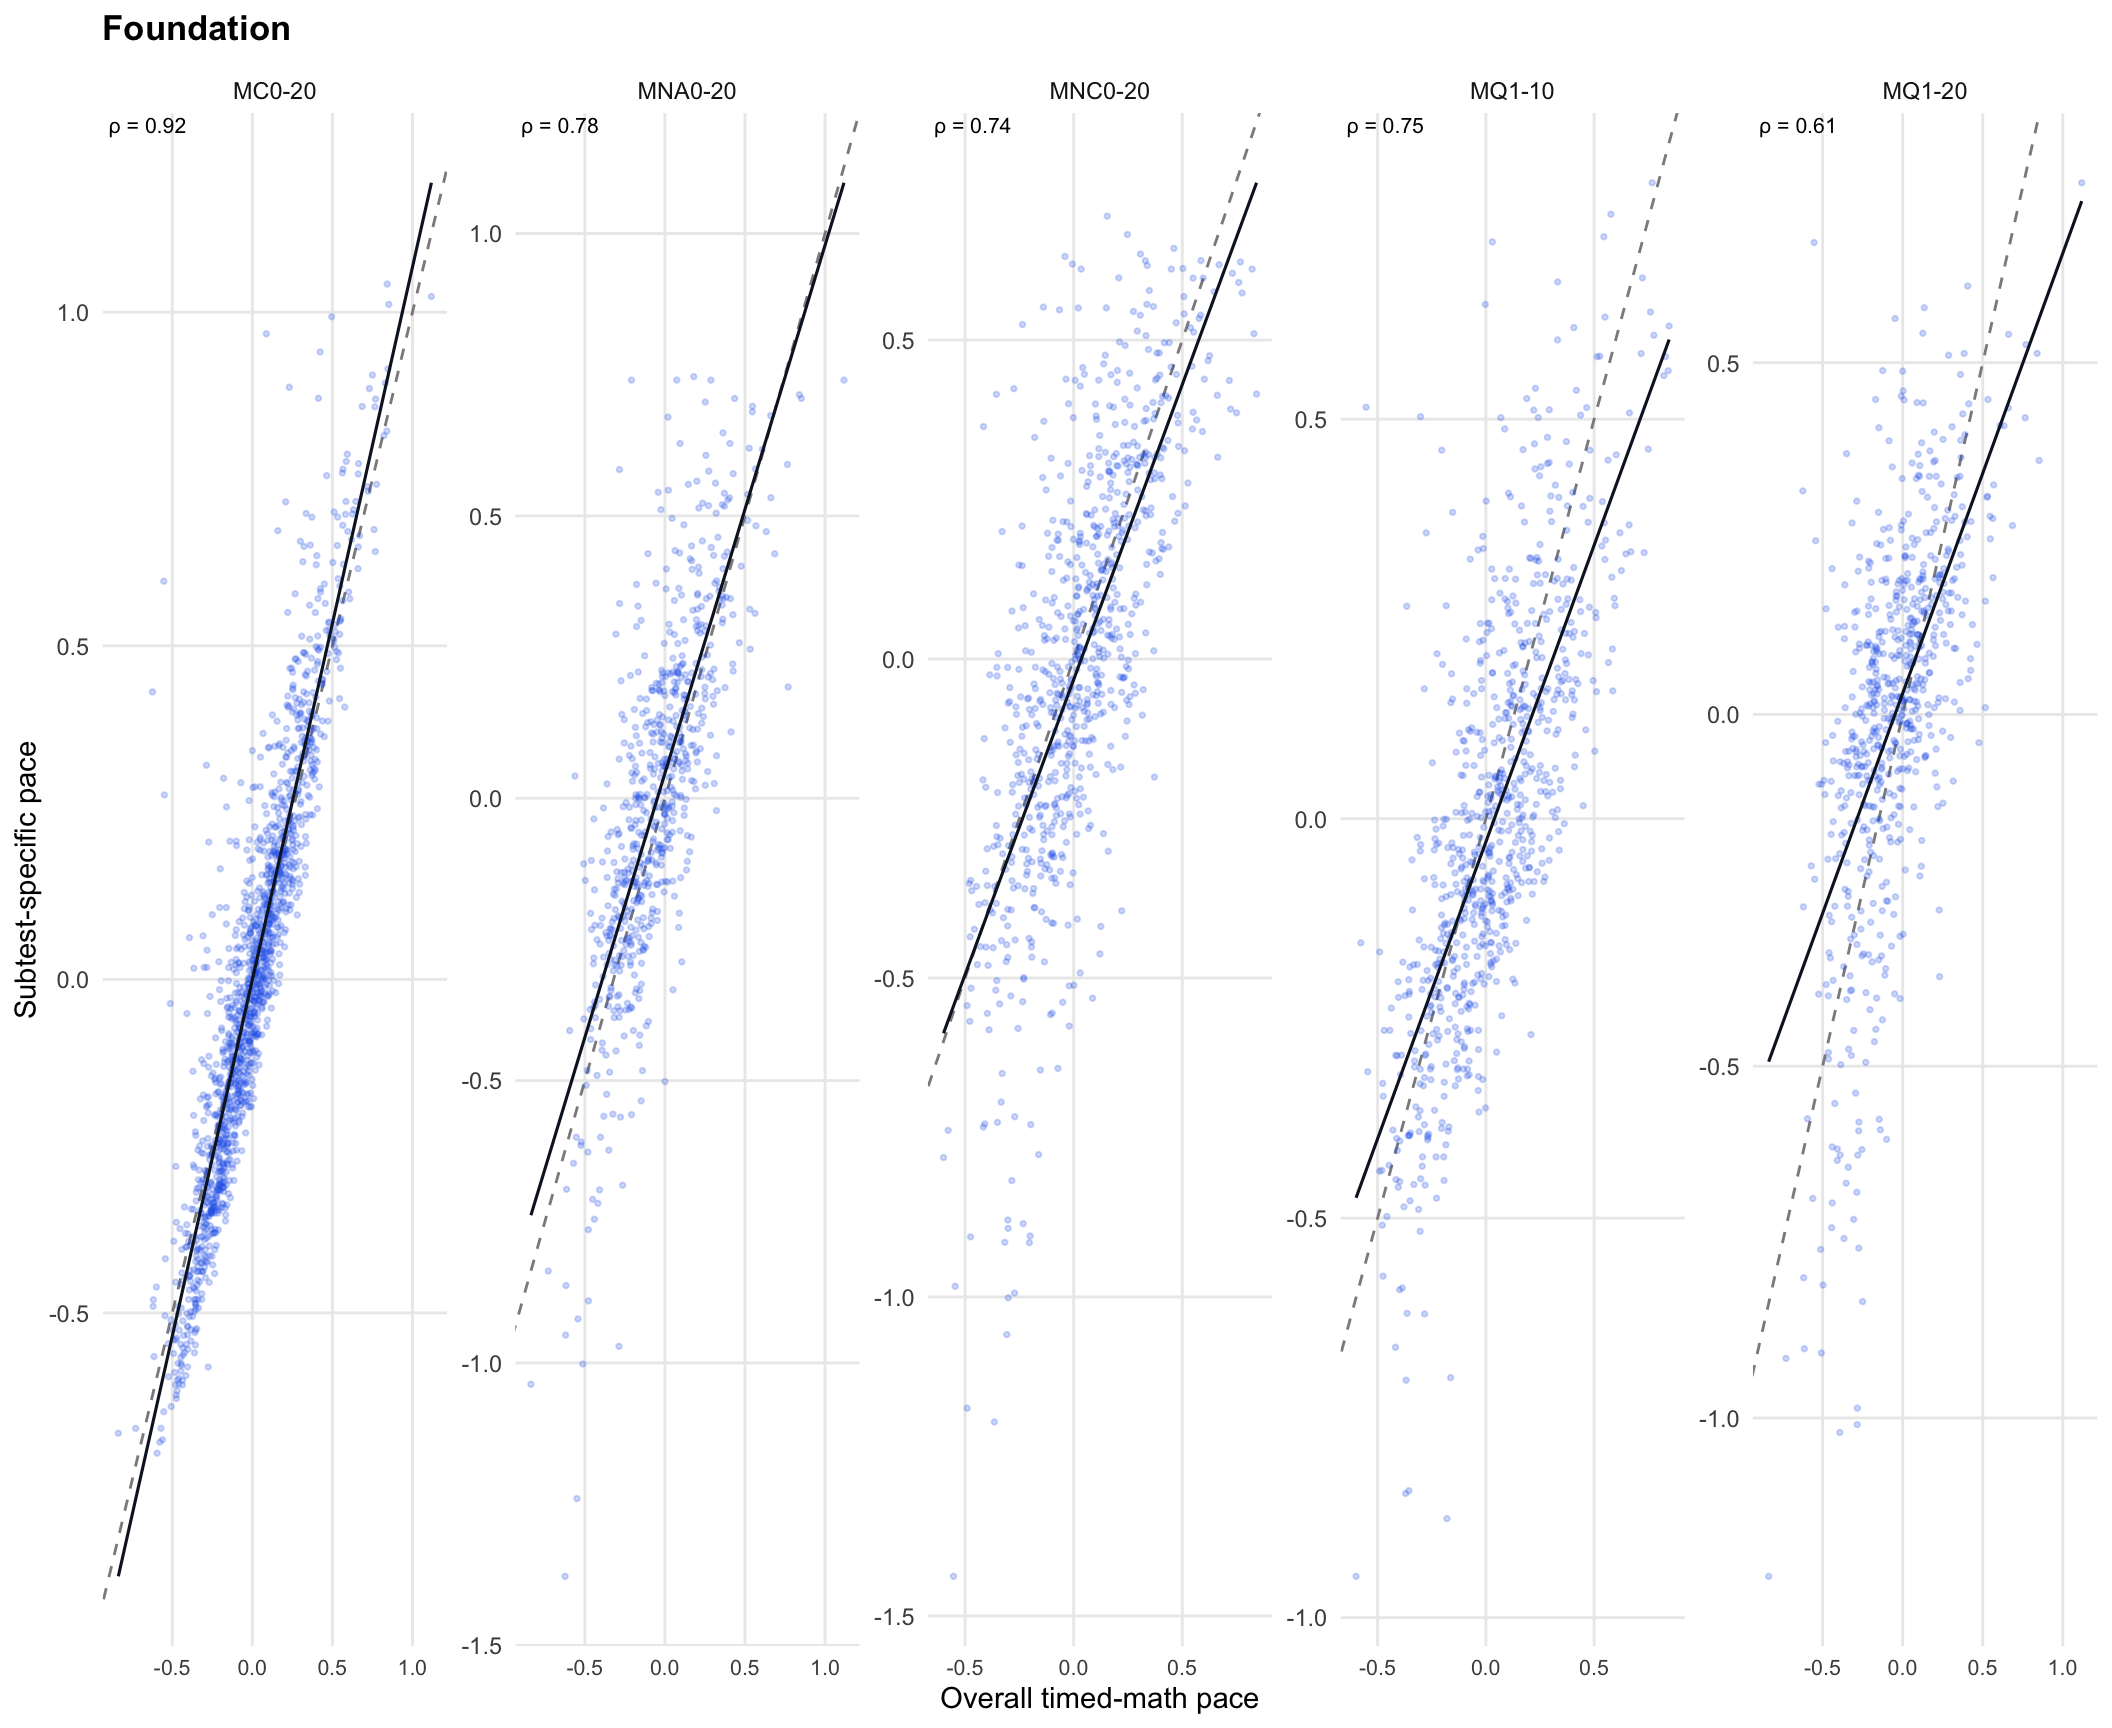
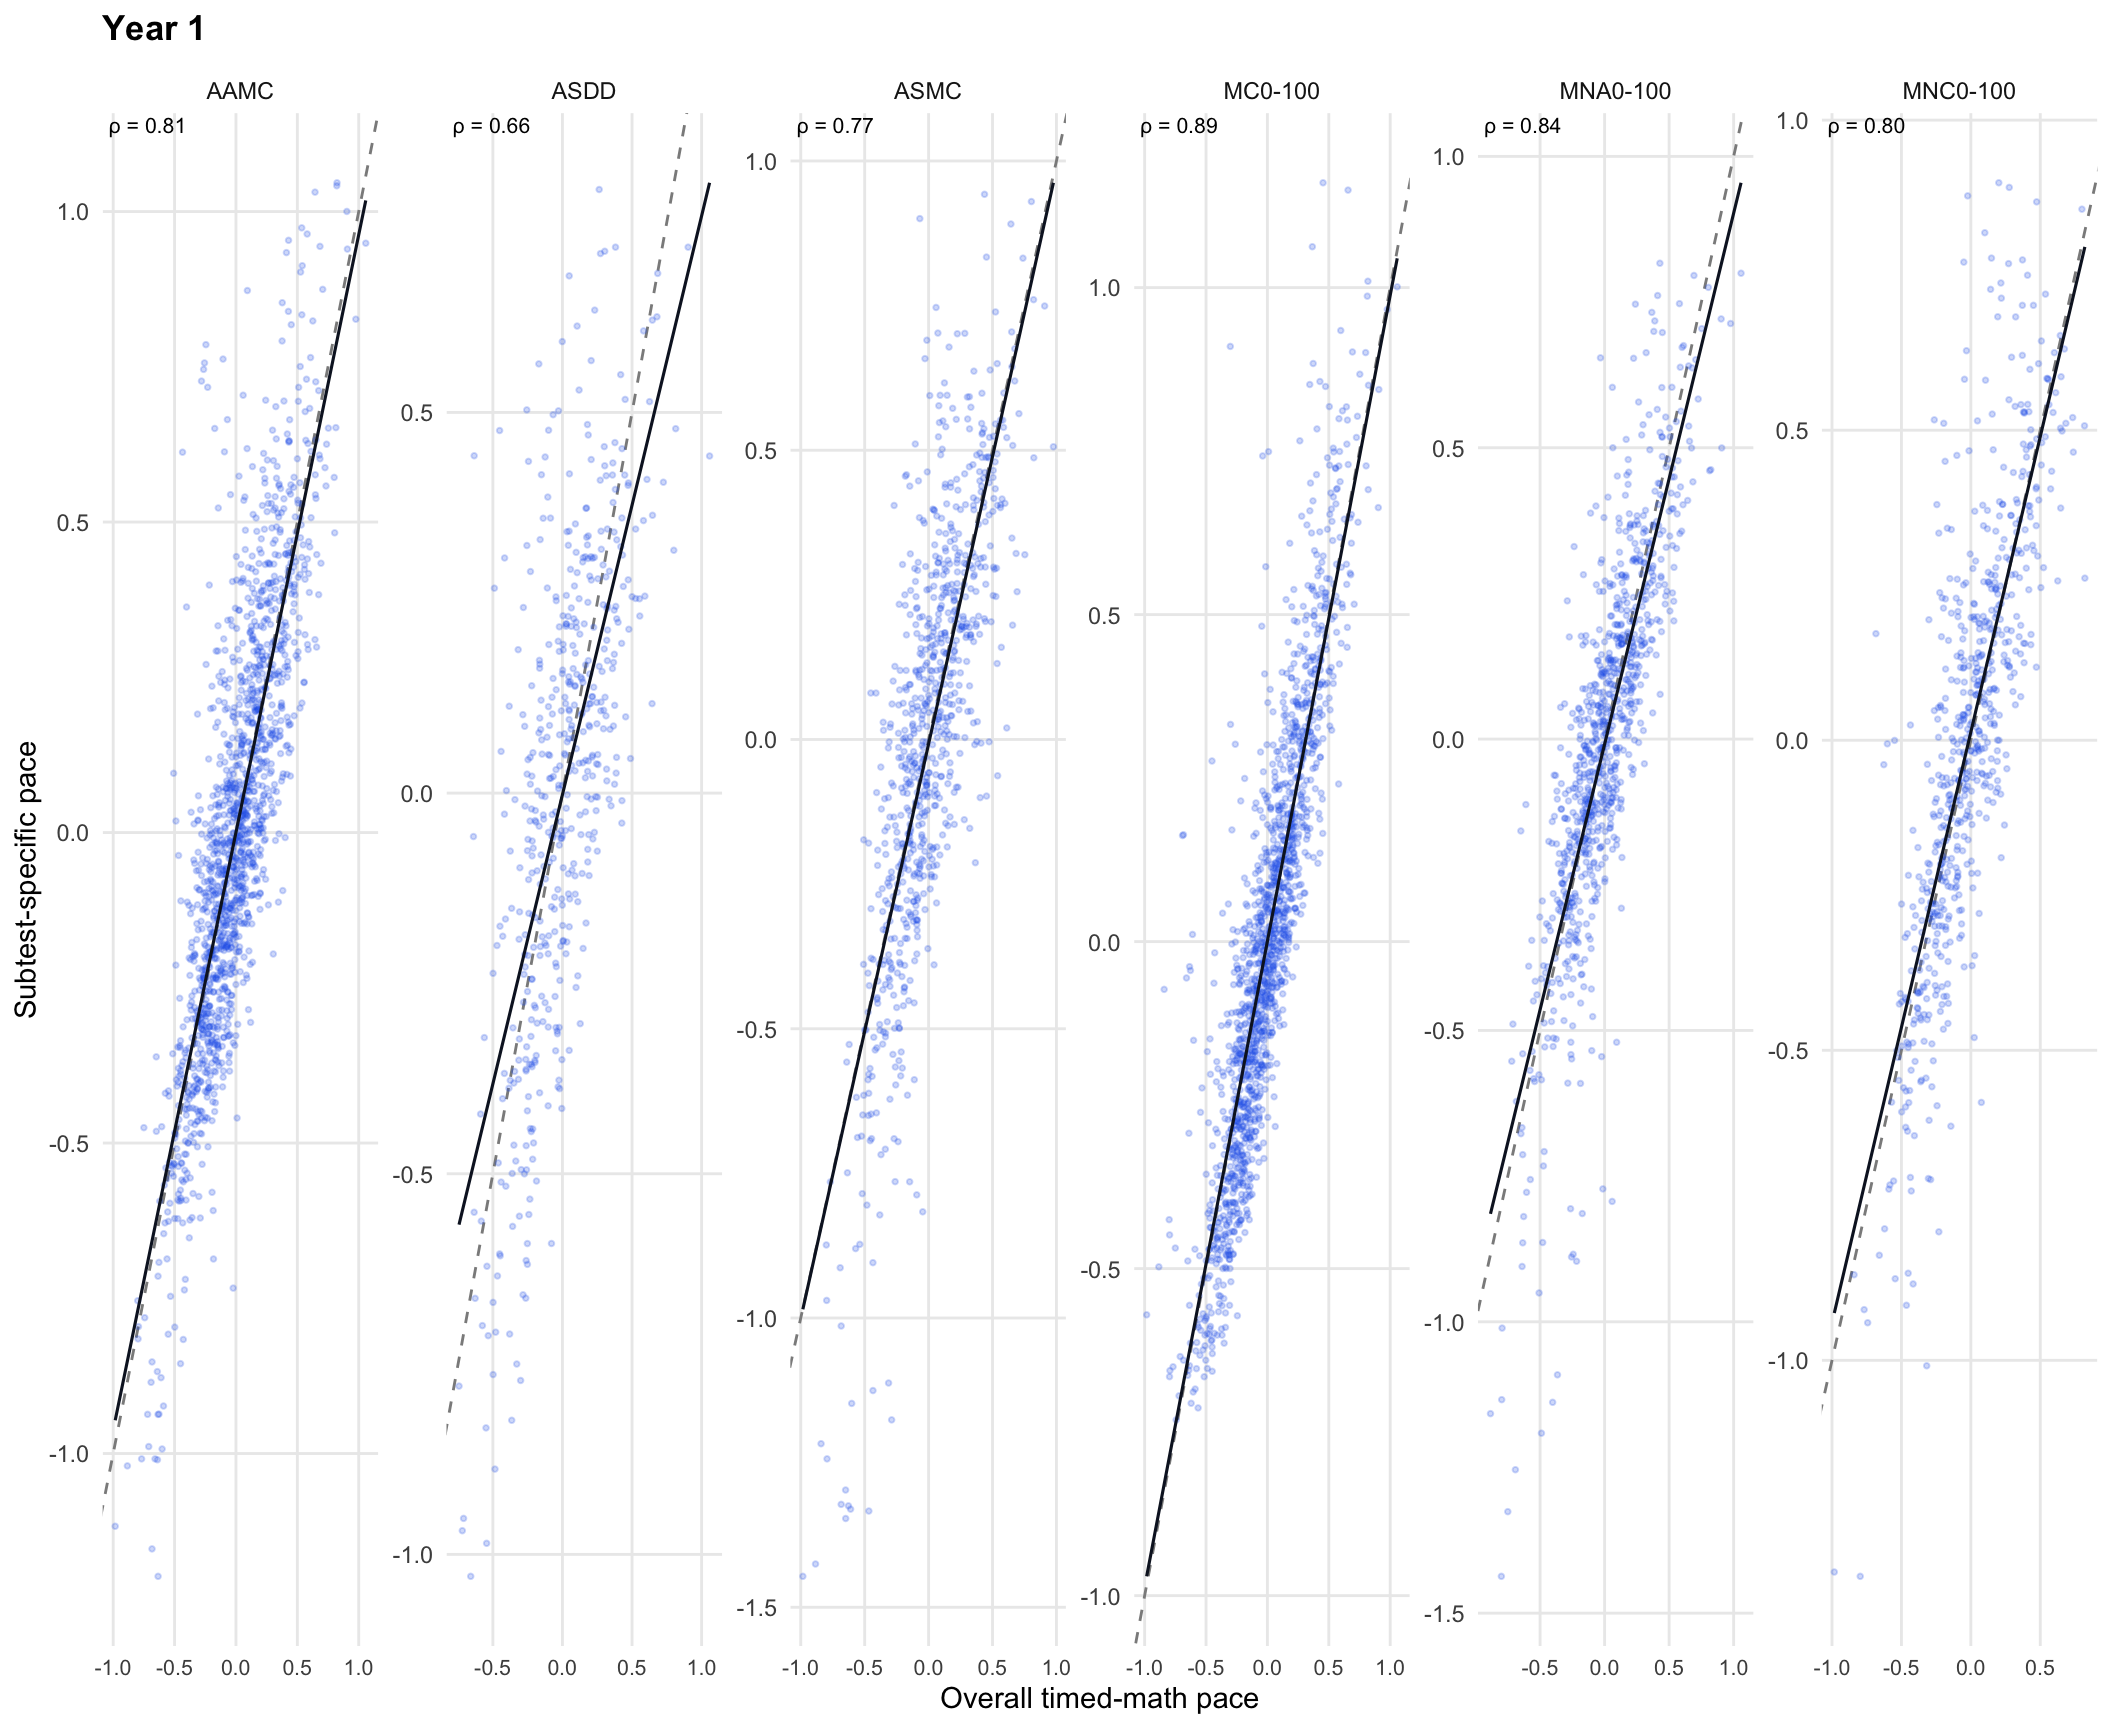
NoteHow to read this
A strong upward slope means there is a general timed-math response-pace signal. Points that do not sit on the identity line mean the subtest-specific pace estimates still carry information beyond one overall pace.
3.5 Subtest-to-subtest correlation
The heatmap below uses the subtest-specific pace estimates from the separate-subtest model. Cells show Spearman rank correlations across student-administrations.
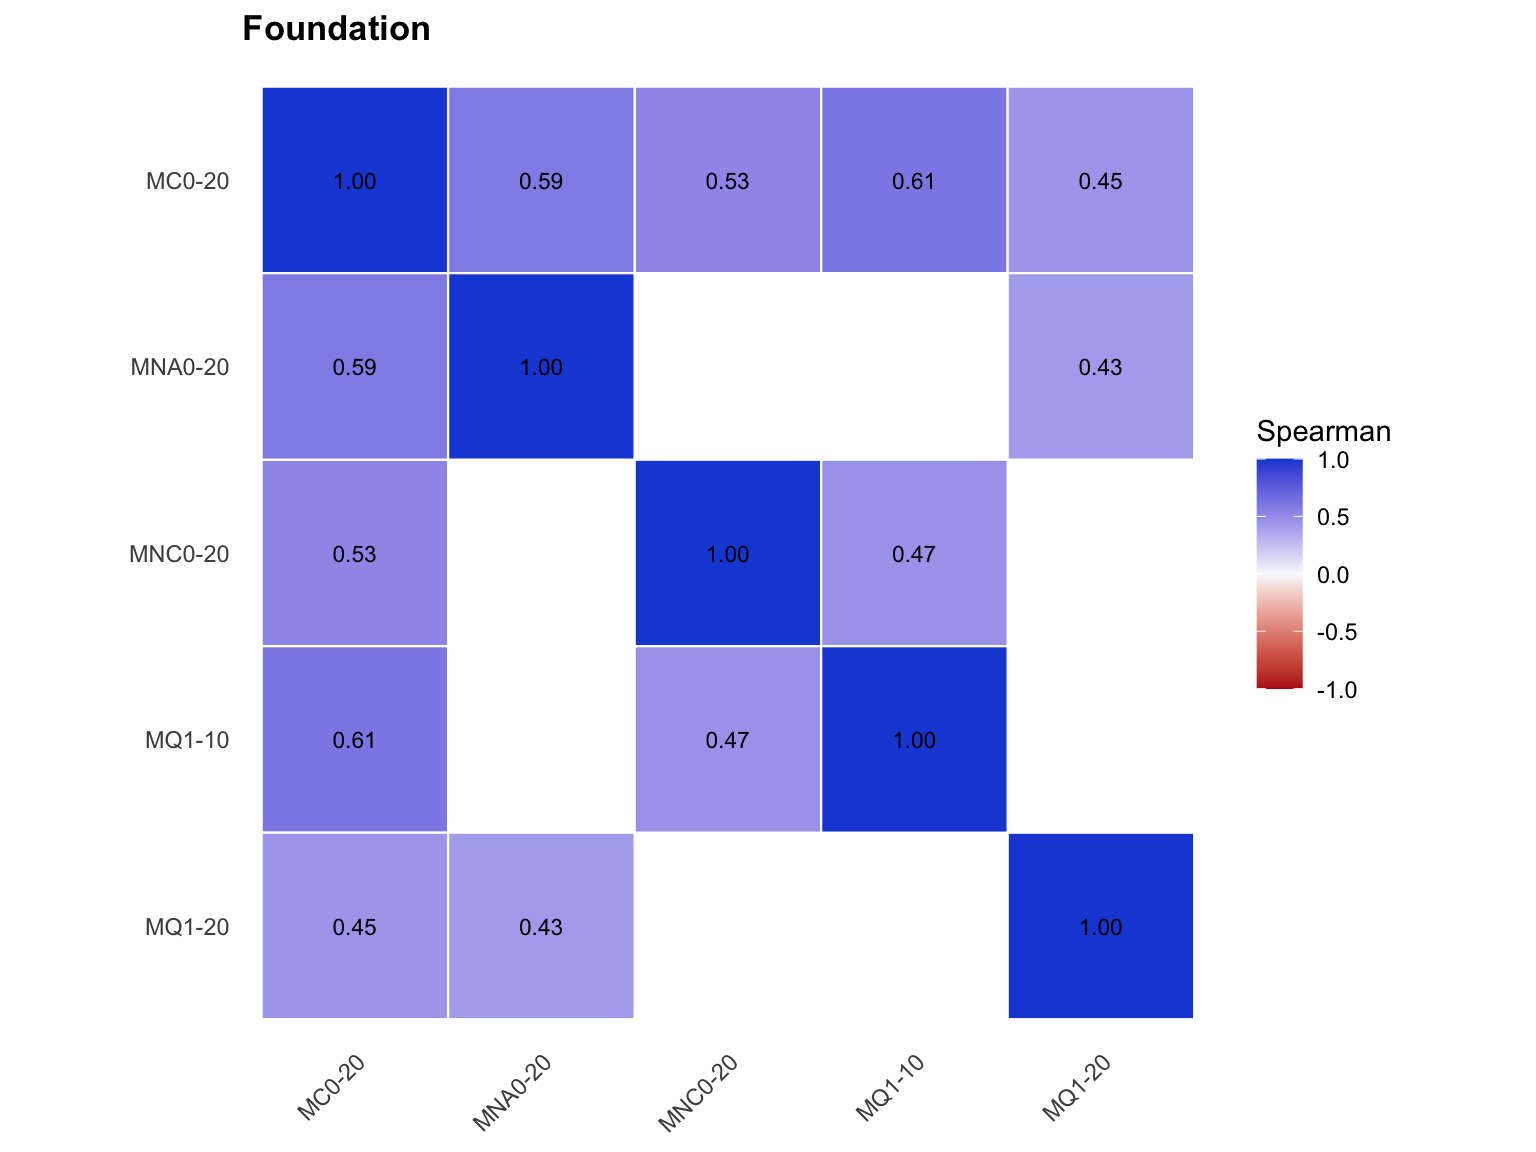
The Foundation heatmap shows moderate positive response-pace correlations among jointly observed timed-math subtests. MC0-20 is the key cross-form link, correlating with all other Foundation timed-math subtests. Blank cells are structural: those subtest pairs were not jointly observed because of the A/B form split. This supports an overall timed-math pace factor, but with explicit Foundation linking caveats and retained subtest residuals.
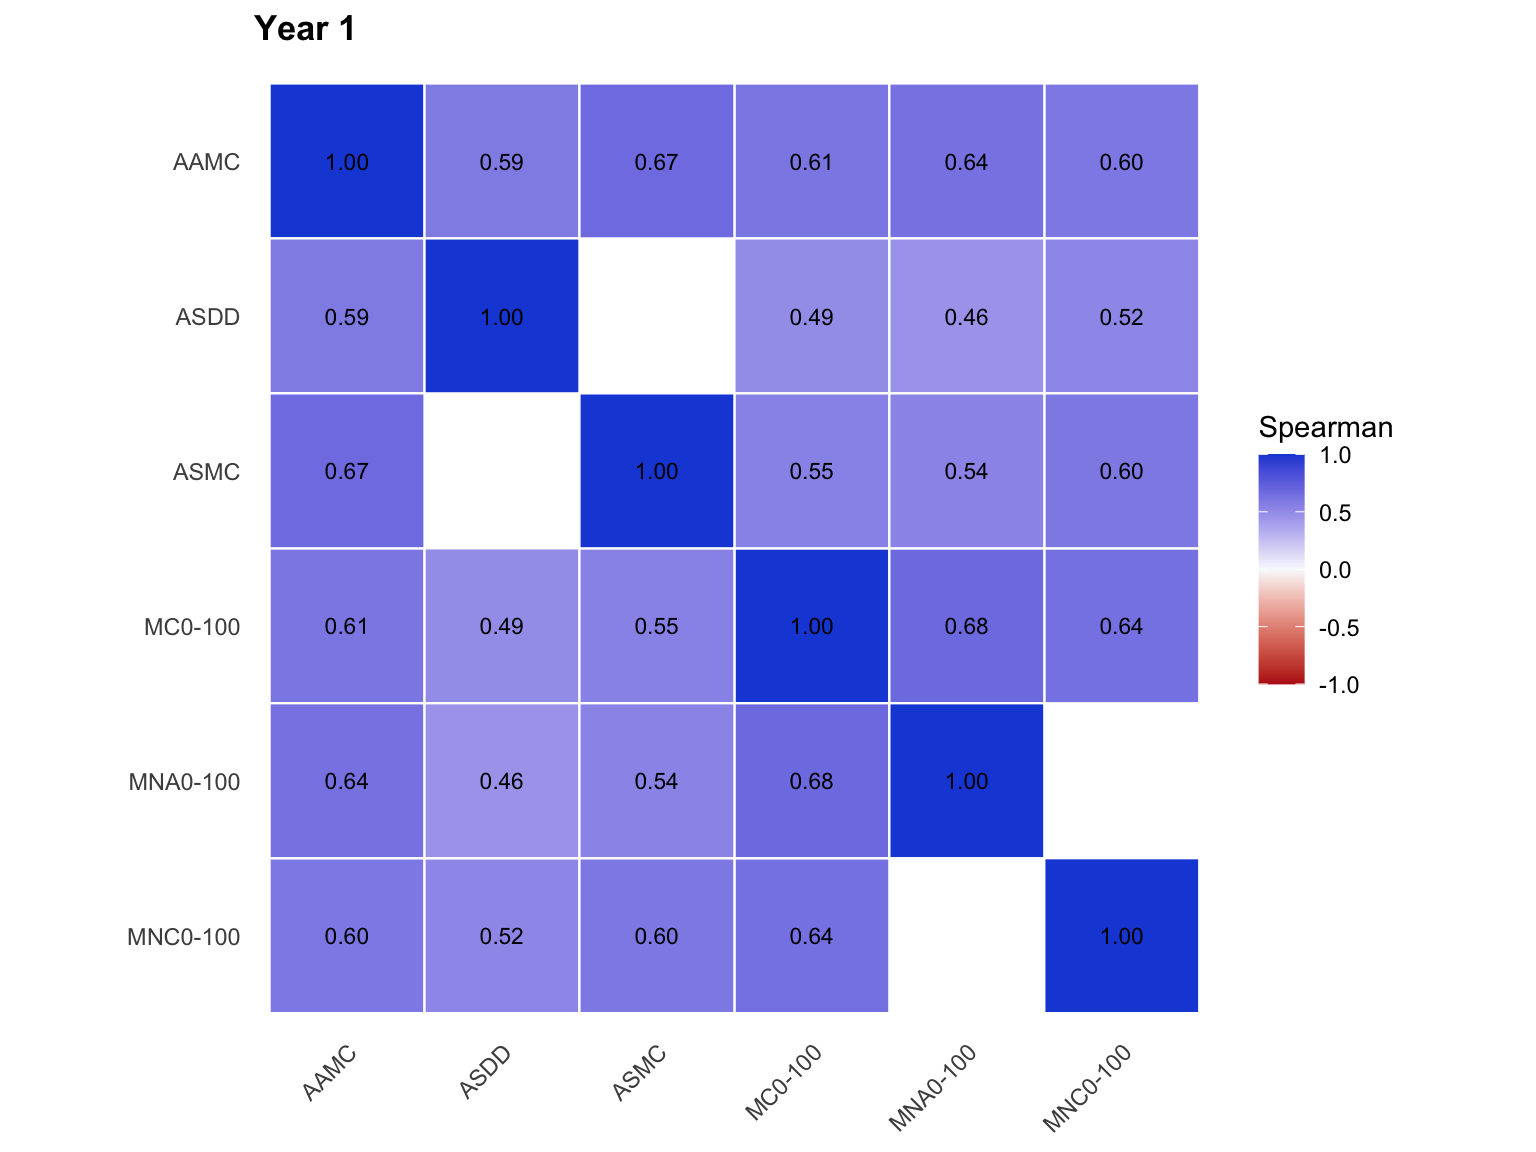
The Year 1 heatmap shows a more complete linked structure across the timed-math subtests. Most correlations are moderate and positive, so Year 1 has clearer evidence for a shared timed-math pace factor than Foundation. The correlations are still well below 1.00, which means subtest-specific pace differences remain meaningful; this supports the hierarchical structure rather than a single pooled pace alone.
NoteHow to read this
Higher correlations support a general timed-math pace factor. Variation across cells supports keeping subtest residuals rather than forcing all response pace into one undifferentiated estimate.
3.6 Hierarchical residual size
The hierarchical model separates response pace into an overall student component and subtest residual components. The chart compares their standard deviations.
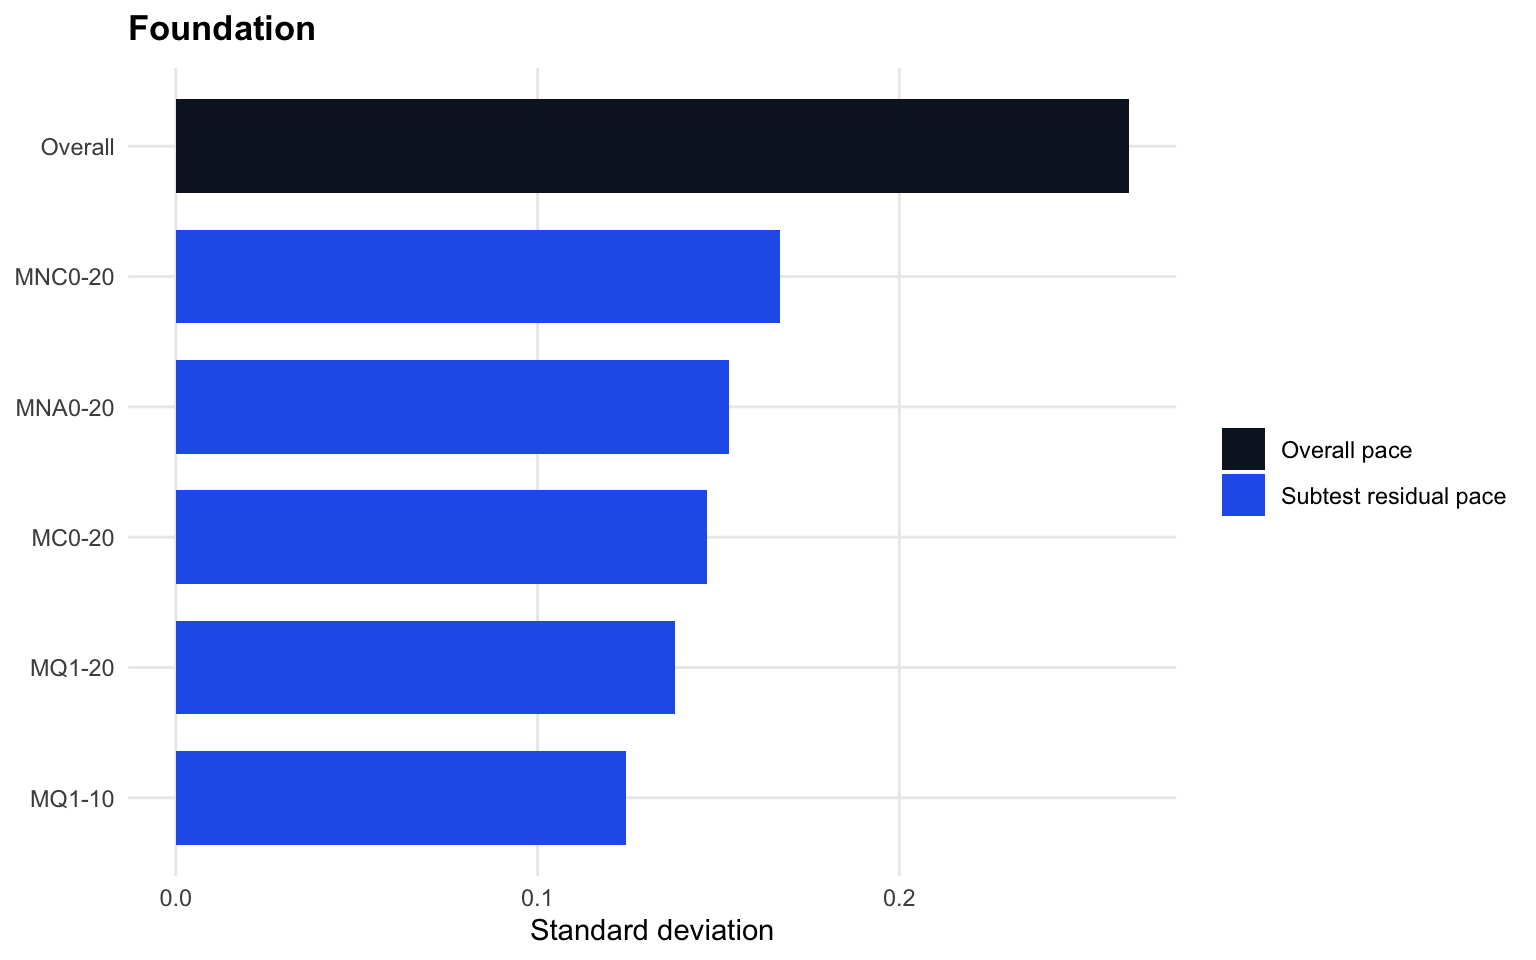
The Foundation chart shows that the overall pace component is the largest source of response-pace variation, but each subtest also retains non-trivial residual pace variation. This means Foundation response time is not fully captured by one overall pace estimate. The modelling implication is an overall timed-math pace plus subtest residuals, with the Foundation linking caveat retained.
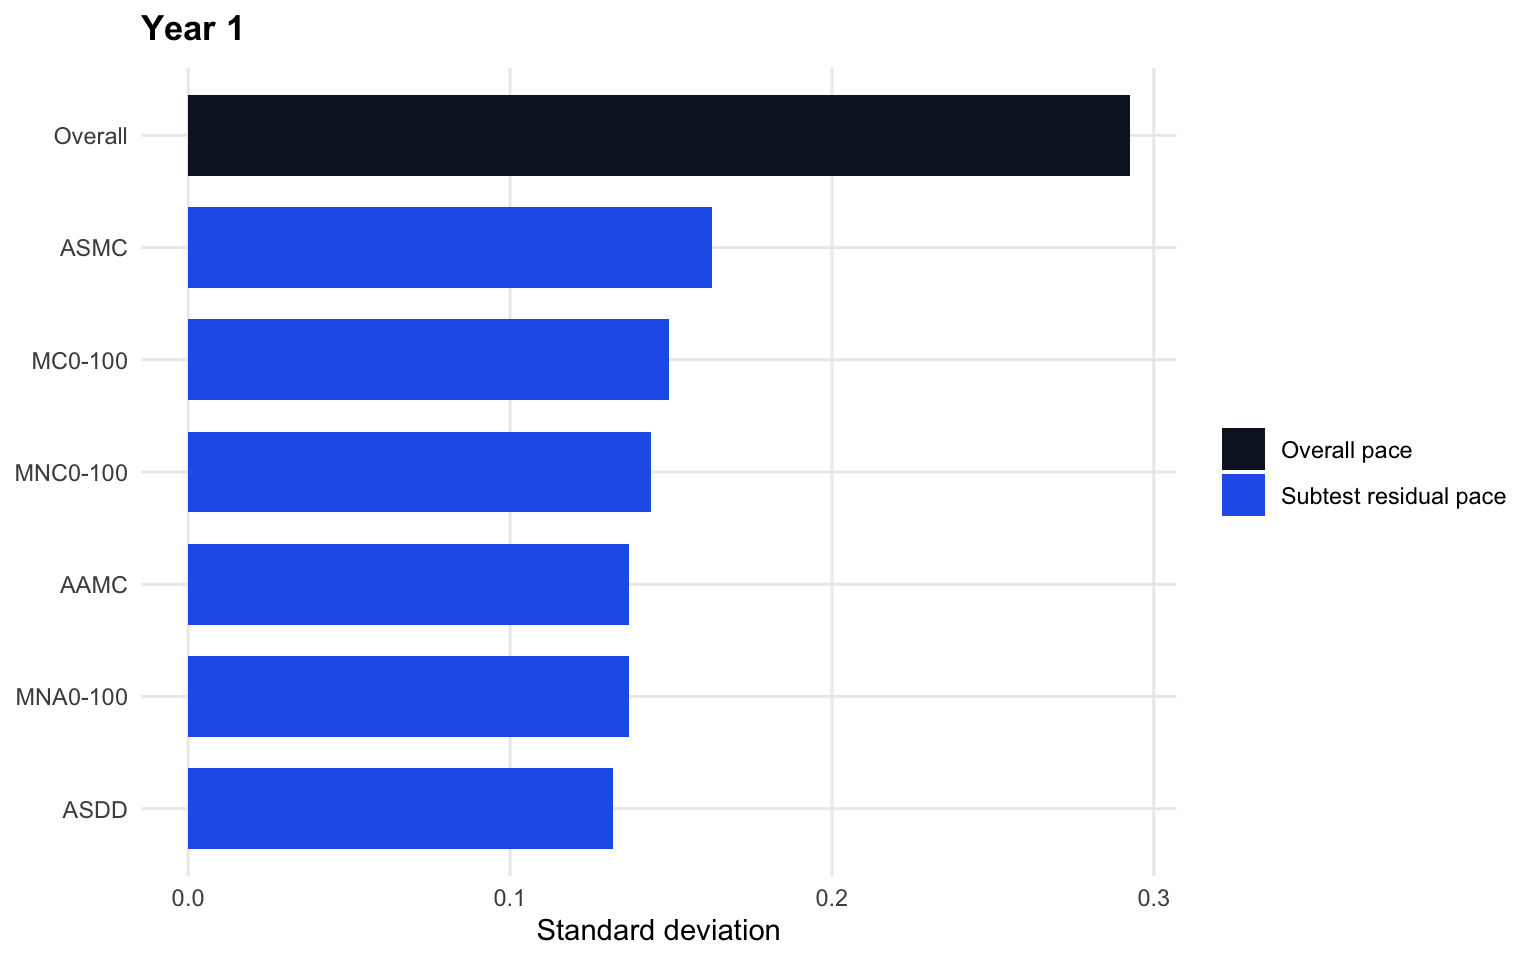
The Year 1 chart shows the same broad pattern: overall pace is a major component, but subtest residual pace remains visible across the timed-math subtests. Because Year 1 has stronger A/B linking, this gives cleaner support for the hierarchical response-pace structure than Foundation: one overall pace estimate plus retained subtest-specific residual pace.
NoteHow to read this
If residual standard deviations are non-trivial, subtest-specific pace is adding information beyond overall pace.
3.7 Pooled vs hierarchical vs task-timing comparison
This table summarises the key model-pair comparisons. For separate-subtest pace, the pooled comparison uses the student’s average separate-subtest pace; the hierarchical comparison uses person × subtest estimates.
| Year | Model pair | Spearman | median |diff| | Read |
|---|---|---|---|---|
| Foundation | pooled vs separate-subtest mean | 0.964 | 0.047 | how close one overall pace is to separate-subtest pace |
| Foundation | hierarchical subtest pace vs separate subtest pace | 0.981 | 0.027 | does hierarchy preserve subtest signal |
| Foundation | pooled vs hierarchical overall pace | 0.980 | 0.040 | does hierarchy change overall pace |
| Foundation | task-timing vs hierarchical overall pace | 0.972 | 0.042 | can task timing replace subtest student pace |
| Year 1 | pooled vs separate-subtest mean | 0.977 | 0.036 | how close one overall pace is to separate-subtest pace |
| Year 1 | hierarchical subtest pace vs separate subtest pace | 0.983 | 0.029 | does hierarchy preserve subtest signal |
| Year 1 | pooled vs hierarchical overall pace | 0.987 | 0.027 | does hierarchy change overall pace |
| Year 1 | task-timing vs hierarchical overall pace | 0.987 | 0.027 | can task timing replace subtest student pace |
NoteHow to read this
The model structure should be the simplest one that preserves real subtest pace differences without turning subtest variation into one undifferentiated pace estimate or into pure task-side timing.
3.8 Foundation A/B linking sensitivity
Foundation needs extra scrutiny because A/B linking is thin: MC0-20 is the only shared timed-math subtest. The sensitivities compare pooled A/B Foundation pace with form-specific and link-anchor estimates.
| Sensitivity model | Compared to pooled A/B Foundation pace |
|---|---|
| F-A only pooled pace | rank agreement and shift |
| F-B only pooled pace | rank agreement and shift |
| MC0-20-only pace | link-anchor stability |
| Family-level hierarchy | structural sensitivity |
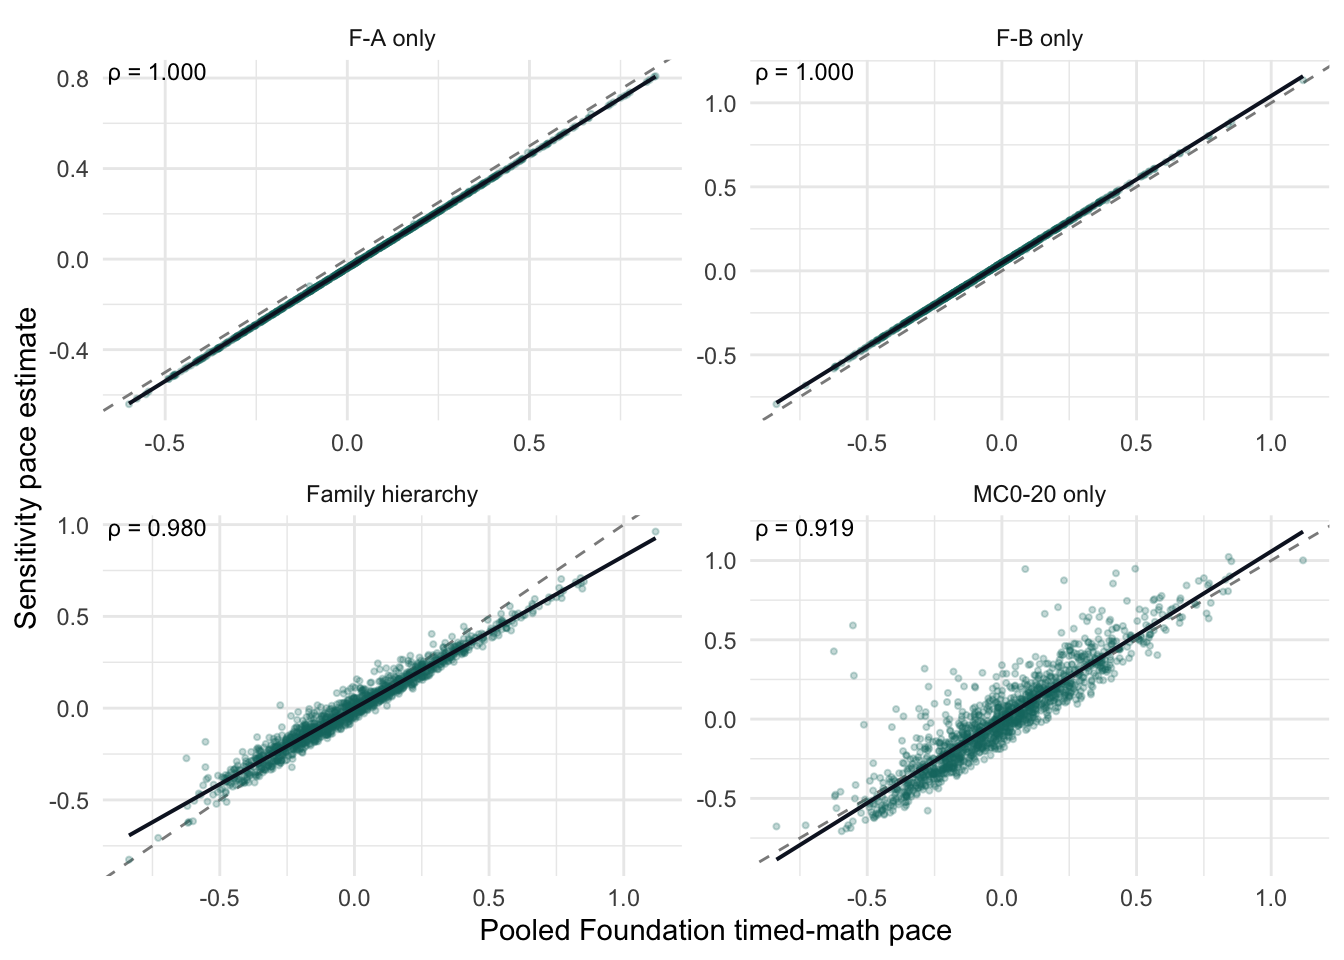
NoteSection conclusion
The Foundation sensitivity checks support pooled A/B response-pace modelling. Within each form, the form-only pace estimates produce essentially the same student ordering as the pooled Foundation estimate, and a family-level hierarchical sensitivity also preserves the pooled ordering closely. The MC0-20-only estimate, which uses the main shared A/B anchor, remains strongly aligned with the full timed-math pace estimate but is less identical, as expected for a single-subtest construct. Overall, Foundation pooled pace is stable enough for internal modelling evidence, while retaining an explicit caveat that cross-form linking relies heavily on MC0-20.
3.9 STPM / STDD context
STPM/STDD are modelled as non-math interaction-speed context checks, not as part of the primary timed-math pace construct.
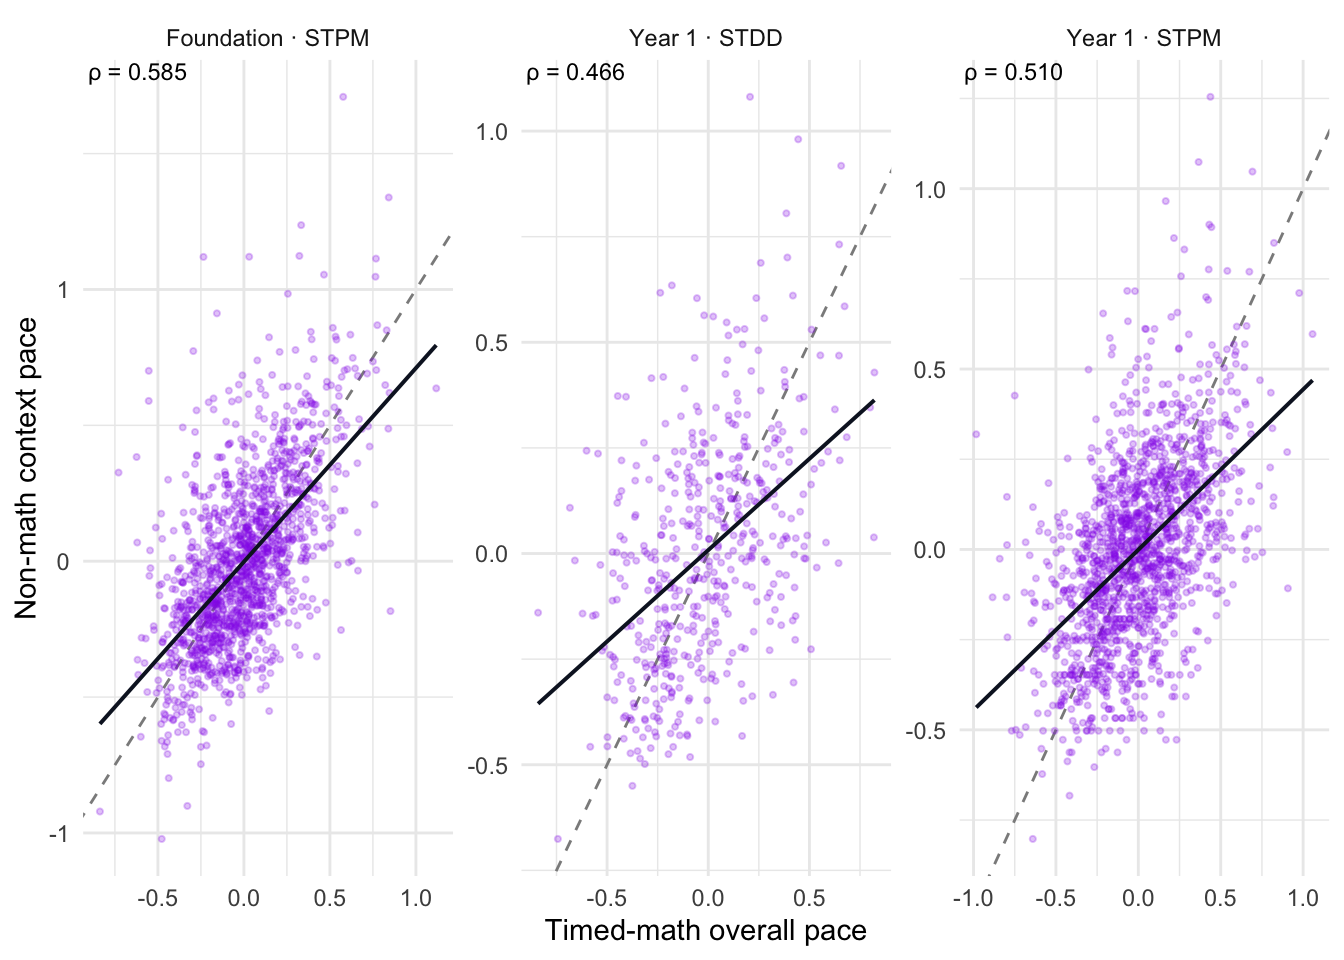
STPM/STDD context pace is moderately correlated with timed-math response pace, suggesting a general response-tempo or interaction-speed component. However, the correlations are not high enough to treat non-math context pace as equivalent to timed-math pace. STPM/STDD therefore provide useful context and sensitivity evidence, but should not be pooled into the primary timed-math response-pace construct.
NoteHow to read this
High correlation would indicate a meaningful general interaction-speed component. Low correlation would indicate that timed-math pace is largely separate from general interaction speed. Either way, STPM/STDD remain context checks, not part of the primary timed-math construct.
3.10 Interim read
The current internal direction remains a hierarchical response-pace structure: one overall student pace plus subtest-specific residual pace, fitted to Term 3 selected timed-math data. Foundation evidence must be read with the A/B-linking caveat. Year 1 has stronger A/B linking. STPM/STDD remain context checks rather than part of the primary timed-math construct.
4. Iteration map
The remainder of the report walks through the joint accuracy + RT model iterations. Each node names the model in plain English, with the internal label in parentheses; arrows show what each iteration adds or changes.
flowchart TD
  A2["Accuracy-only benchmark (A2)<br/>broad achievement + testlet"]
  T1b["Pooled speed-only (T1b)"]
  T1c["Subtest-specific speed-only (T1c)"]
  J0["Joint accuracy + pooled RT (J0)"]
  J1["Joint accuracy + subtest RT (J1)"]
  J2a["+ global 2s rapid (J2a)<br/><i>superseded</i>"]
  J2b["+ per-subtest/item p05 rapid (J2b)"]
  J2c["+ residual log-RT (J2c)<br/><i>sensitivity</i>"]
  J3aC["Expanded selected subtests (J3a conservative)"]
  J3aM["+ Magnitude Comparison RT (J3a moderate)"]
  J3aB["+ ASDD modality (J3a broad)<br/><i>stress-test</i>"]

  A2 --> T1b --> T1c --> J0 --> J1
  J1 --> J2a
  J1 --> J2b
  J2b --> J2c
  J2b --> J3aC
  J3aC --> J3aM
  J3aC --> J3aB
4b. Reading Bayesian MCMC IRT diagnostics — brief primer
Every iteration below is fit with Bayesian Markov chain Monte Carlo (MCMC). Instead of a single best estimate per parameter, MCMC produces thousands of plausible draws from the posterior distribution. Diagnostics tell us whether those draws can be trusted.
| Metric | Plain meaning | What “good” looks like | Why it matters |
|---|---|---|---|
| Chains | independent simulations (we use 4) | all 4 finish and agree | catches local stuck-ness |
| Warm-up / sampling iters | tuning vs kept draws per chain | e.g. 1000 / 1000 | more = more precise posteriors |
| Divergences | sampler steps that hit numerical trouble | 0 (target) | divergences mean posteriors may be biased |
| Max tree depth | how deep the sampler had to search per step | well below cap (15) | hitting the cap = inefficient, possibly biased |
| Min E-BFMI | energy-based exploration check | ≥ 0.3 (want ≥ 0.5) | low = chains not exploring posterior well |
| R-hat (max) | agreement across chains per parameter | ≤ 1.01 | values > 1.01 mean chains disagree → not converged |
| ESS bulk (min) | effective independent draws per parameter | ≥ ~400 | low = posterior summaries are noisy |
| Finite lp | log-probability values are finite | yes | non-finite = something is broken |
Quick reading rule. If every row of a per-iteration diagnostics table is green, treat the run as fit-for-interpretation. If anything fails, we stop and do not interpret the model for decision-making (it may still be reported for transparency).
MCMC settings shorthand used in this report.
"500/500" = 4 chains × 500 warm-up + 500 sampling iterations
"1k/1k"   = 4 chains × 1000 warm-up + 1000 sampling iterations
The student sample is unchanged across these settings; only the number of posterior draws changes.
5. Foundation model walk-through
Foundation is the clearest evidence base so far. The conservative selected-subtest path has passed the current stability checks, and the new speed-only / hierarchical response-pace smokes now give an initial check on whether the next hierarchical tau direction is sensible.
5.1 Foundation status at a glance
| Plain label | Code | What it tests | Current status | Main reading |
|---|---|---|---|---|
| Accuracy-only benchmark | A2 | protected achievement anchor | benchmark | remains the achievement reference |
| Pooled speed-only | T1b | one response-pace trait | background | useful, but too coarse as the only pace structure |
| Subtest-specific speed-only | T1c | separate subtest pace | adopted as design evidence | subtest pace retains information beyond pooled pace |
| Per-subtest/item rapid joint model | J2b | selected-subtest joint accuracy + RT | candidate | clean, interpretable baseline |
| Residual log-RT sensitivity | J2c | extra residual RT term | sensitivity only | clean, but not a replacement for J2b |
| Expanded selected-subtest joint model | J3a conservative | operational selected-subtest expansion | preferred internal candidate | stable against J2b and 500/1000 settings |
| Hierarchical response-pace joint model | J3b | overall pace + subtest residuals | 100/100 smoke complete | promising; needs longer run and diagnostics |
| Speed-only J3 counterparts | T2a/T2b/T2c | RT-only counterparts to J3 structures | 100/100 smokes complete | tau estimates are very similar across structures |
| Magnitude Comparison variant | J3a moderate | adds Magnitude Comparison RT | Foundation run complete; clean diagnostics but large movement vs conservative | exploratory, not a replacement decision yet |
5.2 Foundation conservative stability evidence
| Comparison | Metric | n | Pearson | Spearman | median |diff| | p95 |diff| | max |diff| |
|---|---|---|---|---|---|---|---|
| foundation_1000_vs_500 | theta | 2537 | 0.9999 | 0.9991 | 0.0119 | 0.0391 | 0.0845 |
| foundation_1000_vs_500 | tau_joint | 2537 | 1.0000 | 1.0000 | 0.0015 | 0.0044 | 0.0110 |
| foundation_1000_vs_500 | tau_match_quantity | 2537 | 0.9999 | 0.9999 | 0.0021 | 0.0062 | 0.0119 |
| foundation_1000_vs_500 | tau_missing_number | 2537 | 1.0000 | 0.9999 | 0.0019 | 0.0058 | 0.0165 |
| foundation_1000_vs_j2b | theta | 2537 | 0.9982 | 0.9974 | 0.0343 | 0.1647 | 0.5367 |
| foundation_1000_vs_j2b | tau_joint | 2537 | 1.0000 | 0.9999 | 0.0015 | 0.0044 | 0.0121 |
| foundation_1000_vs_j2b | tau_match_quantity | 2537 | 0.9999 | 0.9999 | 0.0018 | 0.0056 | 0.0157 |
| foundation_1000_vs_j2b | tau_missing_number | 2537 | 1.0000 | 0.9999 | 0.0020 | 0.0060 | 0.0191 |
Read: Foundation J3a conservative is highly stable. The 1000/1000 run is almost identical to the 500/500 run for theta and tau. Compared with Foundation J2b, tau is essentially unchanged and theta remains strongly aligned. The theta differences are larger than the 500/1000 sampling differences because J3a expands the selected-subtest scope, not because the sampler is unstable.
5.3 Foundation J2b → J2c → J3a interpretation
J2b — per-subtest/item rapid rule
J2b replaces the earlier global rapid rule with a per-subtest/item empirical p05 rule:
Accuracy: logit P(Y_pi = 1) = a_i(theta_p - b_i) + testlet_p + gamma_family * rapid_pi
RT:       log(RT_pi)         = lambda_i - tau_{p,family(i)} + error
Rapid:   rapid_pi = 1{RT <= min(item p05, subtest p05)}
For Foundation, J2b is the selected-subtest baseline. It gives a clean response-process interpretation: unusually rapid responses have negative accuracy effects, while tau remains a separate response-pace estimate.
J2c — residual log-RT sensitivity
J2c completed cleanly and compared closely with J2b. Its role is sensitivity evidence: it asks whether adding residual logRT changes the interpretation. It did not provide a reason to replace J2b as the Foundation baseline.
Key available summary:
| Quantity | Available result |
|---|---|
| Divergences | 0 across 4 chains |
| Max treedepth | 8 |
| J2c vs J2b theta correlation | 0.991 |
| J2c vs J2b tau correlation | 1.000 |
| Decision | sensitivity evidence, not replacement |
J3a conservative — expanded selected-subtest joint model
J3a conservative keeps the J2b likelihood idea and expands the selected-subtest scope using the corrected J3 data packs. Foundation has passed both the 500/500 and 1000/1000 gates.
Key available summary:
| Gate | Foundation result |
|---|---|
| Divergences | 0 |
| Max treedepth | 7 |
| Min E-BFMI | 0.547 |
| 1000 vs 500 theta Spearman | 0.9991 |
| 1000 vs 500 p95 abs(theta shift) | 0.039 |
| 1000 vs J2b theta Spearman | 0.9974 |
| Tau stability | Spearman about 0.9999 |
Finding: Foundation J3a conservative is the strongest current Foundation candidate for selected-subtest response-process evidence, pending remaining external/subgroup/movement review.
5.4 Foundation T2/J3b hierarchical response-pace smoke
The new T2/J3b smoke suite asks whether the next model should separate:
overall response pace
+
subtest-specific residual pace| model | chains | draws_per_chain | divergences | max_treedepth | min_ebfmi | lp_finite |
|---|---|---|---|---|---|---|
| J3b hierarchical joint | 2 | 100 | 0 | 10 | 0.699 | TRUE |
| T2a separate-subtest speed-only | 2 | 100 | 0 | 10 | 0.535 | TRUE |
| T2b hierarchical speed-only | 2 | 100 | 0 | 10 | 0.854 | TRUE |
| T2c tau + task timing speed-only | 2 | 100 | 0 | 10 | 0.498 | TRUE |
| Comparison | n | Pearson | Spearman | median |diff| | p95 |diff| |
|---|---|---|---|---|---|
| T2b overall vs T2a post-hoc mean tau | 2537 | 0.9990 | 0.9990 | 0.0064 | 0.0242 |
| T2c single tau vs T2a post-hoc mean tau | 2537 | 0.9877 | 0.9891 | 0.0230 | 0.0926 |
| J3b overall tau vs T2b speed-only overall tau | 2537 | 0.9995 | 0.9993 | 0.0054 | 0.0172 |
| J3b family-mean tau vs T2b speed-only family mean | 2537 | 0.9995 | 0.9993 | 0.0054 | 0.0172 |
| T2b family tau vs T2a tau: match_quantity | 2537 | 0.9989 | 0.9987 | 0.0106 | 0.0341 |
| J3b family tau vs T2b family tau: match_quantity | 2537 | 0.9992 | 0.9988 | 0.0072 | 0.0238 |
| T2b family tau vs T2a tau: missing_number | 2537 | 0.9989 | 0.9989 | 0.0102 | 0.0411 |
| J3b family tau vs T2b family tau: missing_number | 2537 | 0.9990 | 0.9988 | 0.0073 | 0.0263 |
Read: the 100/100 smokes completed with 0 divergences and acceptable E-BFMI. They did hit max treedepth 10, so these are not final production-length runs. The substantive result is promising: hierarchical speed-only tau and separate-subtest speed-only tau are very highly aligned, and J3b joint hierarchical tau is very highly aligned with T2b speed-only hierarchical tau. That supports proceeding to a longer J3b/T2b run rather than dropping the hierarchical path.
5.5 Foundation current decision
Foundation conservative evidence is strong enough to keep J3a conservative as the current selected-subtest candidate. J3b/T2b is now the highest-priority next specification test because it can answer whether we can report/interpret response pace as:
one overall response-pace estimate
plus subtest-specific deviations
That would be easier to explain than a set of unrelated subtest taus, but it must pass longer-run diagnostics and movement checks first.
6. Year 1 model walk-through
Year 1 follows the same logic as Foundation, but the evidence base is more recent because the Year 1 J2b source scope was corrected.
6.1 Year 1 source correction
The earlier narrow Year 1 J2b specification excluded part of the intended arithmetic scope. The corrected J2b includes:
addition multi-choice
subtraction multi-choice
missing number
This corrected source scope is the Year 1 baseline for J3a validation.
6.2 Year 1 status at a glance
| Plain label | Code | Current status | Main reading |
|---|---|---|---|
| Global 2s rapid rule | J2a | failed MCMC, not interpreted | retained as a flag only |
| Corrected per-subtest/item rapid | J2b corrected | passed | current Year 1 selected-subtest baseline |
| Expanded selected-subtest joint model | J3a conservative 500/500 | passed against corrected J2b | highly stable |
| Expanded selected-subtest joint model | J3a conservative 1000/1000 | cisbox run complete; basic gate passed | use as current Year 1 conservative candidate pending broader anchors/subgroups |
| Magnitude Comparison variant | J3a moderate | exploratory Year 1 run in progress | review only after moderate run completes |
| Hierarchical response-pace model | J3b Year 1 | not launched | next after Foundation J3b review |
6.3 Year 1 corrected J2b diagnostics
Available corrected Year 1 J2b evidence:
| Gate | Result |
|---|---|
| Families | addition MC, subtraction MC, missing number |
| Chains | 4 |
| Draws per chain | 800 |
| Divergences | 0 |
| Max treedepth | 8 |
| Rapid effects | negative for all included families |
| Decision | corrected J2b adopted as Year 1 selected-subtest baseline |
The rapid effects are in the expected direction: unusually rapid responses are associated with lower accuracy after accounting for achievement and item difficulty.
6.4 Year 1 J3a conservative validation to date
| Comparison | Metric | n | Pearson | Spearman | median |diff| | p95 |diff| | max |diff| |
|---|---|---|---|---|---|---|---|
| year1_500_vs_corrected_j2b | theta | 2562 | 0.9999 | 0.9998 | 0.0120 | 0.0401 | 0.0767 |
| year1_500_vs_corrected_j2b | tau_joint | 2562 | 1.0000 | 1.0000 | 0.0017 | 0.0052 | 0.0107 |
| year1_500_vs_corrected_j2b | tau_addition_mc | 2562 | 1.0000 | 1.0000 | 0.0021 | 0.0062 | 0.0137 |
| year1_500_vs_corrected_j2b | tau_missing_number | 2562 | 1.0000 | 0.9999 | 0.0020 | 0.0060 | 0.0109 |
| year1_500_vs_corrected_j2b | tau_subtraction_mc | 2562 | 0.9999 | 0.9999 | 0.0027 | 0.0086 | 0.0202 |
| year1_j3a_conservative_1000_vs_corrected_j2b | theta_joint | 2562 | 0.9999 | 0.9999 | 0.0097 | 0.0335 | 0.0708 |
| year1_j3a_conservative_1000_vs_corrected_j2b | tau_joint | 2562 | 1.0000 | 1.0000 | 0.0014 | 0.0042 | 0.0089 |
| year1_j3a_conservative_1000_vs_corrected_j2b | tau_addition_mc | 2562 | 1.0000 | 1.0000 | 0.0017 | 0.0050 | 0.0093 |
| year1_j3a_conservative_1000_vs_corrected_j2b | tau_missing_number | 2562 | 1.0000 | 1.0000 | 0.0016 | 0.0047 | 0.0089 |
| year1_j3a_conservative_1000_vs_corrected_j2b | tau_subtraction_mc | 2562 | 1.0000 | 0.9999 | 0.0023 | 0.0071 | 0.0161 |
Read: Year 1 J3a conservative 500/500 and 1000/1000 are both extremely stable against corrected J2b. The 1000/1000 run has 0 divergences, max treedepth 7, and min E-BFMI 0.615. Broader external-anchor and subgroup movement checks still remain.
6.5 Year 1 current decision
Year 1 corrected J2b remains the corrected selected-subtest baseline. Year 1 J3a conservative now passes the completed 1000/1000 basic gate against corrected J2b; broader external-anchor and subgroup movement checks still remain.
7. Cross-model performance vs benchmark
This section consolidates the current status across models. The benchmark remains A2/current achievement. Response-pace estimates are evaluated as response-process evidence, not as achievement.
7.1 Current model status table
| Year level | Current strongest candidate | Stability status | External-anchor status | Current decision |
|---|---|---|---|---|
| Foundation | J3a conservative | passed 500/1000 and J2b comparisons | partial J2b anchors available; J3a broader anchors pending | preferred internal selected-subtest candidate |
| Year 1 | J3a conservative 1k | J2b passed; J3a 500 and 1k basic gates passed | partial J2b anchors available; J3a broader anchors pending | current conservative candidate pending broader validation |
| Foundation hierarchical pace | J3b/T2b | 100/100 smoke complete | no external-anchor interpretation yet | proceed to longer run |
| Year 1 hierarchical pace | J3b/T2b | not launched | not available | wait for Foundation hierarchical review |
7.2 Available anchor heatmap
The heatmap below uses currently available J2b anchor correlations. It is included as a status snapshot, not as the final J3a/J3b validation table.
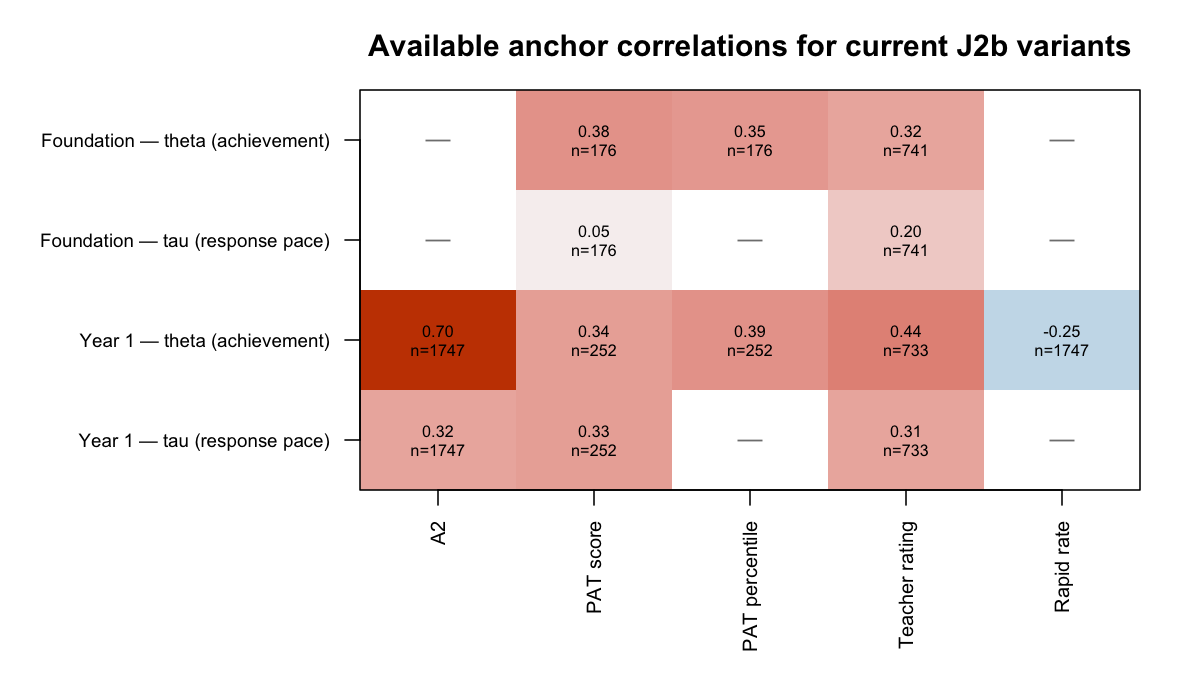
Read: theta should align with achievement anchors such as A2, PAT, and teacher ratings. Tau should align more strongly with response-process anchors such as observed RT and rapid-response rate, and only modestly with achievement anchors. That separation is the desired pattern.
7.3 Anchor sample-size context
| Anchor | Foundation n | Year 1 n | Interpretation note |
|---|---|---|---|
| PAT score | 176 | 252 | linked subset only |
| PAT percentile | 176 | 252 | same linked subset as PAT score |
| Teacher rating | 741 | 733 | teacher survey returners only |
| Observed RT / rapid rate | model sample | model sample | response-process anchors from cleaned response data |
Because PAT and teacher anchors are partial-linkage samples, they are useful checks but not the only validation gate.
8. Cross-cutting stability comparisons
8.1 Conservative J3a stability
| Comparison | Metric | n | Spearman | median |diff| | p95 |diff| | max |diff| |
|---|---|---|---|---|---|---|
| foundation_1000_vs_500 | theta | 2537 | 0.9991 | 0.0119 | 0.0391 | 0.0845 |
| foundation_1000_vs_500 | tau_joint | 2537 | 1.0000 | 0.0015 | 0.0044 | 0.0110 |
| foundation_1000_vs_j2b | theta | 2537 | 0.9974 | 0.0343 | 0.1647 | 0.5367 |
| foundation_1000_vs_j2b | tau_joint | 2537 | 0.9999 | 0.0015 | 0.0044 | 0.0121 |
| year1_500_vs_corrected_j2b | theta | 2562 | 0.9998 | 0.0120 | 0.0401 | 0.0767 |
| year1_500_vs_corrected_j2b | tau_joint | 2562 | 1.0000 | 0.0017 | 0.0052 | 0.0107 |
| year1_j3a_conservative_1000_vs_corrected_j2b | theta_joint | 2562 | 0.9999 | 0.0097 | 0.0335 | 0.0708 |
| year1_j3a_conservative_1000_vs_corrected_j2b | tau_joint | 2562 | 1.0000 | 0.0014 | 0.0042 | 0.0089 |
| foundation_j3a_moderate_500_vs_conservative_1000 | theta_joint | 2537 | 0.7949 | 0.4229 | 1.2911 | 5.0118 |
| foundation_j3a_moderate_500_vs_conservative_1000 | tau_joint | 2537 | 0.9214 | 0.0652 | 0.2122 | 0.4784 |
Read: sampling-setting stability is excellent for Foundation. Year 1 conservative is also excellent against corrected J2b at both 500/500 and 1000/1000. Foundation moderate is deliberately separated from conservative stability because adding Magnitude Comparison RT produced substantial theta movement and needs deeper review.
8.2 Rapid-rule sensitivities
| Sensitivity | Foundation status | Year 1 status | Current reading |
|---|---|---|---|
| strict vs capped p05 | stable in available checks | stable in corrected checks | rapid policy choice does not materially move theta/tau |
| rapid vs no-rapid | stable in available checks | stable in corrected checks | rapid term adds interpretation more than movement |
| global 2s vs p05 | global rule superseded | global rule failed | per-subtest/item empirical p05 is retained |
8.3 Hierarchical response-pace sensitivity
| Comparison | Current smoke result | Reading |
|---|---|---|
| T2b overall vs T2a post-hoc mean tau | Spearman about 0.999 | hierarchical overall tau matches the average of separate taus very closely |
| T2b family tau vs T2a family tau | Spearman about 0.999 by family | hierarchical model preserves subtest tau ordering |
| J3b overall tau vs T2b overall tau | Spearman about 0.999 | adding accuracy/rapid terms did not materially change overall tau in the smoke |
| T2c tau-testlet vs T2a mean tau | Spearman about 0.989 | task/testlet timing model is related but less identical; worth retaining as sensitivity |
9. External / anchor validation
9.1 What is already available
Current anchor evidence is strongest for J2b and Year 1 corrected J2b. It shows the intended separation:
| Quantity | Expected relationship | Current pattern |
|---|---|---|
| theta vs A2/PAT/teacher | positive achievement alignment | available J2b anchors are positive |
| tau vs observed RT / rapid rate | strong response-process alignment | available J2b anchors behave as expected |
| tau vs A2/PAT/teacher | modest, not dominant | available checks are modest compared with RT/process anchors |
9.2 What is still pending
| Pending validation | Why it matters | Blocking output |
|---|---|---|
| J3a conservative external anchors | confirms expanded selected-subtest model preserves achievement alignment | final J3a posterior extracts joined to PAT/teacher/A2 |
| J3b/T2b external anchors | checks hierarchical tau interpretation | longer J3b/T2b run and posterior extract |
| Subgroup movement by school/class/student characteristics | ensures changes are not concentrated in specific groups | movement table with subgroup joins |
| Slow-but-accurate review | confirms pace remains separate from achievement | targeted movement and tau distribution checks |
9.3 Current validation stance
The available anchor pattern is encouraging, but external validation is not closed for J3a/J3b. The report should therefore describe J3a conservative as a strong current candidate and J3b as a promising specification test, not as a completed reporting model.
10. Movement and protection
The central protection rule is unchanged:
A2/current achievement remains the protected achievement anchor.
Response pace is separate response-process evidence.
No response-pace model changes current achievement bands.
10.1 Available movement evidence
| Comparison | n | Spearman | median abs theta shift | p95 abs theta shift | max abs theta shift |
|---|---|---|---|---|---|
| foundation_1000_vs_500 | 2537 | 0.9991 | 0.0119 | 0.0391 | 0.0845 |
| foundation_1000_vs_j2b | 2537 | 0.9974 | 0.0343 | 0.1647 | 0.5367 |
| year1_500_vs_corrected_j2b | 2562 | 0.9998 | 0.0120 | 0.0401 | 0.0767 |
Read: Foundation 500/1000 movement is tiny. Foundation J3a vs J2b movement is larger because the selected-subtest scope changes, but rank alignment remains high. Year 1 J3a 500 and 1000 comparisons against corrected J2b are both small.
10.2 Subgroup movement still required
| Subgroup lens | Status | Requirement before broader use |
|---|---|---|
| Cohort A vs B | pending | compare median/p95 theta shift and large-mover rates |
| LBOTE | pending | same movement checks, suppress small cells |
| ATSI | pending | same checks, with small-cell caution |
| School size band | pending | ensure movement is not concentrated in small/large schools |
| Class size band | pending | same movement checks |
| Disability/supported adjustments | sensitivity appendix | only if source fields are approved and complete |
10.3 Slow-but-accurate protection
Slow-but-accurate students should remain high on achievement if they are correct. In these models:
- theta is driven by accuracy and item difficulty;
- tau is a separate response-pace estimate;
- slow responses are not penalised by the rapid-response term;
- the rapid-response term only applies to unusually fast responses under the per-subtest/item p05 rule.
A targeted slow-but-accurate movement table is still needed before any non-internal interpretation.
11. Wright-map-style views
Wright-map-style views remain useful for communication, but they should be generated after the final candidate posterior extracts are frozen.
11.1 Accuracy view
The accuracy view will place:
student theta distribution
against
item difficulty / threshold locations
on the same achievement scale. This is the view that explains achievement.
11.2 Response-pace view
The response-pace view must be separate:
student tau distribution
against
item time-intensity locations
on a response-pace scale. It should not be overlaid on the achievement scale. This separation is important for avoiding any speed-as-achievement interpretation.
11.3 Status
| View | Current status | Next step |
|---|---|---|
| Foundation J3a accuracy map | not yet generated | use final Foundation J3a posterior + item bank |
| Foundation J3a pace map | not yet generated | use selected-subtest tau + item time intensity |
| Year 1 J3a maps | pending final external/subgroup review | generate after Year 1 candidate review closes |
| J3b hierarchical maps | pending longer run | decide whether to show overall pace plus residuals |
12. Gates and decisions scorecard + full lineage
12.1 Current gates scorecard
| Model run | Diagnostics | Stability | External anchors | Source/scope | Movement | Overall decision |
|---|---|---|---|---|---|---|
| Foundation J2b | pass | pass | partial pass | pass | pass at available level | candidate baseline |
| Foundation J2c | pass | close to J2b | limited | pass | sensitivity only | not replacement |
| Foundation J3a conservative 1k/1k | pass | pass | pending | pass | overall movement available; subgroup pending | preferred internal candidate |
| Year 1 corrected J2b | pass | pass | partial pass | pass | pass at available level | candidate baseline |
| Year 1 J3a conservative 500/500 | pass | pass vs corrected J2b | pending | pass | overall movement available | comparison evidence |
| Year 1 J3a conservative 1k/1k | pass | pass vs corrected J2b | pending | pass | overall movement available; subgroup pending | current conservative candidate |
| Foundation T2a/T2b/T2c 100/100 | smoke pass with treedepth caution | pass directional comparisons | not applicable | pass | not a theta model | design evidence |
| Foundation J3b 100/100 | smoke pass with treedepth caution | tau aligns with T2b | pending | pass | pending | proceed to longer run |
| J3a moderate | Foundation diagnostic pass; Year 1 running | Foundation movement large vs conservative | pending | pass | pending | exploratory only |
| Broad/untimed/speed-testlet combined variants | not launched | not available | not available | specification pending | pending | hold |
12.2 Full lineage
| display_label | internal_label | year_level | status | role | headline_result |
|---|---|---|---|---|---|
| J0/J1 early RT prototypes | J0/J1 | Foundation and Year 1 | completed legacy research | selected-family background only | Useful early exploration but not full-battery and superseded by family-aware J2b |
| J2 global rapid sensitivity | J2 | Foundation | completed legacy sensitivity | not preferred selected-family model | Foundation usable as sensitivity but old global rapid rule is too crude; not full-battery |
| J2 Year 1 | J2-Year1 | Year 1 | failed MCMC | not usable | 544 divergences and poor E-BFMI/no reliable inference; not full-battery |
| Foundation J2b | J2b-Foundation | Foundation | clean full run | primary Foundation selected-family internal candidate | 0 divergences; rapid effects negative; selected-family theta aligns with A2; tau aligns with RT/rapid behaviour |
| Year 1 J2b | Year1-J2b-strict-p05 | Year 1 | clean full run | primary Year 1 selected-family internal candidate | 0 divergences; improved validation; family rapid effects negative; source/current definition stable |
| Year 1 J2b capped-p05 sensitivity | Year1-J2b-capped-p05 | Year 1 | clean full run | selected-family robustness sensitivity | Strict vs capped theta/tau essentially unchanged; gamma ordering stable |
| Year 1 rapid-vs-no-rapid comparison | Year1-J2b-no-rapid-comparison | Year 1 | clean full run | selected-family parsimony/specification check | No-rapid gives essentially identical theta/tau and validation; rapid rows still much less accurate |
| Foundation J2c | J2c-Foundation | Foundation | clean full run | selected-family exploratory sensitivity | Residual-logRT effects are family-specific; theta close to Foundation J2b |
| Proposed selected-family speed/accuracy 3x3 grid | grid-prototype | Foundation and Year 1 | in prototype | selected-family proposed reporting product prototype | Needs scope caveat plus grid counts/cell validation/fairness/uncertainty checks |
13. What we can / cannot say
| Can say now | Cannot yet say |
|---|---|
| Response time carries information beyond accuracy in selected timed subtests | Response time is an achievement signal |
| A single pooled response-pace estimate is too coarse as the only structure | There is a final reporting-ready response-pace score |
| Subtest-specific pace is justified as current design evidence | Faster responses are better |
| J3a conservative Foundation is stable against current gates | J3a/J3b are ready for broader reporting |
| Year 1 corrected J2b is stable after source correction | Year 1 J3a is complete before external-anchor and subgroup checks close |
| J3b/T2b smokes support continuing hierarchical response-pace tests | J3b has passed production-length diagnostics |
| Slow-but-accurate students are protected conceptually because pace is separate from achievement | Slow responses by themselves have a single approved interpretation |
14. Next steps and open work
- Continue monitoring Year 1 J3a moderate exploratory run.
- Investigate Foundation J3a moderate movement before considering any Magnitude Comparison RT expansion.
- Fill Year 1 J3a conservative external-anchor and subgroup movement tables.
- Run a longer Foundation J3b/T2b hierarchical response-pace pilot, with treedepth mitigation if needed.
- Decide whether T2c tau + task/testlet timing should remain a separate sensitivity path or become J3c.
- Fill J3a external-anchor tables by joining posterior summaries to A2, PAT, teacher, observed RT, and rapid-rate anchors.
- Build subgroup movement tables: cohort, LBOTE, ATSI, school size, and any approved support-adjustment fields.
- Generate Wright-map-style achievement and response-pace views after the candidate posterior extracts are frozen.
- Keep broad, untimed RT, and combined speed-testlet variants on hold until their specifications are explicitly approved.
15. Audit appendix
15.1 Run directory roots
studies/enssa-v2-response-process-program-2026-t2/results/round2/m3/speed/
    t1b_rounded_lognormal_clean/                         # pooled speed-only background
    t1c_family_speed/                                    # subtest-specific speed-only background
    accuracy_speed_validation/joint_accuracy_rt_j2b/      # Foundation J2b
    accuracy_speed_validation/joint_accuracy_rt_j2b_y1_add_sub_mc_strict_p05/  # Year 1 corrected J2b
    accuracy_speed_validation/joint_accuracy_rt_j2c_foundation/  # J2c sensitivity
    j3_operational_accuracy_speed_design/j3a_conservative_pilot_stan/  # J3a conservative
    j3_operational_accuracy_speed_design/t2_speed_only_tau_stan/        # T2a/T2b/T2c smokes
    j3_operational_accuracy_speed_design/j3b_hierarchical_tau_stan/     # J3b smoke
    j3_operational_accuracy_speed_design/t2_j3b_extracted_summaries/    # extracted summaries for this report
15.2 Stan models
models/irt/irt-joint-stan-pcm/v4-longitudinal/stan/
    m3_joint_accuracy_rt_j2b_family_rapid.stan
    m3_joint_accuracy_rt_j2c_foundation_resid_logrt.stan
    m3_joint_accuracy_rt_j2b_family_no_rapid_ablation.stan
    m3_j3a_selected_timed_family_accuracy_rt.stan
    m3_j3b_hierarchical_tau_accuracy_rt.stan
    m3_t2a_speed_only_separate_tau.stan
    m3_t2b_speed_only_hierarchical_tau.stan
    m3_t2c_speed_only_tau_testlet.stan
15.3 Key scripts
models/irt/irt-joint-stan-pcm/v4-longitudinal/R/113_m3_j3a_expanded_timed_family_data_builder.R
models/irt/irt-joint-stan-pcm/v4-longitudinal/R/117_m3_j3a_conservative_pilot_runner.sh
models/irt/irt-joint-stan-pcm/v4-longitudinal/R/118_m3_j3a_stan_csv_diagnostics.R
models/irt/irt-joint-stan-pcm/v4-longitudinal/R/119_m3_j3a_extract_person_posteriors.py
models/irt/irt-joint-stan-pcm/v4-longitudinal/R/120_m3_j3a_variant_pilot_runner.sh
models/irt/irt-joint-stan-pcm/v4-longitudinal/R/121_m3_j3b_hierarchical_tau_runner.sh
studies/.../colleague_reporting/R_generate_accuracy_speed_report_figures.R
studies/.../colleague_reporting/R_generate_accuracy_speed_anchor_heatmap.R
/tmp/extract_t2_j3b_summaries.py  # extraction utility used to create local T2/J3b summary CSVs
15.4 Extracted summary files used by this report
studies/.../j3_operational_accuracy_speed_design/t2_j3b_extracted_summaries/
    m3_t2_j3b_100_100_diagnostics.csv
    m3_t2_j3b_100_100_scalar_means.csv
    m3_t2_j3b_foundation_comparisons.csv
    m3_t2_j3b_foundation_person_summaries.csv
15.5 Figure manifest
| Figure / table | Script or source | Current status |
|---|---|---|
| Section 2 RT distributions | R_generate_accuracy_speed_report_figures.R |
rendered |
| Section 2 accuracy × RT panels | R_generate_accuracy_speed_report_figures.R |
rendered |
| Section 3 T1 scatterplots | m3_t1c_family_person_speed_with_context...csv |
rendered inline |
| Section 3/5 T2/J3b comparison tables | m3_t2_j3b_foundation_comparisons.csv |
rendered inline |
| Section 7 anchor heatmap | R_generate_accuracy_speed_anchor_heatmap.R |
rendered |
| Section 8 stability table | m3_j3a_conservative_validation_compare...csv |
rendered inline |
| Wright-map-style views | pending final posterior extracts | not yet generated |
15.6 Current heavy-artifact location on cisbox
/data/numeracy-screening-models/irt/m3_joint_accuracy_rt/j3a_conservative_pilot/work/numeracy-screening/Completed cisbox smoke runs used here:
j3_operational_accuracy_speed_design/t2_speed_only_tau_stan/t2-speedonly-foundation-cisbox-100-100-20260604T092931Z/
j3_operational_accuracy_speed_design/j3b_hierarchical_tau_stan/j3b-foundation-conservative-cisbox-100-100-20260604T093040Z/