Number line PCM vs continuous
Related report: Number Line probe response-process report
1. Executive summary
The evidence currently supports keeping the testlet + partial-credit-style ordinal model (NL2) as the operational-compatible Number Line target. The continuous testlet model (NL4aTH) is technically viable and competitive at both Foundation and Year 1, but it does not yet improve validation, screening, and operational simplicity enough to replace the current target.
Key points
- Existing
.85/.95ordinal categories remain defensible for operational modelling. - Continuous testlet modelling succeeded technically in both Foundation and Year 1.
- The continuous testlet model (
NL4aTH) correlates strongly with the testlet + partial-credit-style ordinal model (NL2) but moves some students meaningfully. - External validation and screening do not show a consistent cross-year advantage for the continuous challenger.
- Signed-error and continuous analyses remain important for response-process validity and item design.
2. Full-battery variants compared in the main report
| Variant | Label | Response used | Model type | Estimation framework | Testlet/local dependence |
|---|---|---|---|---|---|
| Full-battery raw accuracy benchmark |
FB0
|
Raw accuracy aggregated across all eligible maths items/subtests | Benchmark, not IRT | Computed aggregate | No |
| Testlet + partial-credit-style ordinal model |
NL2
|
Full battery with Number Line scored as .85/.95 ordinal categories
|
Embedded ordinal/testlet model |
mirt frequentist MML
|
Yes |
| Continuous testlet model |
NL4aTH
|
Full battery with Number Line scored as continuous logit-scale accuracy | Stan logit-normal full-battery model | Stan MCMC | Yes |
3. Model configurations and estimands
Full-battery raw accuracy benchmark (FB0)
FB0 is not an IRT model. It averages raw item accuracy across maths items/subtests where is_attempted == TRUE, is_practice == FALSE, and raw_score is usable (not missing). Non-Number-Line items contribute binary accuracy; Number Line items contribute their continuous raw accuracy score.
\[ FB0_p = \frac{1}{n_p}\sum_{i \in \mathcal{I}_p} s_{pi} \]
where \(s_{pi}\) is the item-level score and \(\mathcal{I}_p\) is the set of attempted, non-practice items with non-missing raw_score for student administration \(p\).
Testlet + partial-credit-style ordinal model (NL2)
NL2 is the current operational-compatible target. It is estimated with mirt using frequentist marginal maximum likelihood (MML). It uses the full battery, with non-Number-Line items as binary accuracy items and Number Line items converted to .85/.95 ordinal categories.
For Number Line responses:
\[ Y_{pi}=\begin{cases} 0, & r_{pi}<0.85,\\ 1, & 0.85 \le r_{pi}<0.95,\\ 2, & r_{pi}\ge 0.95. \end{cases} \]
The ordinal Number Line component is partial-credit-style: it treats the three ordered categories as increasing levels of response accuracy. In implementation this is GPCM/PCM-style rather than a strict textbook PCM.
| Feature | Testlet + partial-credit-style ordinal model (NL2) |
Strict Rasch PCM |
|---|---|---|
| Response type | Ordered .85/.95 Number Line categories plus binary non-Number-Line items |
Ordered polytomous item categories |
| Item discrimination | Allows item calibration/discrimination in a GPCM-style form | Fixed/equal discrimination, typically slope 1 |
| Local dependence | Includes person-by-testlet effects | Not included by default |
| Assessment scope | Embedded in the full maths battery | Usually fitted to the polytomous items unless extended |
| Purpose here | Operational full-battery ability estimate with ordinal Number Line scoring | A stricter sensitivity model that would test an additional Rasch constraint |
Continuous testlet model (NL4aTH)
NL4aTH is a full-battery Stan MCMC model that treats Number Line responses as continuous accuracy values on the logit scale.
\[ r^*_{pi}=\operatorname{clip}_{[0.001,0.999]}(r_{pi}), \qquad \ell_{pi}=\operatorname{logit}(r^*_{pi}). \]
For Number Line items:
\[ \ell_{pi}\mid\theta_p,u_{p,k[i]},b_i,\sigma_{f[i]} \sim \mathcal{N}(\theta_p+u_{p,k[i]}-b_i,\sigma^2_{f[i]}). \]
The small interior clipping is only for the logit transform: exact 1 scores exist, and \(\operatorname{logit}(1)\) is infinite.
Because NL2 and NL4aTH use different Number Line response variables, this report does not compare them using AIC, BIC, or log-likelihood. The comparison uses agreement, movement, external validation, screening behaviour, subgroup movement, and operational burden.
4. Why ordinal binning can outperform a continuous model
A continuous Number Line model is attractive because the response is naturally continuous: a placement closer to the target contains more information than a placement farther away. In principle, modelling that continuous accuracy should preserve more measurement information than converting the score into categories.
In practice, the current evidence does not show a consistent operational advantage for the continuous testlet challenger over the ordinal testlet target. There are several plausible psychometric reasons for this.
| Mechanism | Why it matters for Number Line scoring |
|---|---|
| Motor and interface noise | Very small differences in click location can reflect mouse/touch precision, screen size, device handling, or calibration noise rather than numeracy. Ordinal categories can deliberately ignore some of this fine-grained noise. |
| Boundary mass | Many responses are near-perfect or exactly perfect. Logit-scale continuous models require clipping exact 0/1 values, and the high-end boundary can dominate model behaviour. |
| Thresholded competence | External anchors such as PAT and teacher ratings may align more with “close enough / not close enough” competence than with every small spatial-error difference. |
| Signed-error structure | Absolute accuracy loses whether students systematically over-place or under-place numbers. A continuous absolute-accuracy model can still miss compression, endpoint, and target-location biases. |
| Heterogeneous error variance | Error variance likely differs by target value, bounded vs unbounded format, centred vs non-centred layout, term/form, and ability level. A simple continuous likelihood can be too smooth. |
| Local dependence and method effects | Number Line items share interface and strategy demands. The continuous challenger improved only after adding testlet structure, which suggests method effects matter at least as much as response scale. |
| Operational robustness | The .85/.95 categories may act as a denoising rule: coarse enough to be stable, but still graded enough to preserve useful Number Line evidence. |
This does not mean the current .85/.95 categories are psychometric truth. It means the continuous challenger has to clear an operational burden: it must improve validation, screening behaviour, fairness, score stability, and interpretability enough to justify the extra modelling complexity.
The next continuous-model iteration should therefore start with a boundary and signed-error audit before adding complexity. Candidate extensions include zero/one-inflated beta or logit-normal likelihoods, target and family/method effects, and compression/signed-error diagnostics. These should be introduced sequentially rather than all at once.
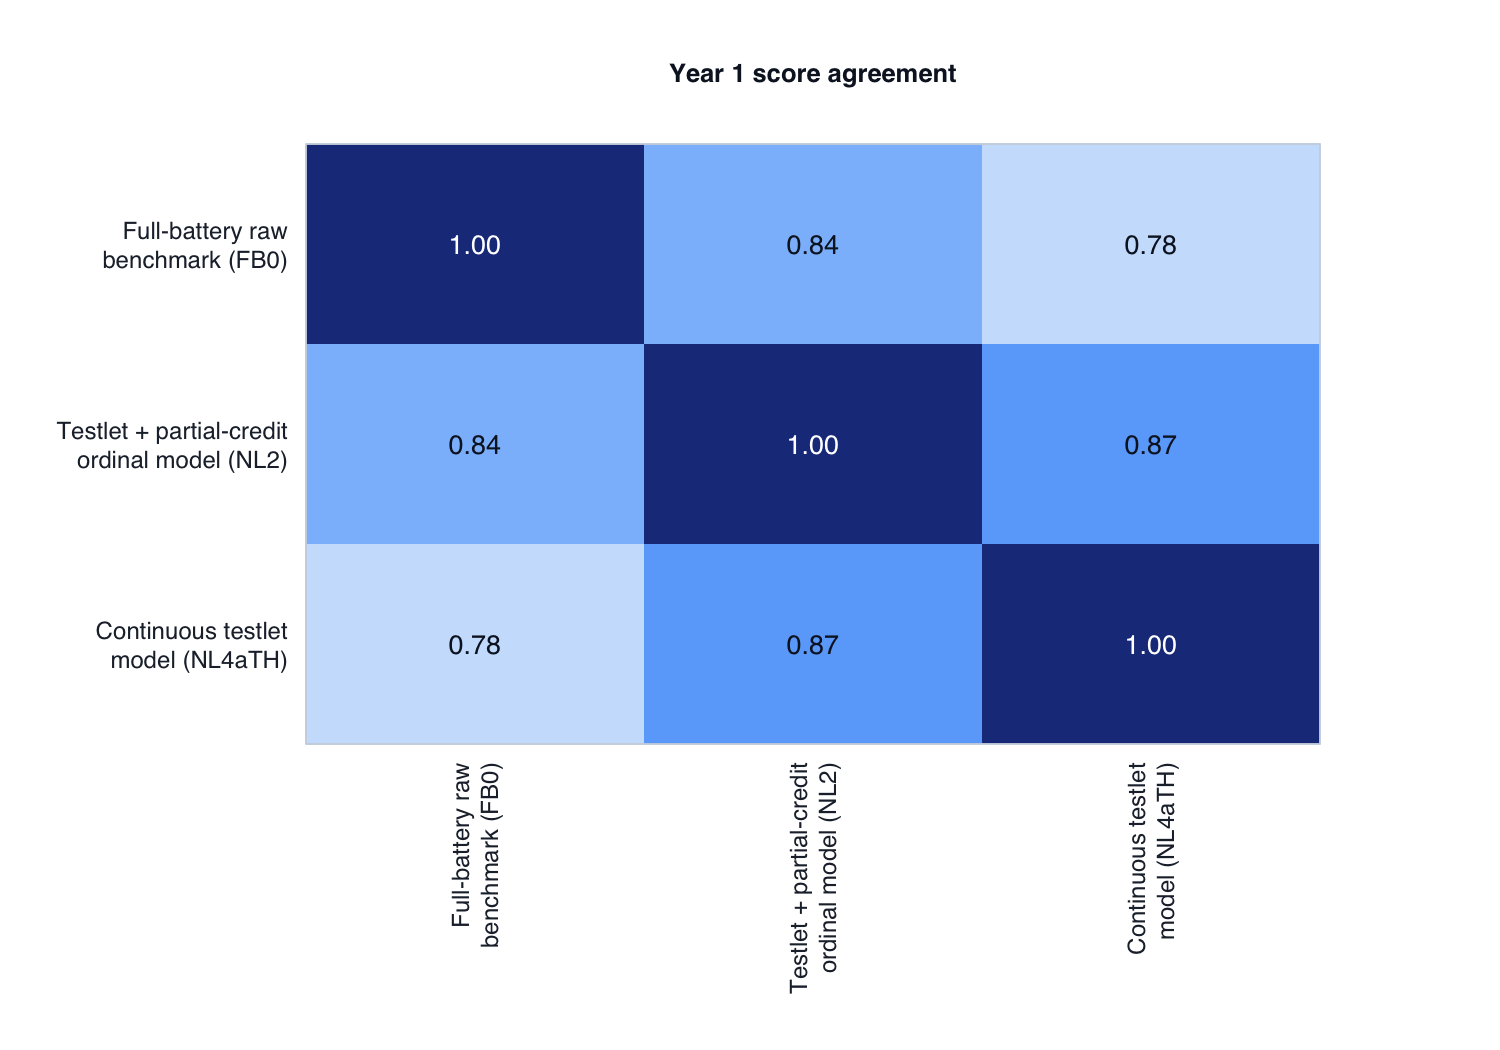
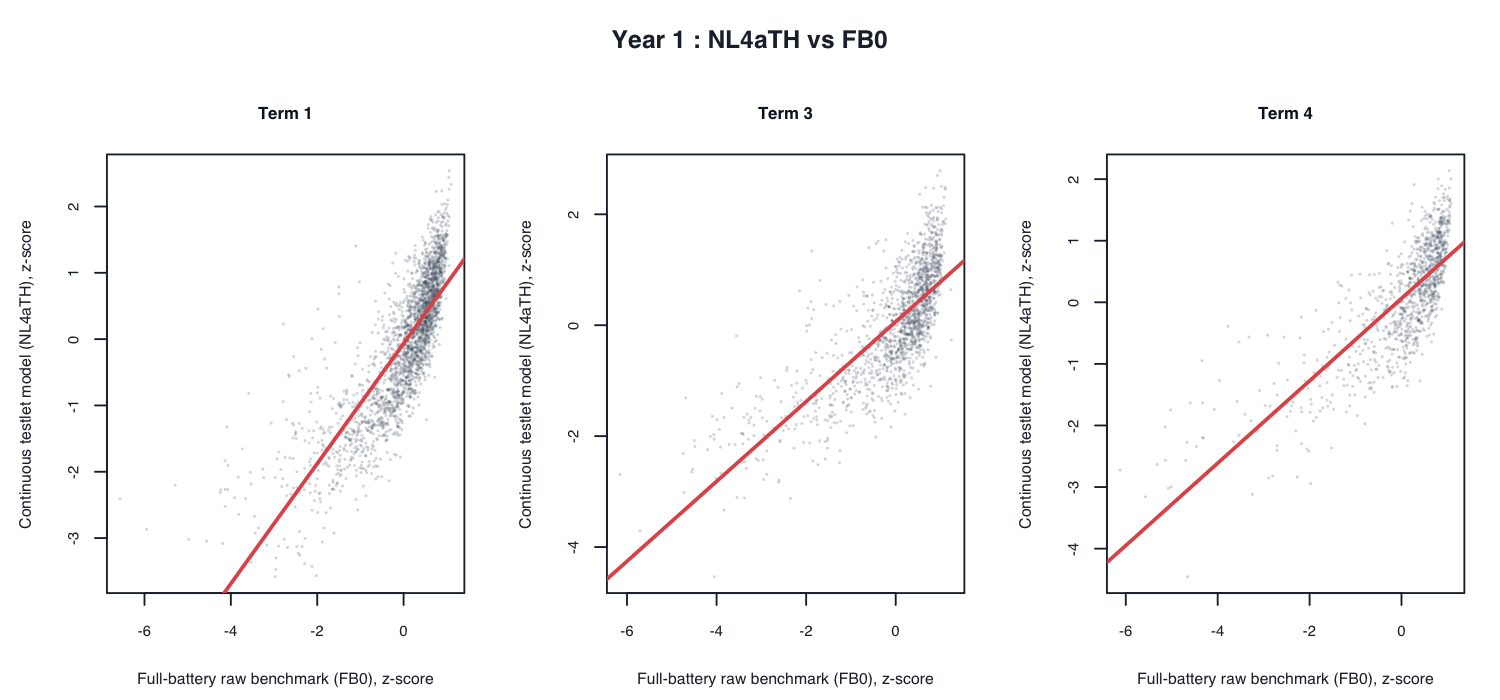
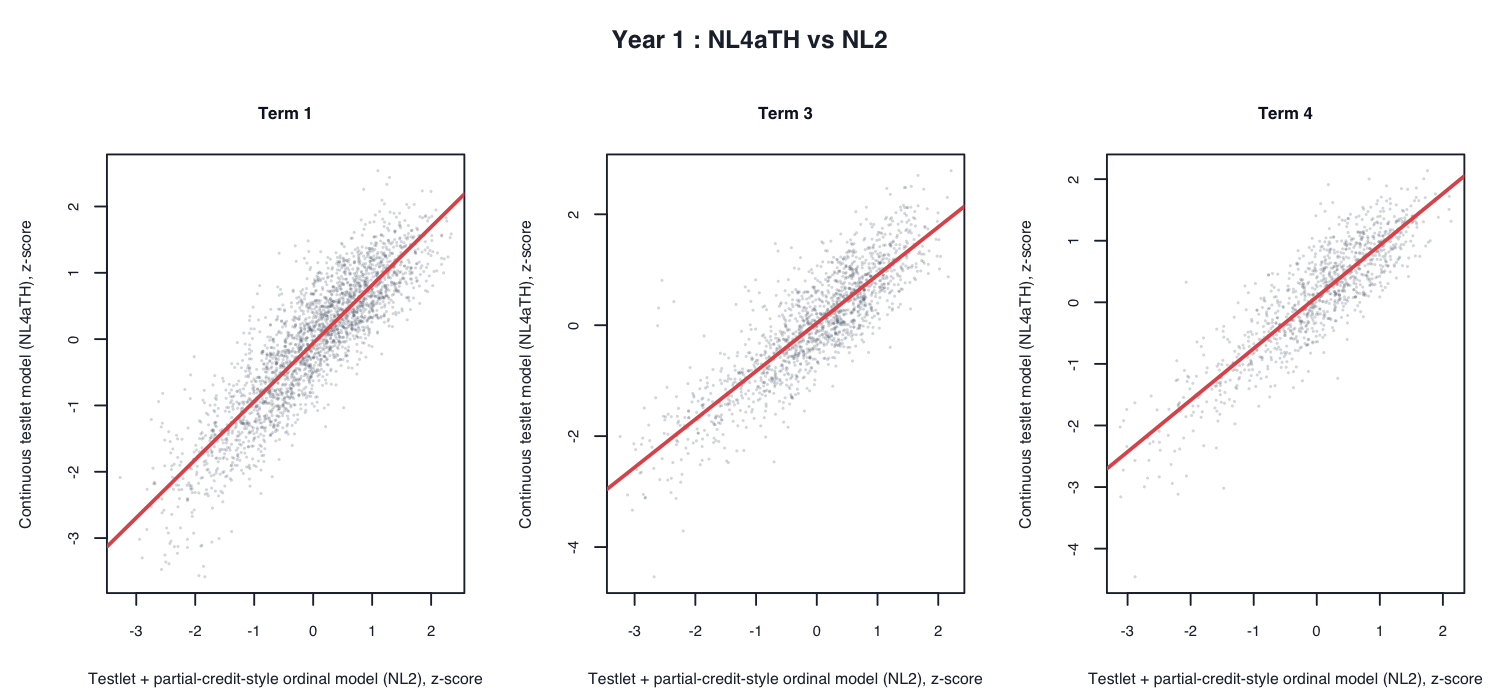
5. Score agreement among models
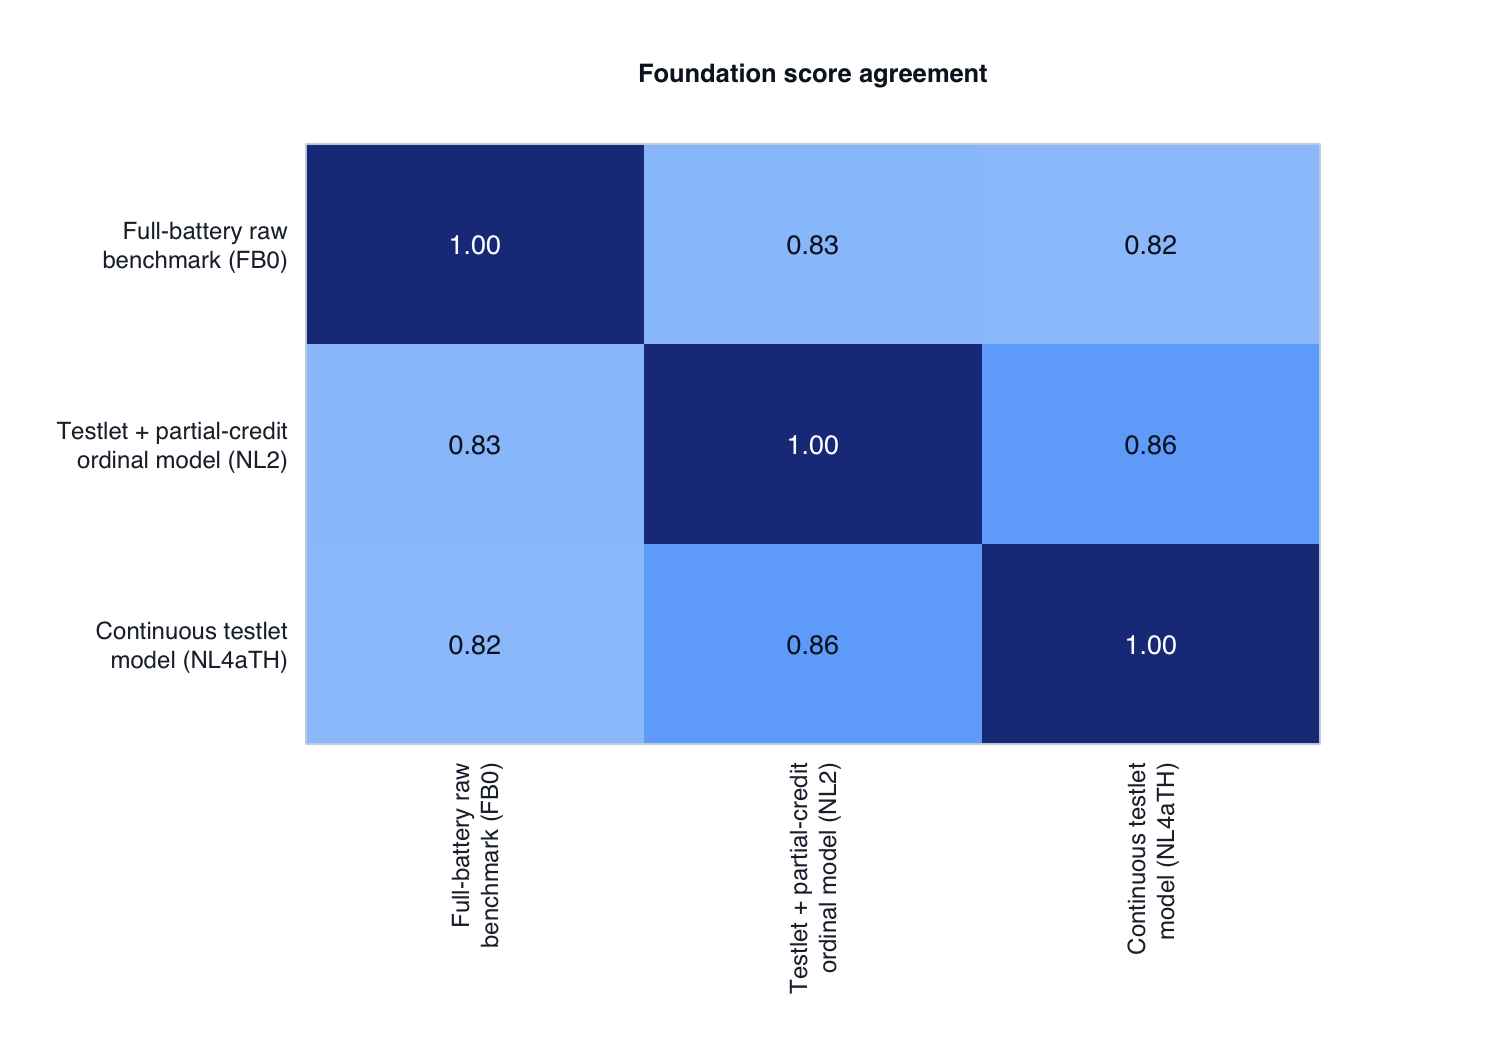
Selective scatter plots:
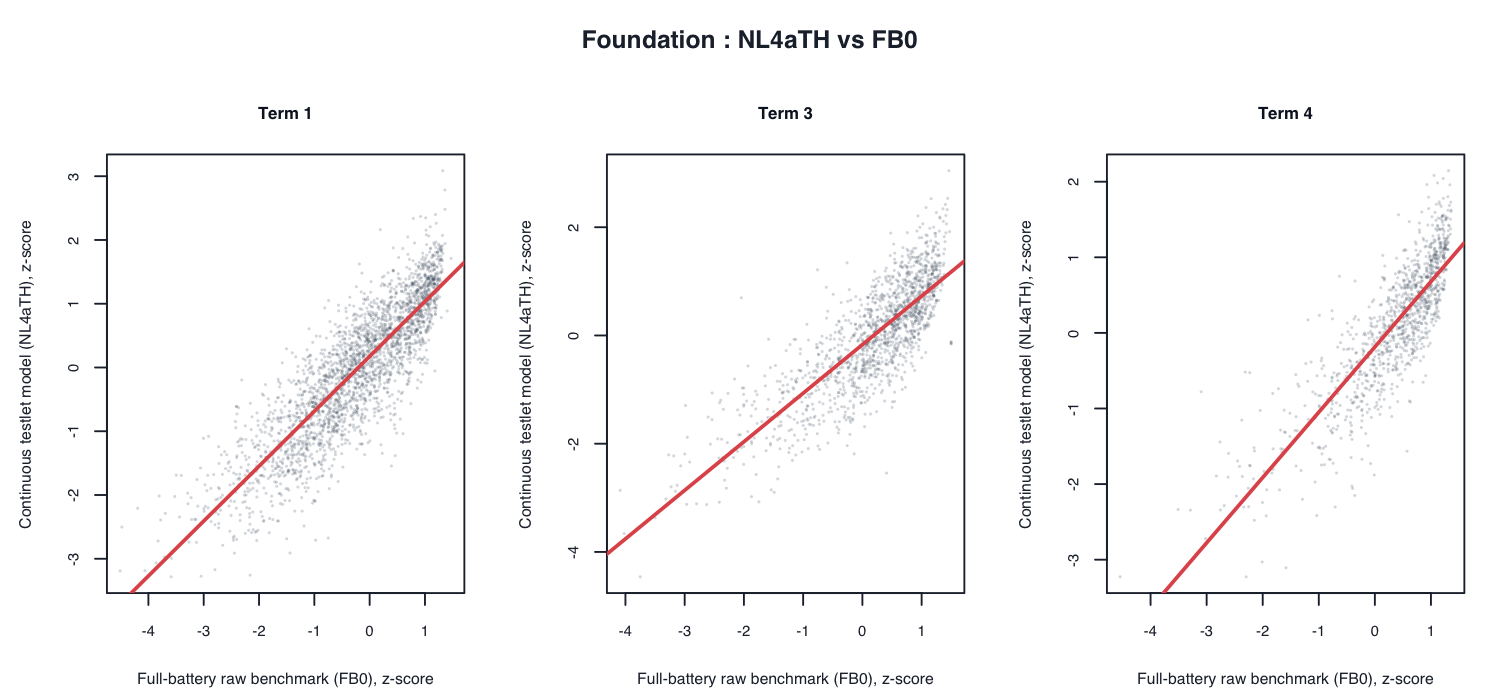
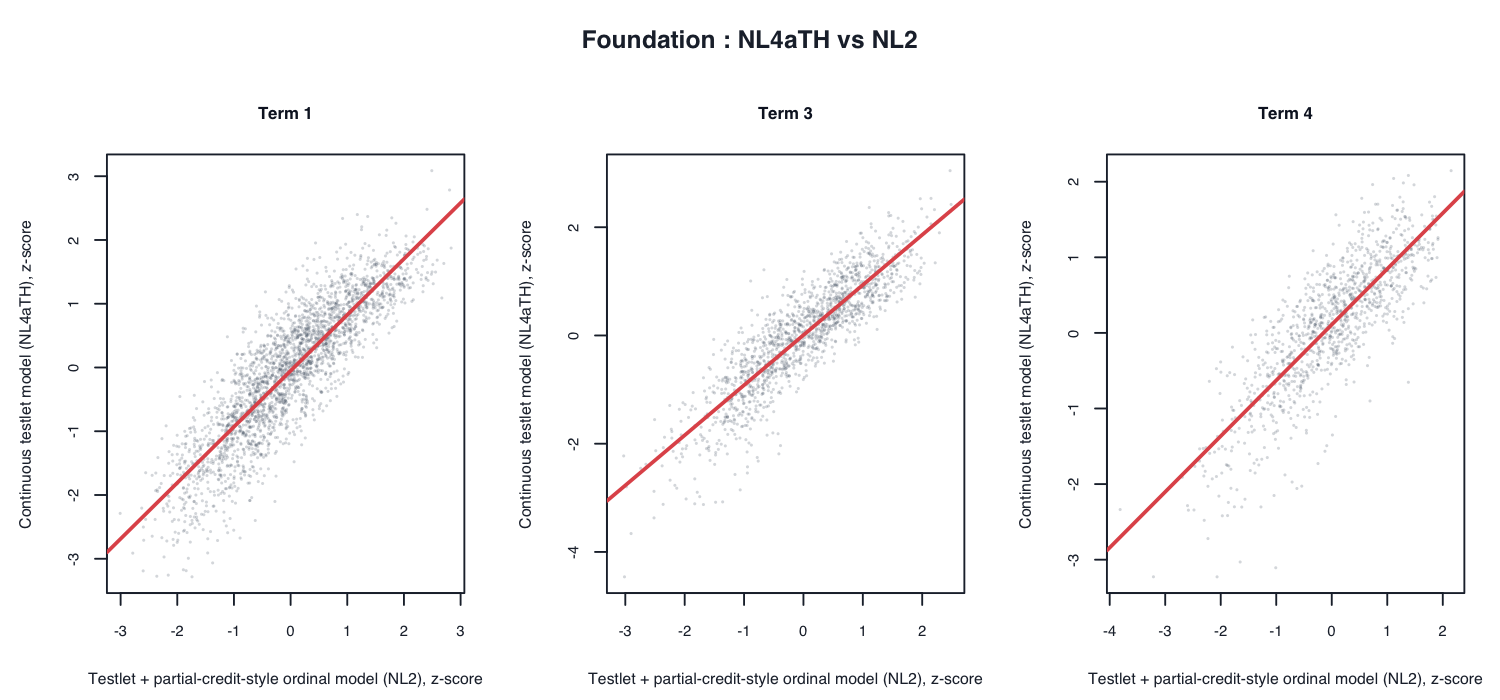
Selective scatter plots:
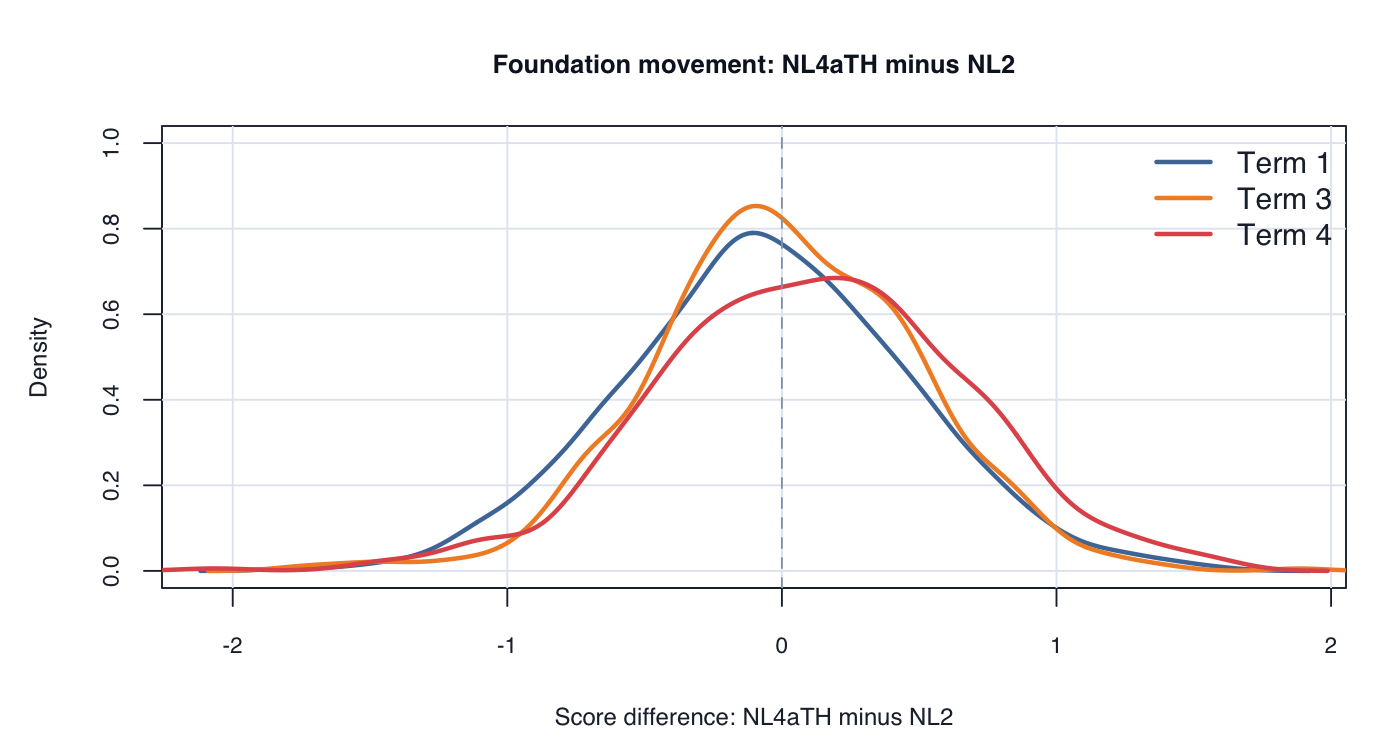
6. Movement relative to the current target
Movement of the continuous testlet model (NL4aTH) relative to the testlet + partial-credit-style ordinal model (NL2):
| Term | N | Median absolute z-difference | P90 absolute z-difference | Same-band rate | Moves higher | Moves lower |
|---|---|---|---|---|---|---|
| 1 | 2,517 | .354 | .871 | .728 | .126 | .147 |
| 3 | 1,449 | .319 | .780 | .753 | .115 | .132 |
| 4 | 1,099 | .378 | .923 | .701 | .183 | .116 |
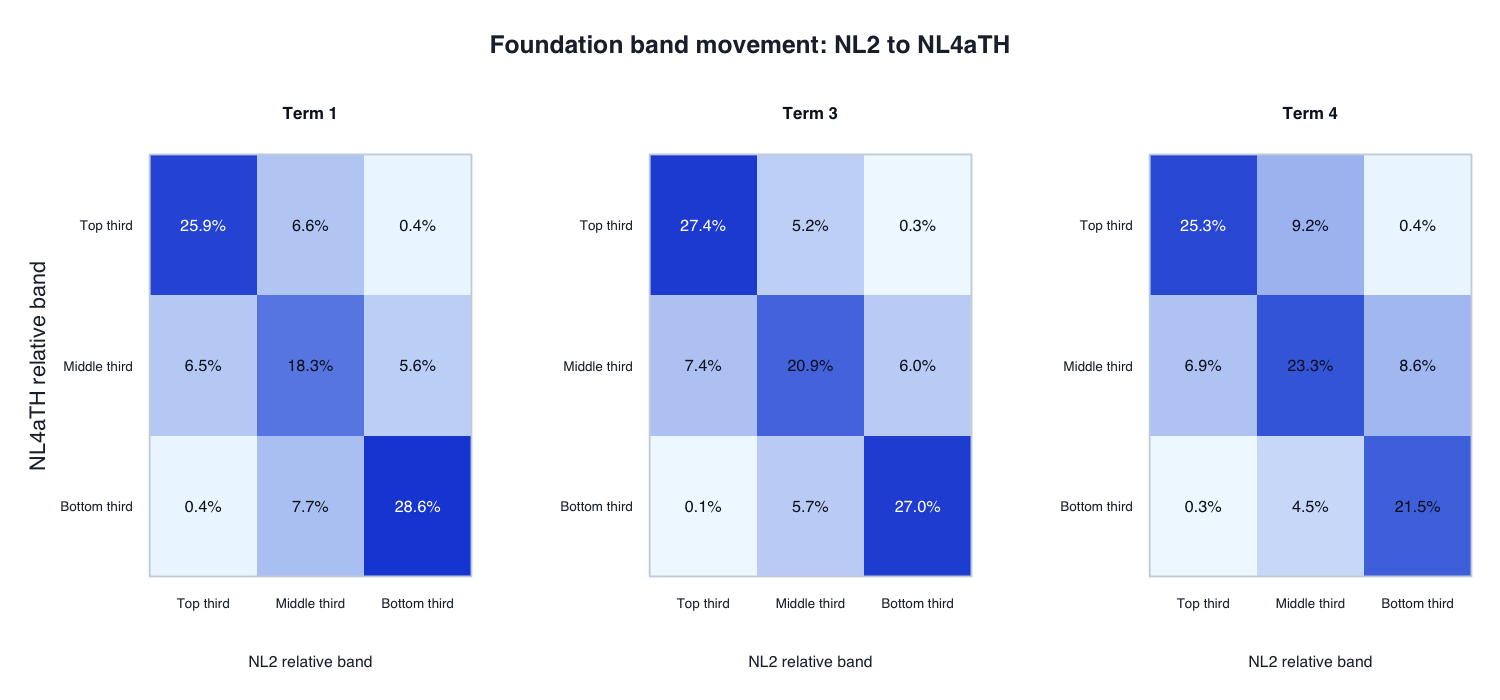
Interpretation: the continuous testlet model creates meaningful but not wholesale movement. Term 4 has the lowest same-band rate / largest band movement and more upward than downward movement.
Movement of the continuous testlet model (NL4aTH) relative to the testlet + partial-credit-style ordinal model (NL2):
| Term | N | Median absolute z-difference | P90 absolute z-difference | Same-band rate | Moves higher | Moves lower |
|---|---|---|---|---|---|---|
| 1 | 2,435 | .346 | .826 | .725 | .125 | .150 |
| 3 | 1,510 | .348 | .858 | .709 | .142 | .149 |
| 4 | 1,070 | .309 | .787 | .708 | .174 | .119 |
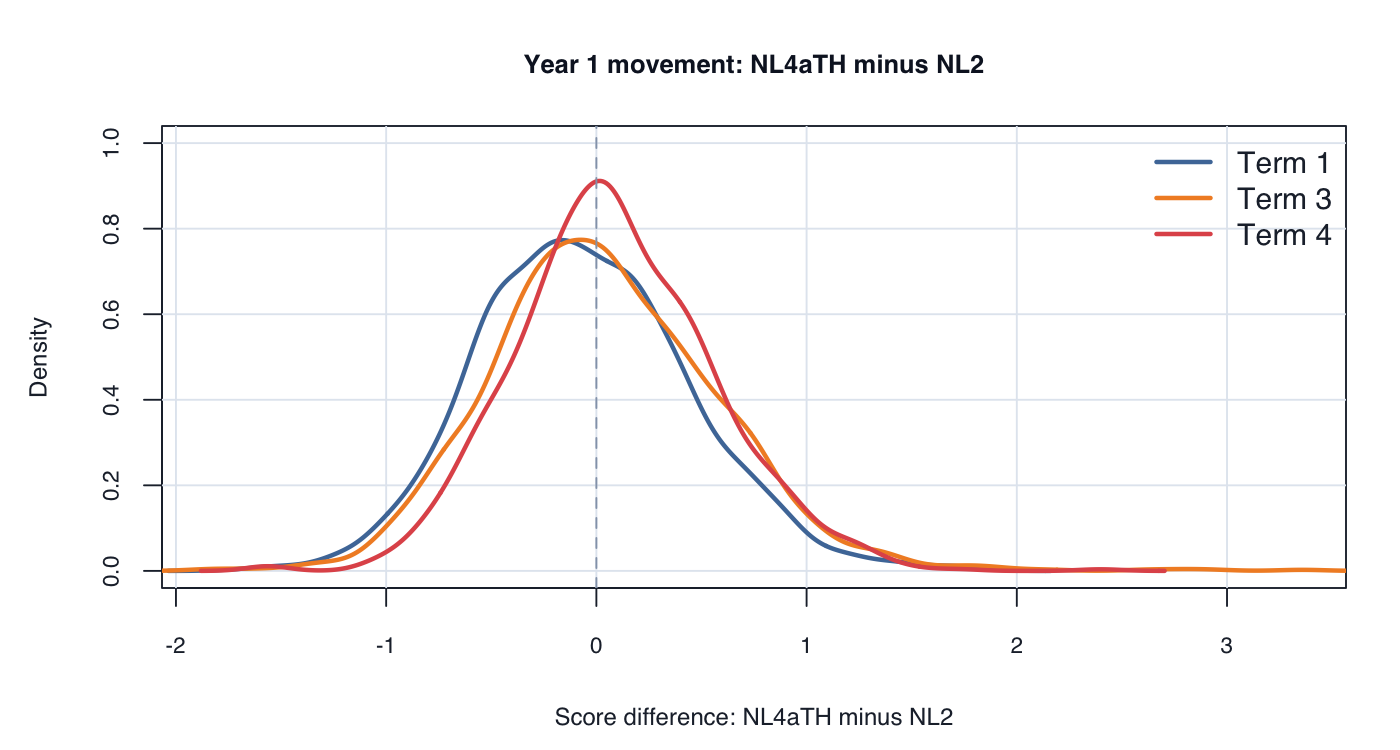
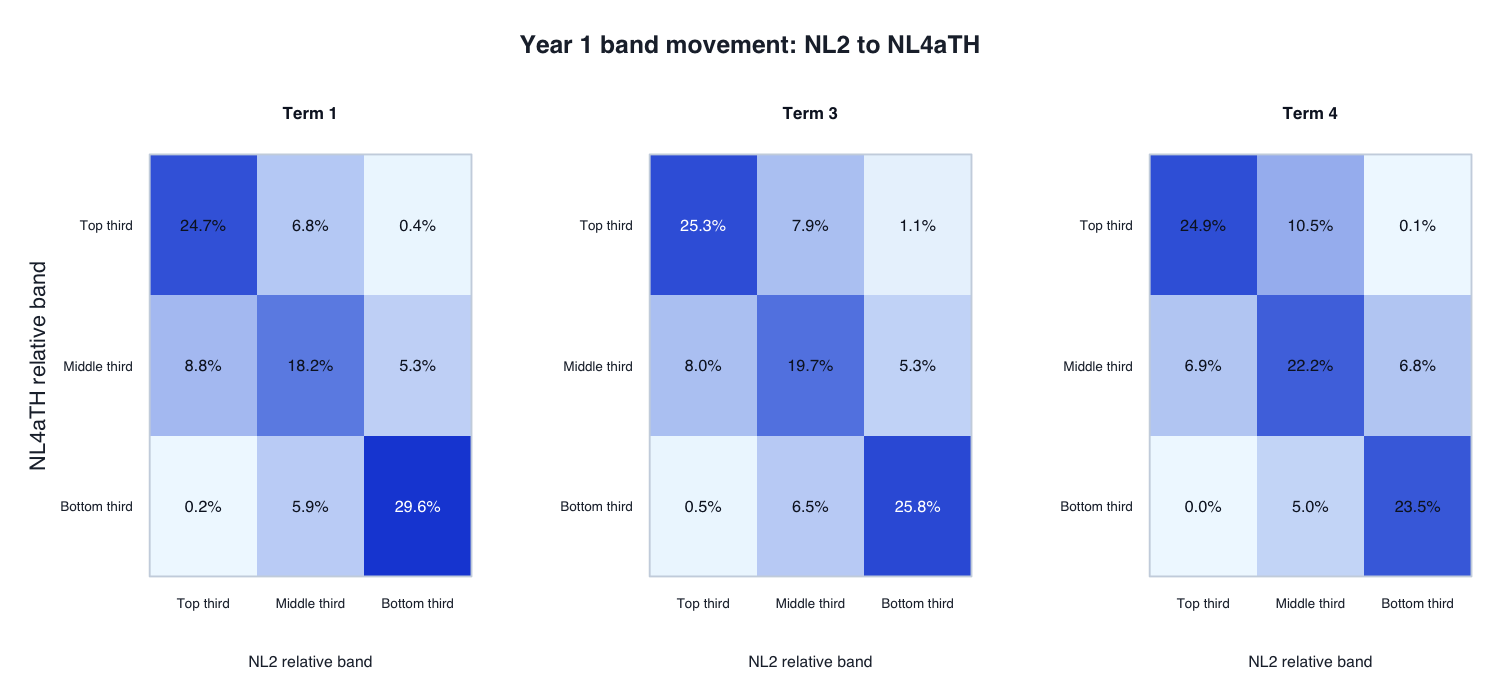
Interpretation: Year 1 movement is similar in scale to Foundation. Same-band rates are about 71–73%, with Term 4 again showing more upward than downward movement.
7. Wright map
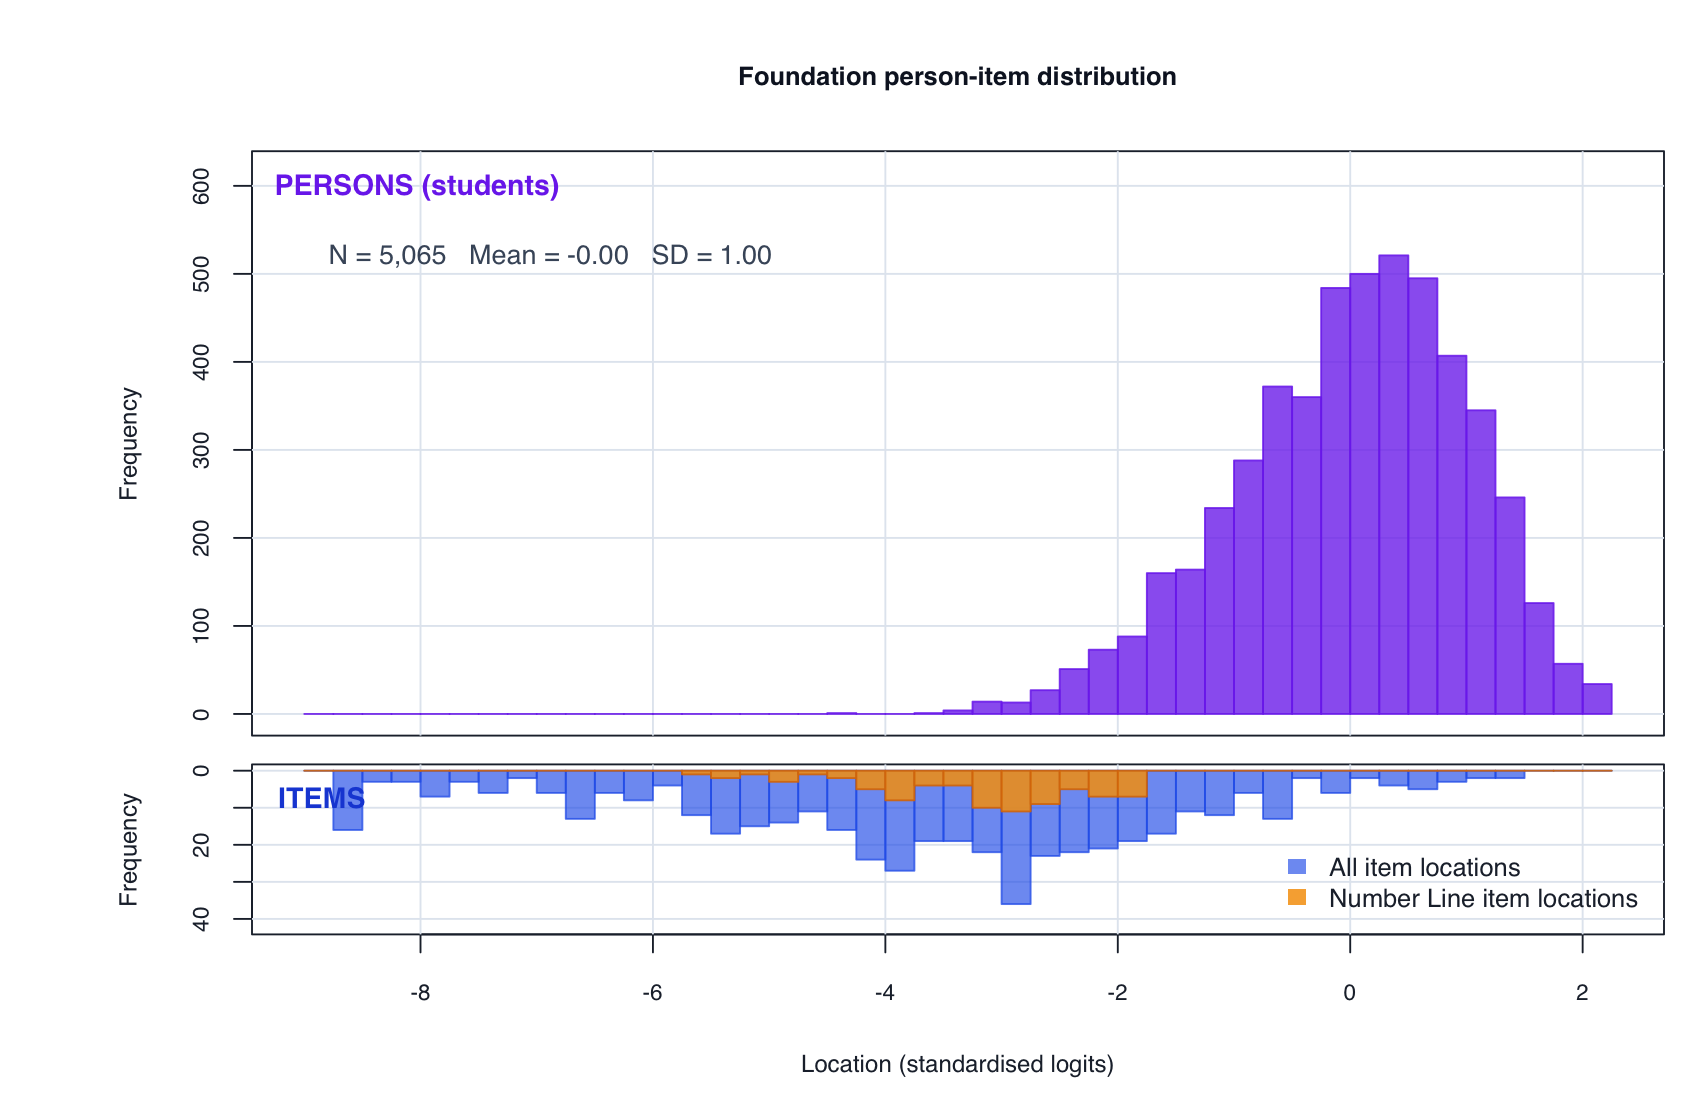
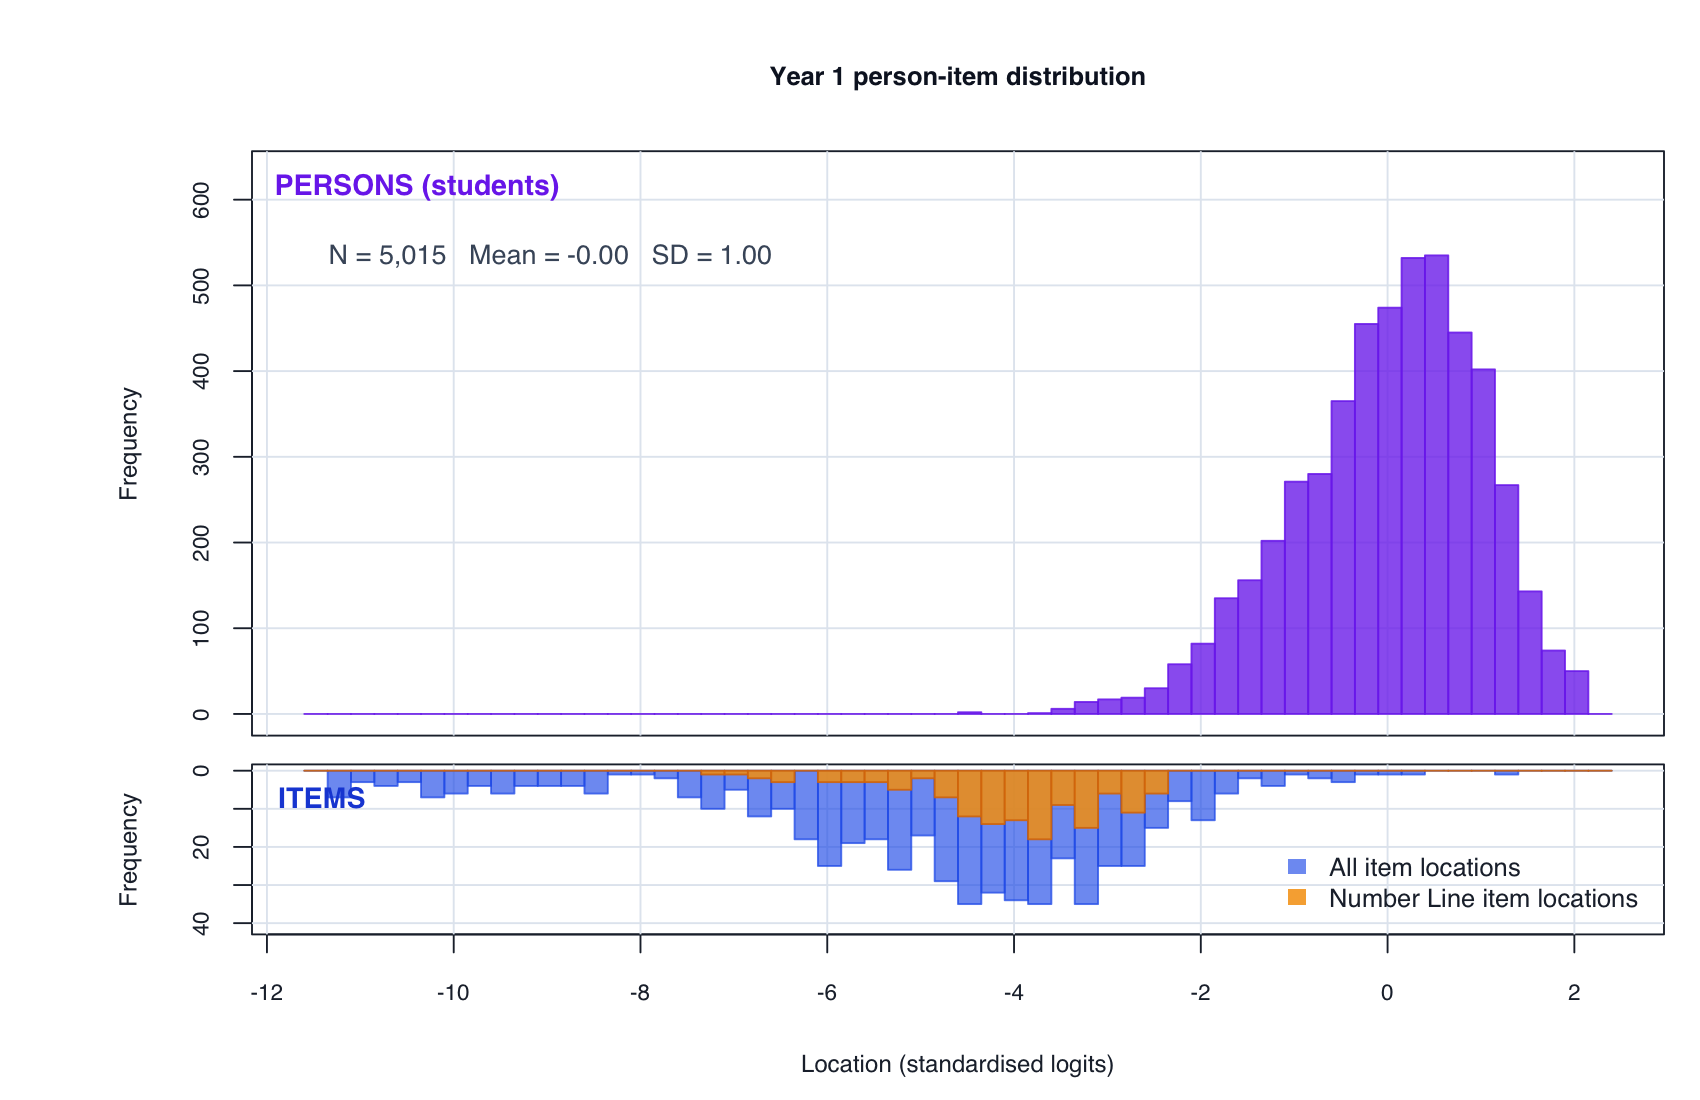
Why this matters: the Year 1 full continuous testlet model is now complete, so the same person-item threshold view can be shown for both year levels.
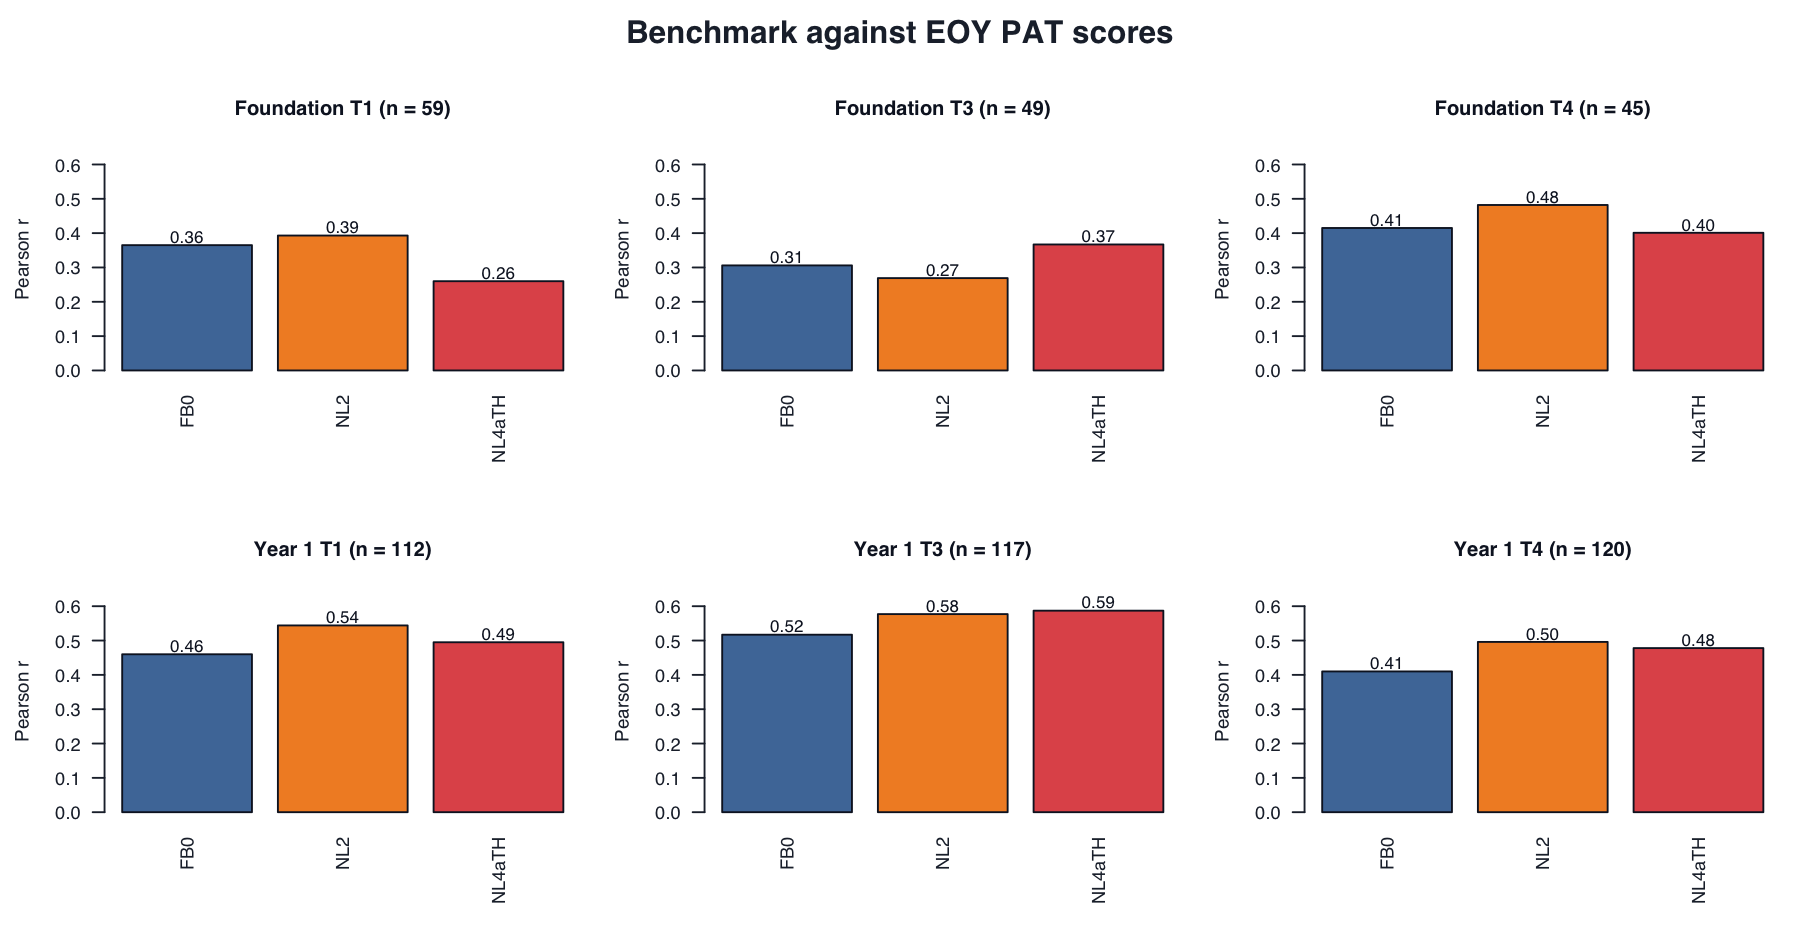
8. External validation
Benchmark against EOY PAT scores
Each row compares a term-specific full-battery variant score with end-of-year PAT scaled score. Entries are Pearson correlations.
| Year | Term | N | Full-battery raw benchmark (FB0) |
Testlet + partial-credit-style ordinal model (NL2) |
Continuous testlet model (NL4aTH) |
|---|---|---|---|---|---|
| Foundation | 1 | 59 | .365 | .393 | .260 |
| Foundation | 3 | 49 | .306 | .269 | .367 |
| Foundation | 4 | 45 | .415 | .482 | .401 |
| Year 1 | 1 | 112 | .460 | .544 | .495 |
| Year 1 | 3 | 117 | .517 | .577 | .587 |
| Year 1 | 4 | 120 | .410 | .496 | .478 |
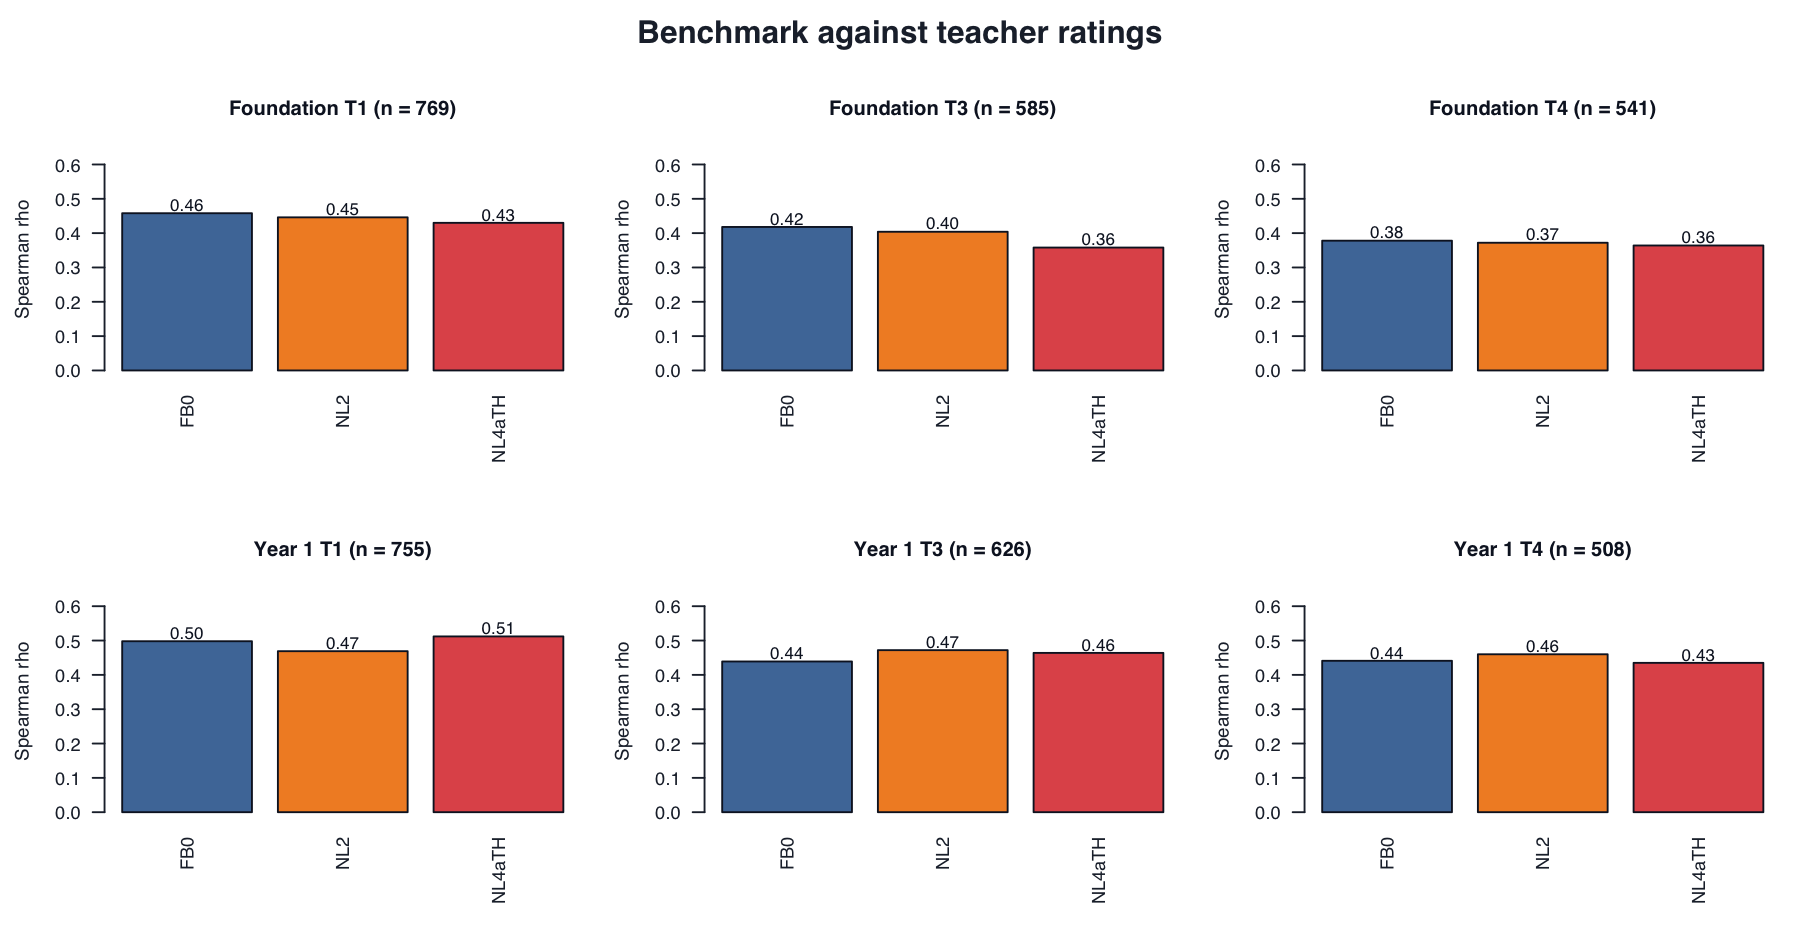
Benchmark against teacher ratings
Each row compares a term-specific full-battery variant score with teacher rating. Entries are Spearman rank correlations because teacher rating is ordinal.
| Year | Term | N | Full-battery raw benchmark (FB0) |
Testlet + partial-credit-style ordinal model (NL2) |
Continuous testlet model (NL4aTH) |
|---|---|---|---|---|---|
| Foundation | 1 | 769 | .458 | .446 | .430 |
| Foundation | 3 | 585 | .418 | .404 | .358 |
| Foundation | 4 | 541 | .378 | .372 | .364 |
| Year 1 | 1 | 755 | .498 | .469 | .512 |
| Year 1 | 3 | 626 | .439 | .472 | .464 |
| Year 1 | 4 | 508 | .441 | .460 | .435 |
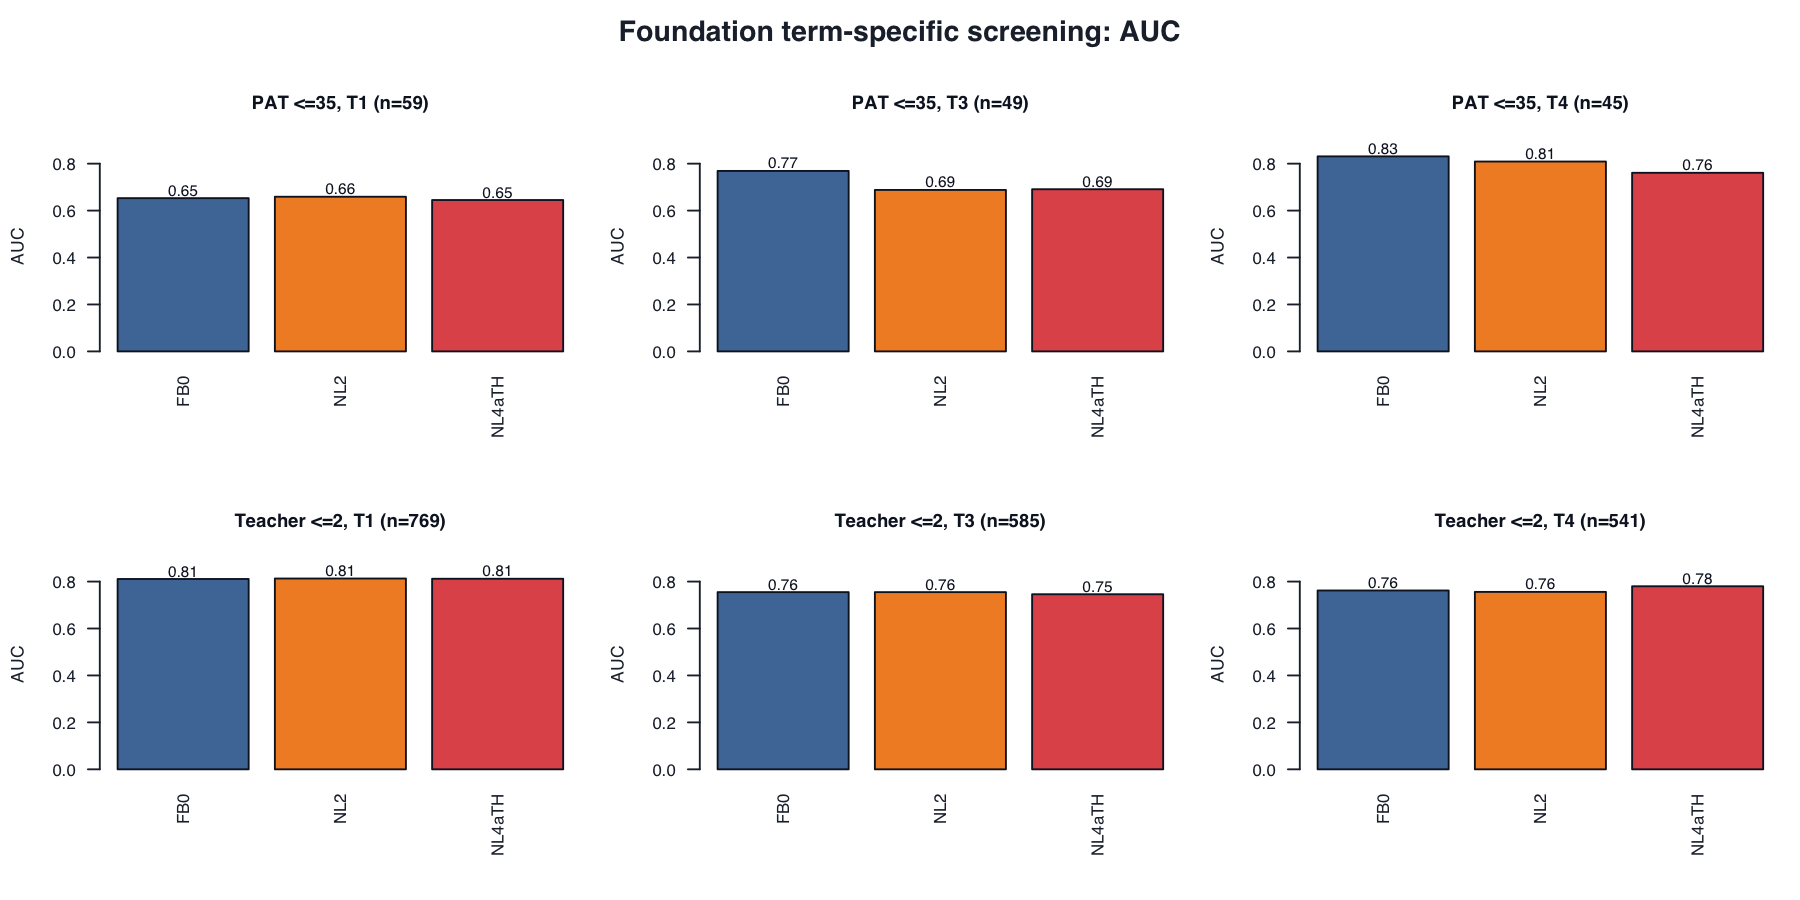
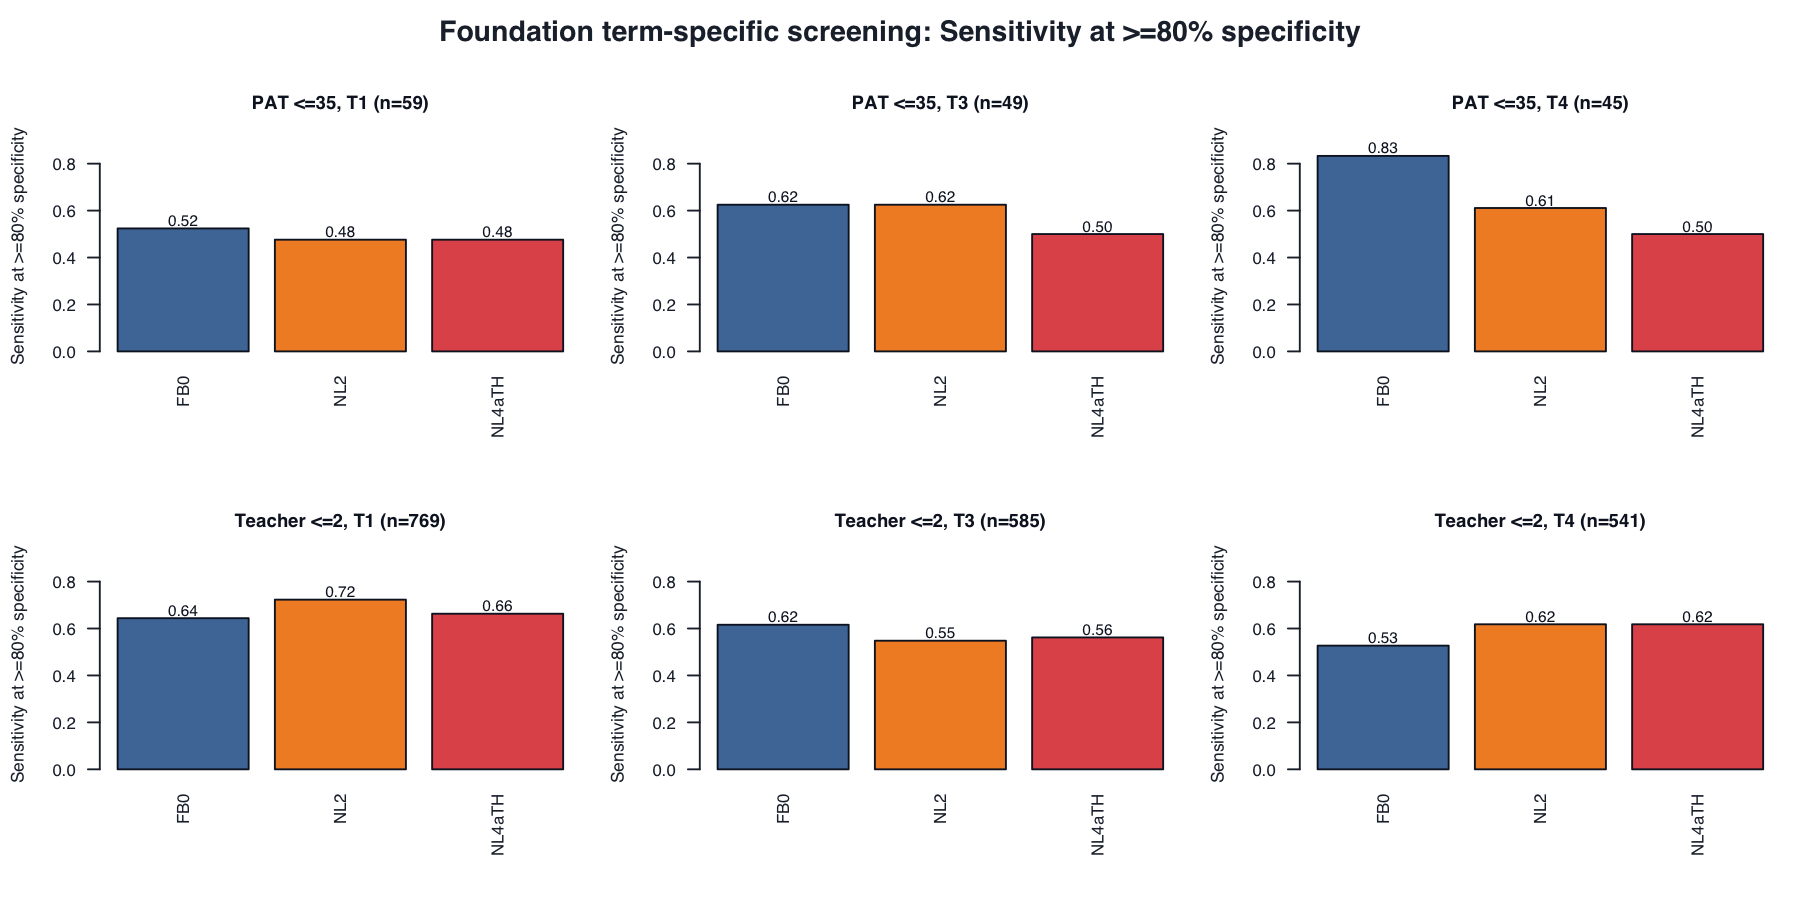
9. Screening classification
For each variant, the external risk label is fixed first: EOY PAT risk means PAT percentile <=35; teacher-rating risk means teacher rating <=2. For each year and term, we then search across possible model-score thresholds and choose the threshold that gives the highest sensitivity while keeping specificity >= .80. In plain terms, among students not labelled at risk by the external anchor, at least 80% must remain unflagged by the model. This is not an 80th-percentile cutoff on PAT or on the model score, and these thresholds are for model comparison only, not operational cut scores.
| Anchor | Term | Variant | N | Risk N | AUC | Sensitivity | False negative rate |
|---|---|---|---|---|---|---|---|
| EOY PAT percentile <=35 | 1 | FB0 |
59 | 21 | .653 | .524 | .476 |
| EOY PAT percentile <=35 | 1 | NL2 |
59 | 21 | .659 | .476 | .524 |
| EOY PAT percentile <=35 | 1 | NL4aTH |
59 | 21 | .645 | .476 | .524 |
| EOY PAT percentile <=35 | 3 | FB0 |
49 | 16 | .769 | .625 | .375 |
| EOY PAT percentile <=35 | 3 | NL2 |
49 | 16 | .688 | .625 | .375 |
| EOY PAT percentile <=35 | 3 | NL4aTH |
49 | 16 | .691 | .500 | .500 |
| EOY PAT percentile <=35 | 4 | FB0 |
45 | 18 | .831 | .833 | .167 |
| EOY PAT percentile <=35 | 4 | NL2 |
45 | 18 | .809 | .611 | .389 |
| EOY PAT percentile <=35 | 4 | NL4aTH |
45 | 18 | .761 | .500 | .500 |
| Teacher rating <=2 | 1 | FB0 |
769 | 101 | .811 | .644 | .356 |
| Teacher rating <=2 | 1 | NL2 |
769 | 101 | .813 | .723 | .277 |
| Teacher rating <=2 | 1 | NL4aTH |
769 | 101 | .812 | .663 | .337 |
| Teacher rating <=2 | 3 | FB0 |
585 | 73 | .755 | .616 | .384 |
| Teacher rating <=2 | 3 | NL2 |
585 | 73 | .755 | .548 | .452 |
| Teacher rating <=2 | 3 | NL4aTH |
585 | 73 | .746 | .562 | .438 |
| Teacher rating <=2 | 4 | FB0 |
541 | 55 | .762 | .527 | .473 |
| Teacher rating <=2 | 4 | NL2 |
541 | 55 | .756 | .618 | .382 |
| Teacher rating <=2 | 4 | NL4aTH |
541 | 55 | .780 | .618 | .382 |
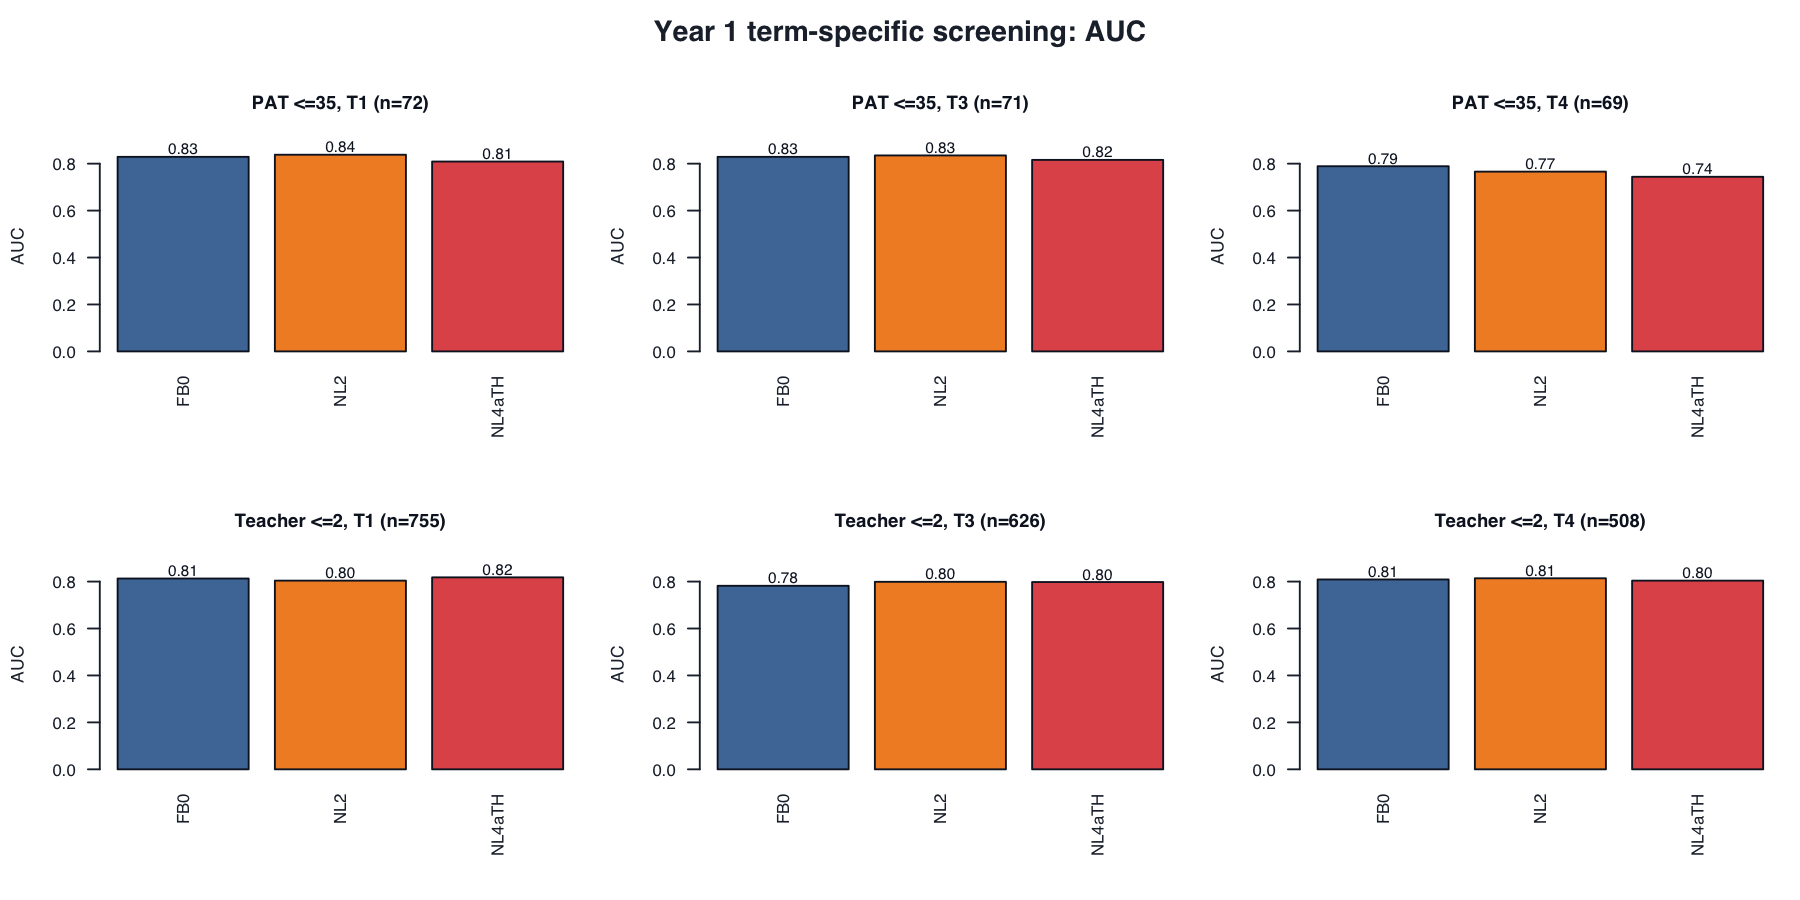
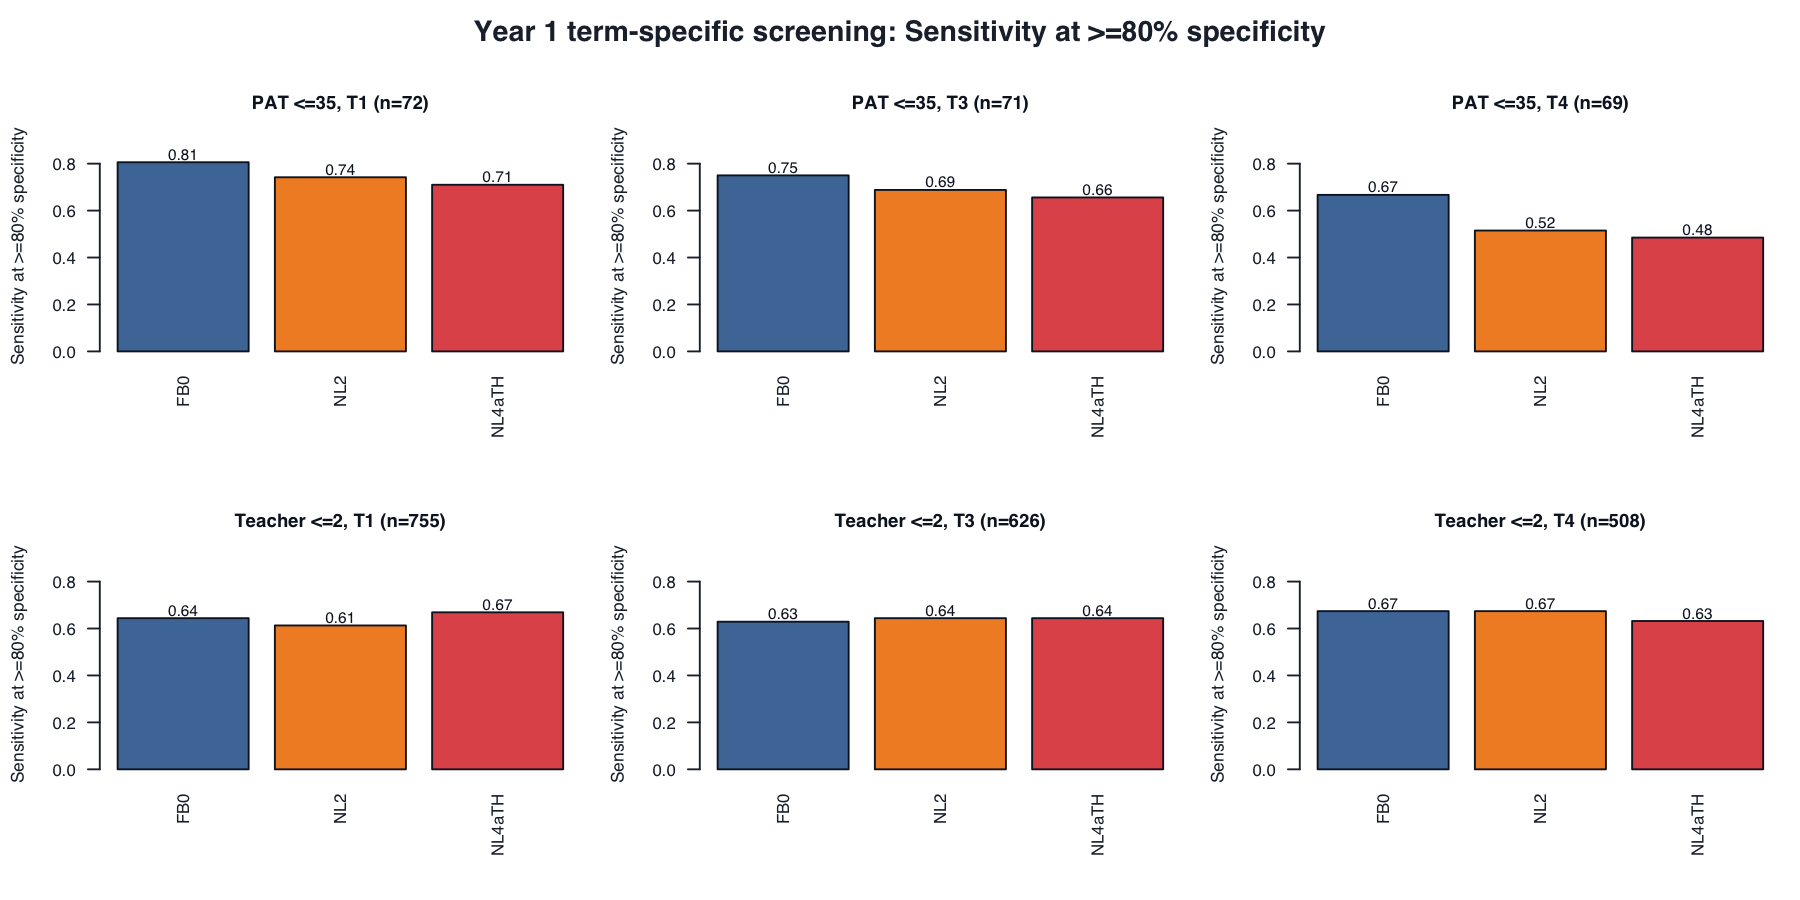
| Anchor | Term | Variant | N | Risk N | AUC | Sensitivity | False negative rate |
|---|---|---|---|---|---|---|---|
| EOY PAT percentile <=35 | 1 | FB0 |
72 | 31 | .829 | .806 | .194 |
| EOY PAT percentile <=35 | 1 | NL2 |
72 | 31 | .838 | .742 | .258 |
| EOY PAT percentile <=35 | 1 | NL4aTH |
72 | 31 | .809 | .710 | .290 |
| EOY PAT percentile <=35 | 3 | FB0 |
71 | 32 | .829 | .750 | .250 |
| EOY PAT percentile <=35 | 3 | NL2 |
71 | 32 | .835 | .688 | .312 |
| EOY PAT percentile <=35 | 3 | NL4aTH |
71 | 32 | .816 | .656 | .344 |
| EOY PAT percentile <=35 | 4 | FB0 |
69 | 33 | .789 | .667 | .333 |
| EOY PAT percentile <=35 | 4 | NL2 |
69 | 33 | .766 | .515 | .485 |
| EOY PAT percentile <=35 | 4 | NL4aTH |
69 | 33 | .744 | .485 | .515 |
| Teacher rating <=2 | 1 | FB0 |
755 | 163 | .813 | .644 | .356 |
| Teacher rating <=2 | 1 | NL2 |
755 | 163 | .804 | .613 | .387 |
| Teacher rating <=2 | 1 | NL4aTH |
755 | 163 | .818 | .669 | .331 |
| Teacher rating <=2 | 3 | FB0 |
626 | 132 | .782 | .629 | .371 |
| Teacher rating <=2 | 3 | NL2 |
626 | 132 | .799 | .644 | .356 |
| Teacher rating <=2 | 3 | NL4aTH |
626 | 132 | .798 | .644 | .356 |
| Teacher rating <=2 | 4 | FB0 |
508 | 95 | .809 | .674 | .326 |
| Teacher rating <=2 | 4 | NL2 |
508 | 95 | .814 | .674 | .326 |
| Teacher rating <=2 | 4 | NL4aTH |
508 | 95 | .804 | .632 | .368 |
10. Model-score precision
The NL2 values are frequentist mirt model-score standard errors; the NL4aTH values are Bayesian posterior theta SDs from Stan. Both describe uncertainty in the estimated latent ability, but they come from different estimation frameworks, so the comparison should be read as approximate model-score precision rather than a single definitive reliability coefficient.
Approximate reliability is computed as:
\[ 1 - \frac{\operatorname{mean}(\text{uncertainty}^2)}{\operatorname{var}(\hat\theta)} \]
where uncertainty is the mirt score SE for NL2 and posterior theta SD for NL4aTH. Higher approximate reliability is better; lower median uncertainty is better.
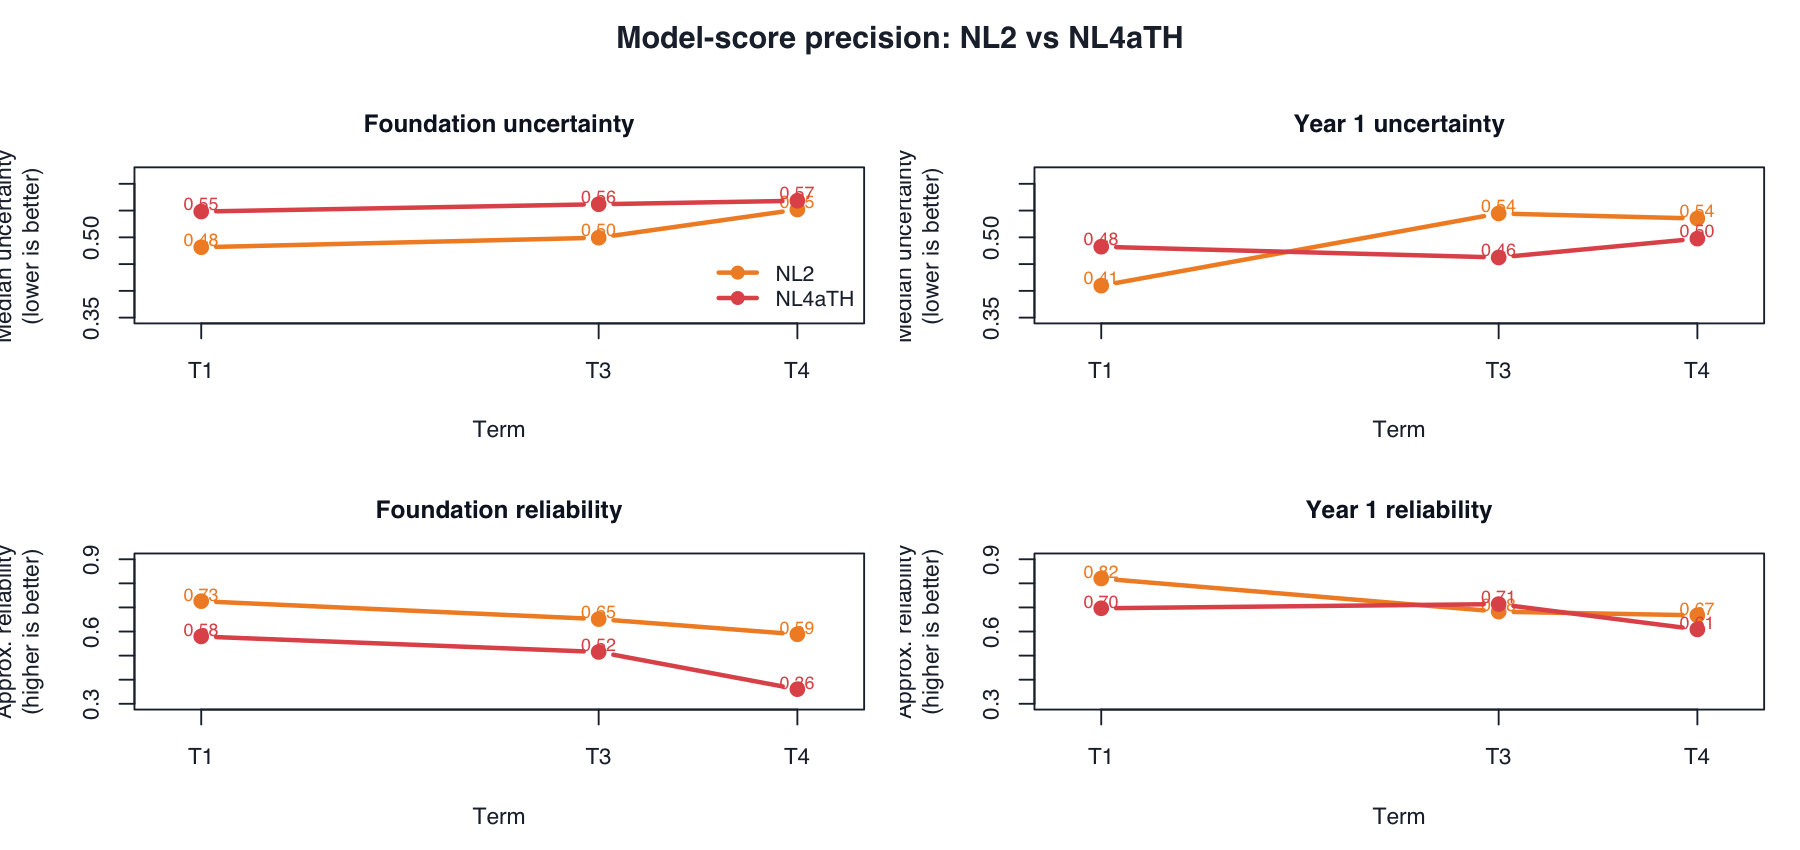
Read: NL2 is generally at least as precise as NL4aTH, except Year 1 Term 3 where the continuous testlet model has slightly lower posterior uncertainty and a slightly higher approximate reliability index.
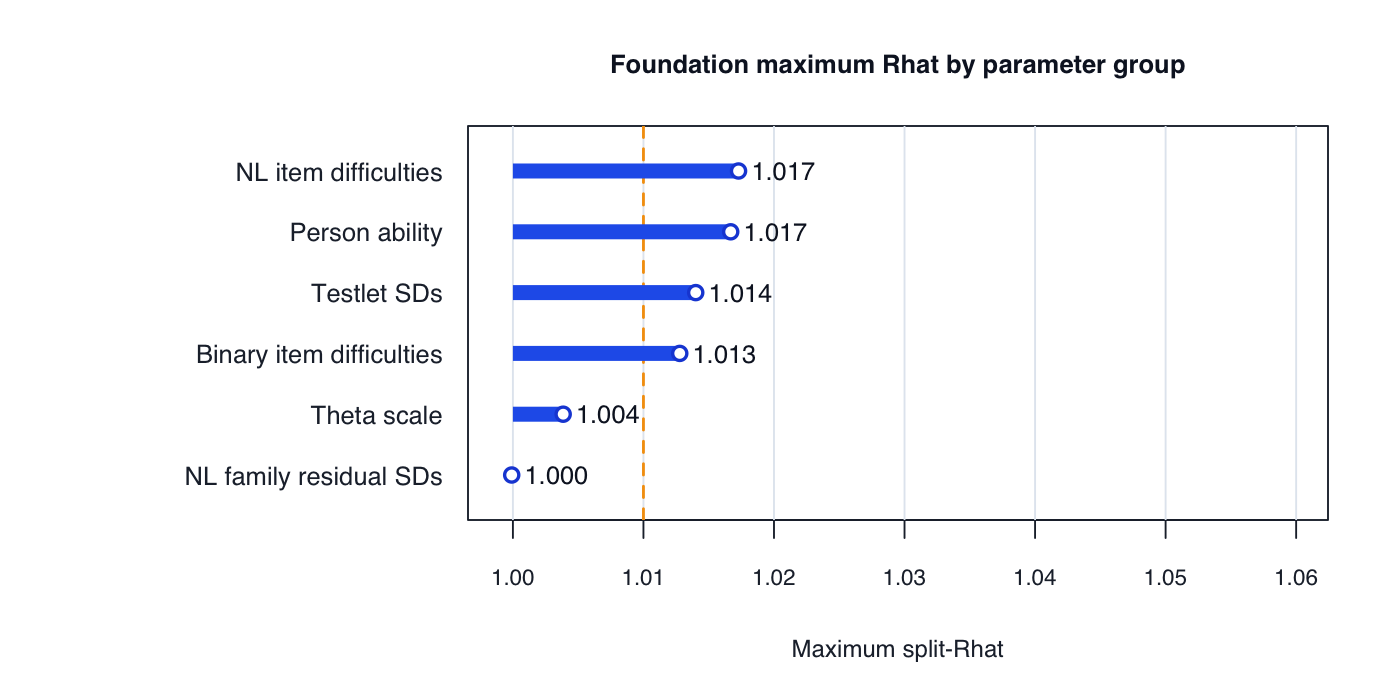
11. Technical diagnostics and model-detail panel
In this section, person counts are person-administrations. Diagnostic fields differ by variant: FB0 is a computed benchmark, NL2 is a frequentist mirt fit, and NL4aTH is a Stan fit.
Foundation
Full-battery raw accuracy benchmark (FB0)
| Diagnostic | Foundation |
|---|---|
| Person-administrations | 5,065 |
| Median eligible items | 71–80 across terms |
| Response used | Raw accuracy across eligible maths items/subtests |
| Model fit | None; computed benchmark |
Testlet + partial-credit-style ordinal model (NL2)
| Diagnostic | Foundation |
|---|---|
| Person-administrations | 5,065 |
| Items in embedded run | 397 |
| Binary non-Number-Line items | 317 |
| Number Line ordinal items | 80 |
| Testlets | 18 |
| Estimated parameters | 637 |
| Median ability SE | .500 |
| Fit status | Converged |
Continuous testlet model (NL4aTH)
| Diagnostic | Foundation |
|---|---|
| Person-administrations | 5,065 |
| Binary non-Number-Line observations | 281,195 |
| Number Line observations | 87,313 |
| Items in Stan run | 479 |
| Testlets | 18 |
| Chains | 2 |
| Warmup / sample | 800 / 800 |
| Runtime | 6.66 hours |
| Divergences | 0 |
| Treedepth hits | 0 |
| E-BFMI | .854 |
| Max Rhat | 1.014 |
| Min bulk ESS | 155 |
Year 1
Full-battery raw accuracy benchmark (FB0)
| Diagnostic | Year 1 |
|---|---|
| Person-administrations | 5,015 |
| Median eligible items | 80–111 across terms |
| Response used | Raw accuracy across eligible maths items/subtests |
| Model fit | None; computed benchmark |
Testlet + partial-credit-style ordinal model (NL2)
| Diagnostic | Year 1 |
|---|---|
| Person-administrations | 5,015 |
| Items in embedded run | 479 |
| Binary non-Number-Line items | 345 |
| Number Line ordinal items | 134 |
| Testlets | 18 |
| Estimated parameters | 881 |
| Median ability SE | .469 |
| Fit status | Converged |
Continuous testlet model (NL4aTH)
| Diagnostic | Year 1 |
|---|---|
| Person-administrations | 5,015 |
| Binary non-Number-Line observations | 327,135 |
| Number Line observations | 154,422 |
| Items in Stan run | 560 |
| Testlets | 18 |
| Chains | 2 |
| Warmup / sample | 800 / 800 |
| Runtime | 15.64 hours |
| Divergences | 0 |
| Treedepth hits | 0 |
| E-BFMI | .941 |
| Max Rhat | 1.045 |
| Min bulk ESS | 27.5 |
12. Subgroup movement
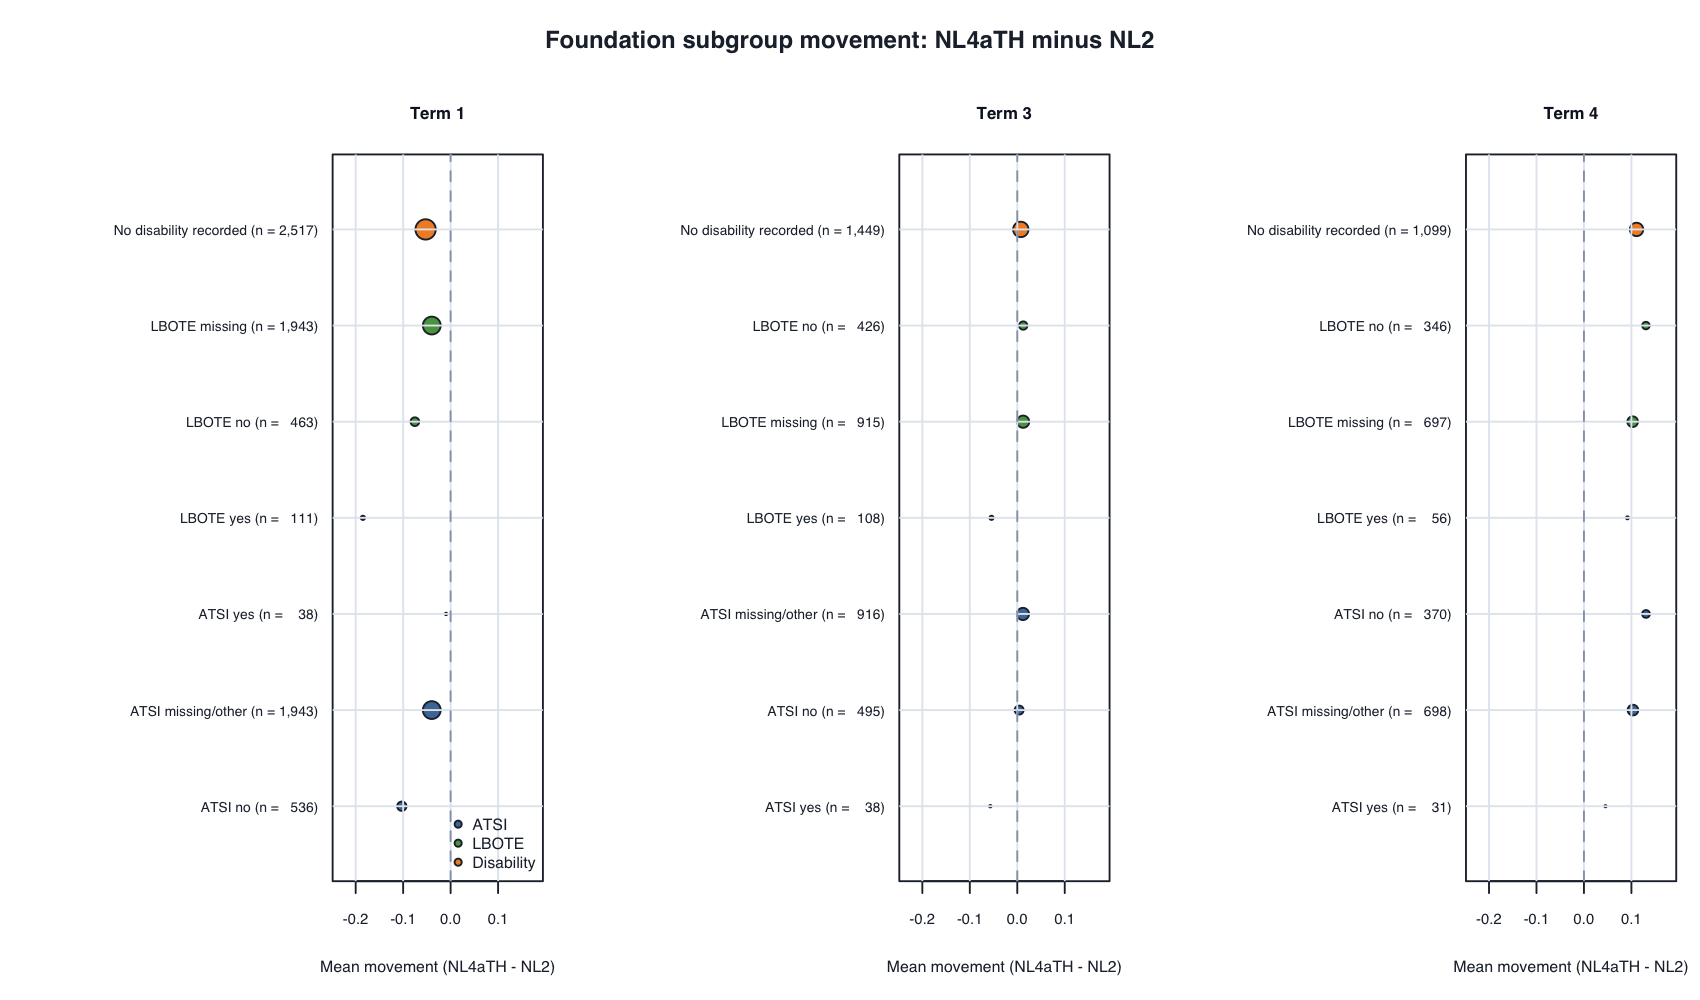
Initial read: most movement is not obviously alarming, but some subgroup/term cells, especially LBOTE yes in Term 1, show larger movement and should be reviewed cautiously given metadata missingness.
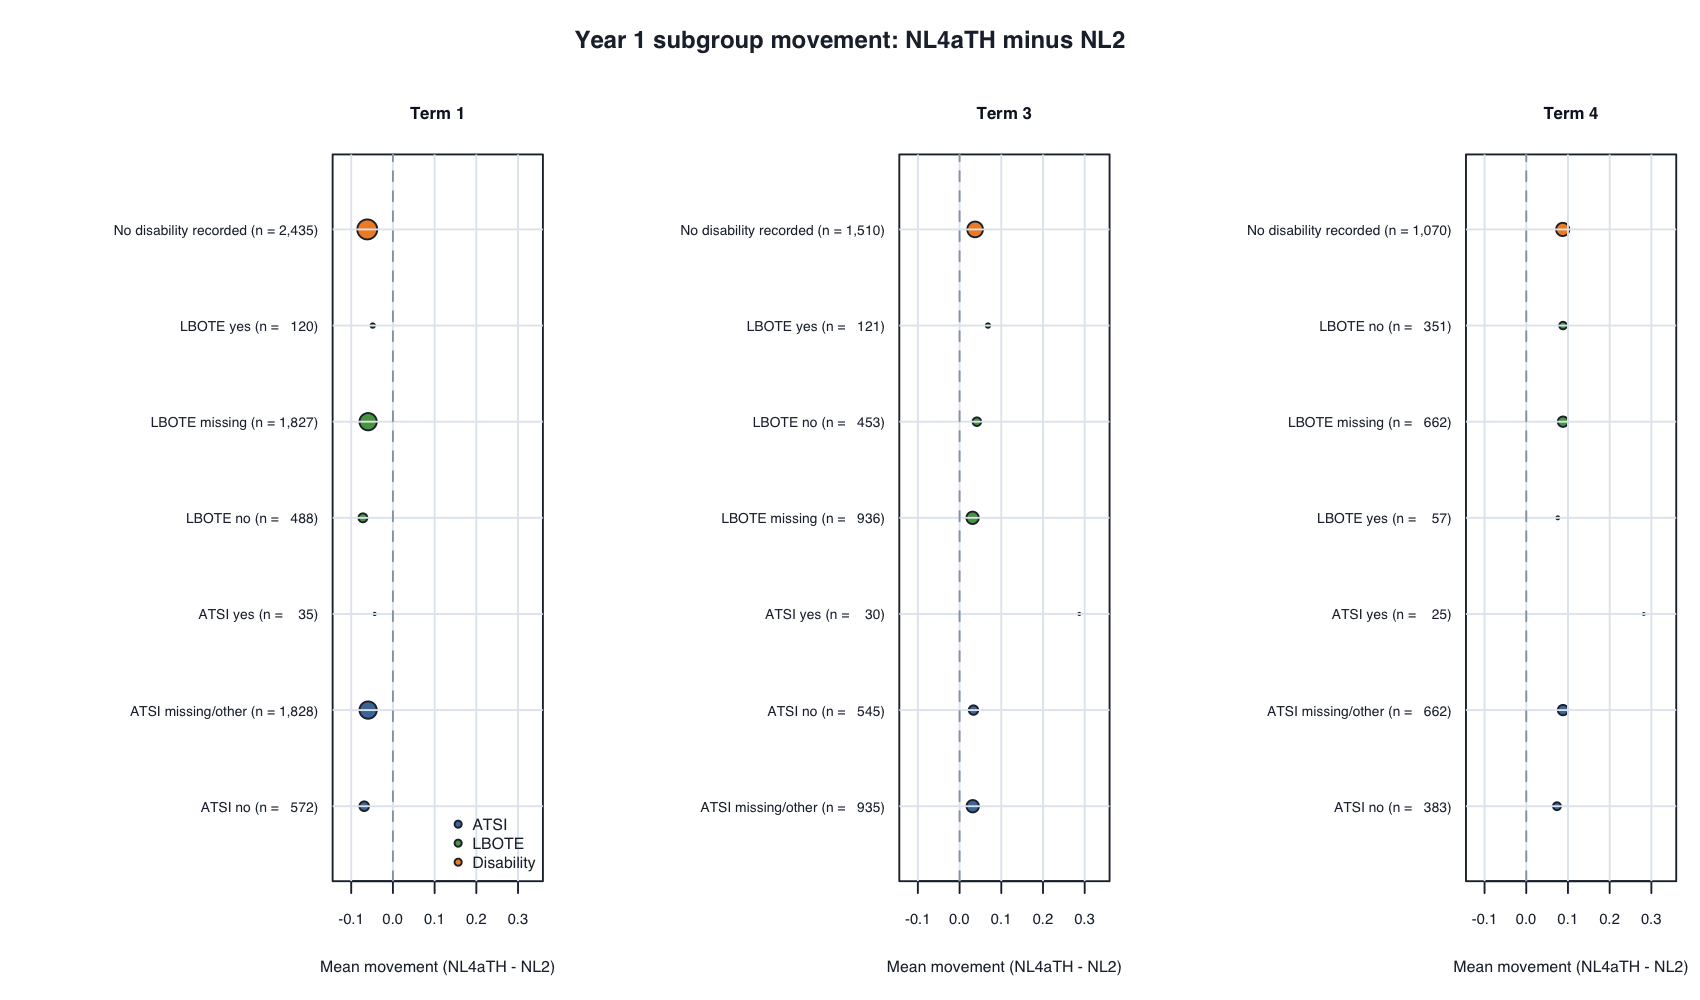
Initial read: Year 1 subgroup movement follows a similar pattern to Foundation, with most groups close to zero on average and small groups suppressed. Review LBOTE yes cells with caution because of metadata missingness.
13. Summary
| Year | Model | Technical / precision | External validation | Screening classification | Overall read |
|---|---|---|---|---|---|
| Foundation | Testlet + partial-credit-style ordinal model (NL2) |
Converged; median SE about .48–.55 across terms; approximate reliability .59–.73. | Strongest EOY PAT correlation in Terms 1 and 4; weaker in Term 3. Teacher-rating correlations are close to NL4aTH. |
PAT <=35 screening is mixed; teacher-risk screening is competitive. | Remains the preferred operational-compatible model. |
| Foundation | Continuous testlet model (NL4aTH) |
Stan fit is technically viable; no divergences or treedepth hits; median posterior SD about .55–.57; approximate reliability .36–.58. | Strongest EOY PAT correlation in Term 3 only; otherwise does not improve on NL2. |
Does not improve PAT <=35 screening; teacher-risk screening is similar to NL2. |
Viable research challenger, but no Foundation replacement case. |
| Year 1 | Testlet + partial-credit-style ordinal model (NL2) |
Converged; median SE about .41–.55 across terms; approximate reliability .67–.82. | Strongest or near-strongest EOY PAT correlation in Terms 1 and 4; close to NL4aTH in Term 3. Teacher-rating correlations are strongest in Terms 3 and 4. |
Strong PAT <=35 AUC in Terms 1 and 3; teacher-risk screening is competitive. | Still the most defensible operational-compatible target. |
| Year 1 | Continuous testlet model (NL4aTH) |
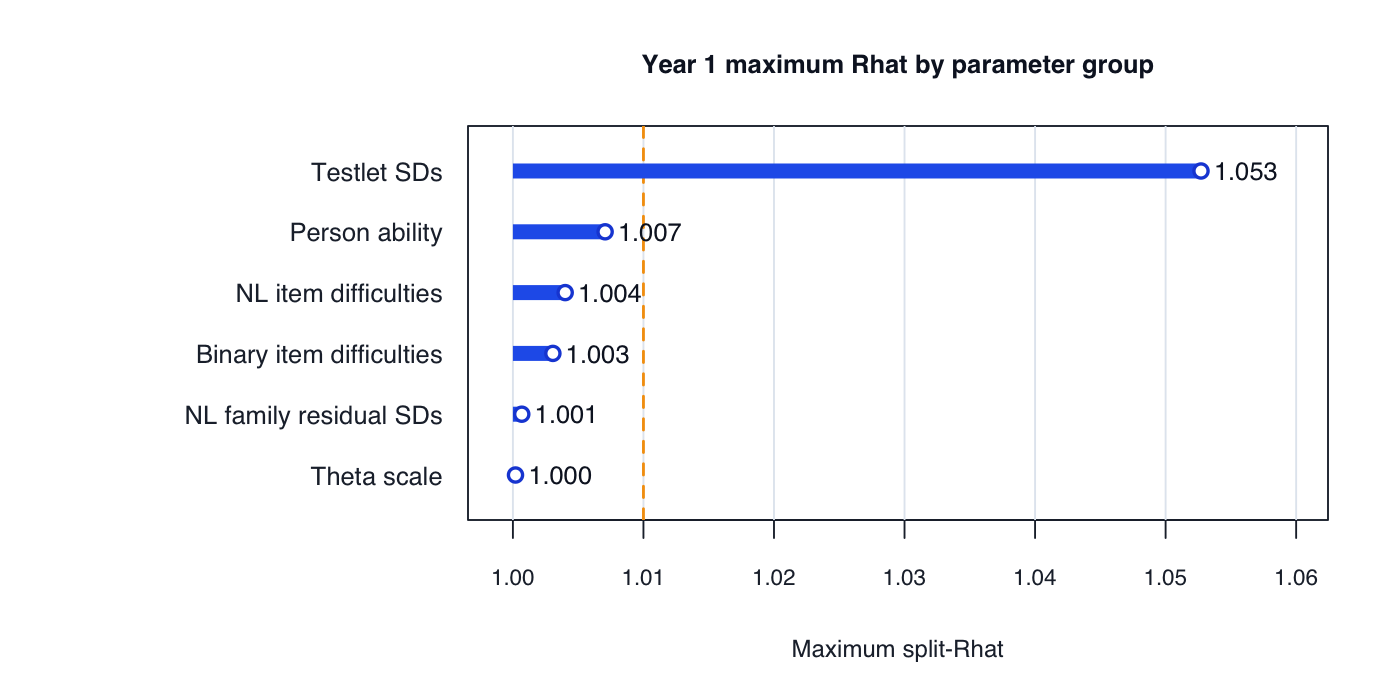
Stan fit is technically viable; weak mixing is localised to testlet SDs; median posterior SD about .46–.50; approximate reliability .61–.71. | Strongest EOY PAT correlation in Term 3, but not Terms 1 or 4. Teacher-rating correlation is strongest in Term 1 only. | Slightly stronger teacher-risk AUC in Term 1 and equal sensitivity in Term 3; PAT <=35 sensitivity is not consistently better than NL2. |
Credible research challenger, but gains are term- and anchor-specific. |
Overall, the continuous testlet model (NL4aTH) is technically credible and informative, but it does not consistently outperform the testlet + partial-credit-style ordinal model (NL2) across validation, screening, precision, movement, subgroup movement, and operational burden. The evidence supports retaining NL2 as the operational-compatible target while keeping NL4aTH as a research challenger.