Warning: There was 1 warning in `summarise()`.
ℹ In argument: `test_result = list(...)`.
ℹ In group 1: `term = 1`.
Caused by warning:
! `cur_data()` was deprecated in dplyr 1.1.0.
ℹ Please use `pick()` instead.Match Quantity - 2025
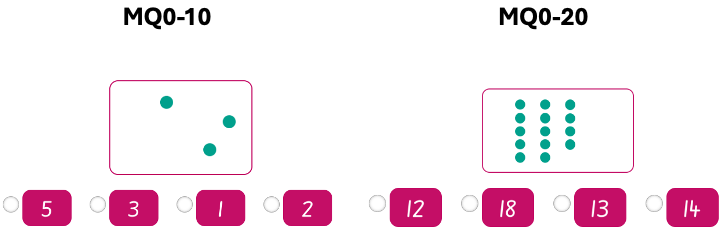
1. Probe description
The Match Quantity probe is a timed screening of students’ ability to match quantity representations to numbers.
In 2025 there are two main forms used in the Foundation screening:
- Match Quantity 1 to 10 (MQ1-10)
- Match Quantity 1 to 20 (MQ1-20)
Both forms use the same interaction style at BOY (Term 1), MOY (Term 3), and EOY (Term 4).
Example
2. Overview of test results
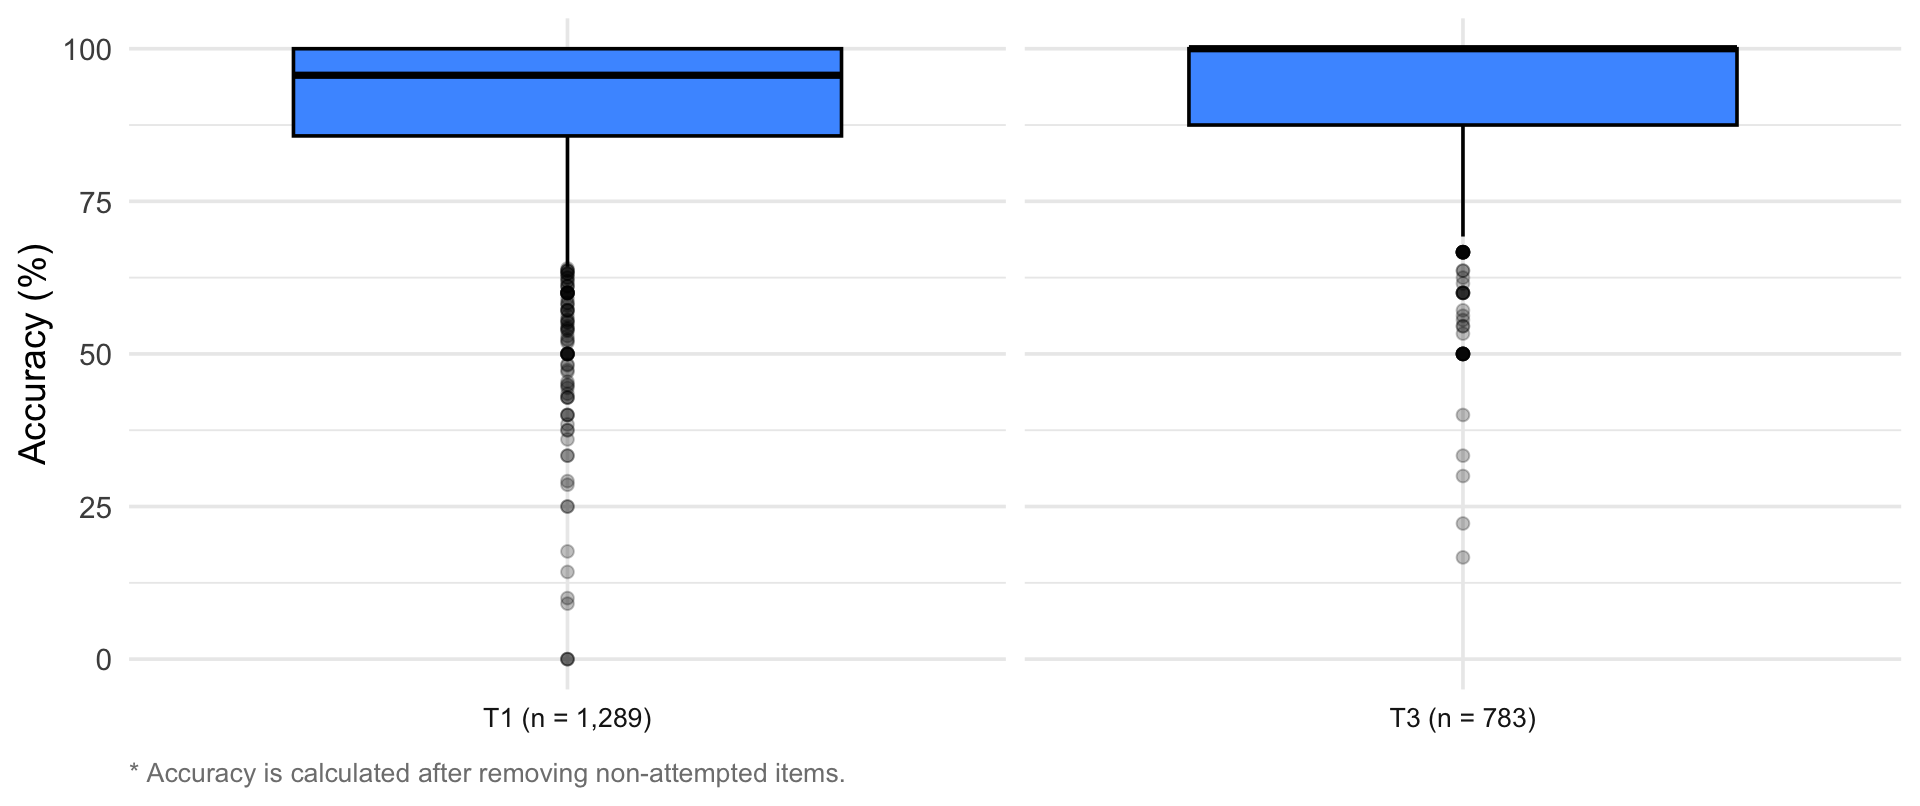
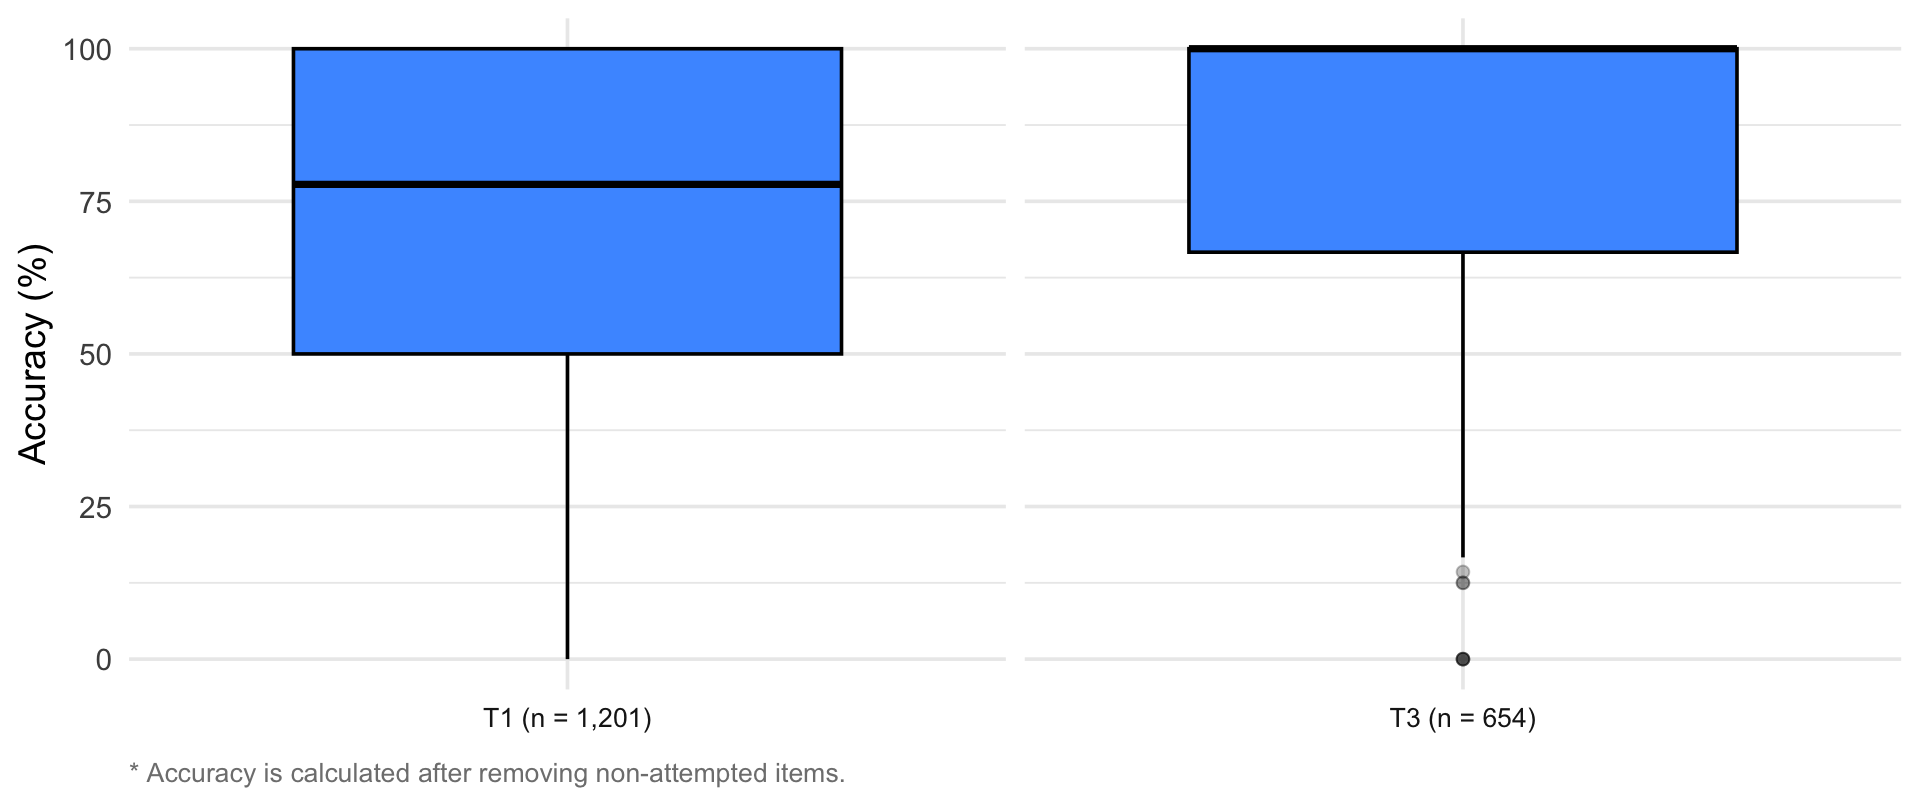
| Term | Test name | Test ID | Students | Median items attempted | Median accuracy (%)* | Median correct / min |
|---|---|---|---|---|---|---|
| 1 | Match Quantity 1-10 | MQ1-10_2025 | 1288 | 14/30 | 95.6 | 7.07 |
| 1 | Match Quantity 1-20 | MQ1-20_2025 | 1201 | 7/30 | 77.8 | 3.13 |
| 3 | Match Quantity 1-10 | MQ1-10_2025 | 783 | 8/30 | 100.0 | 8.42 |
| 3 | Match Quantity 1-20 | MQ1-20_2025 | 652 | 5/30 | 100.0 | 4.62 |
| 4 | Match Quantity 1-10 | MQ1-10_2025 | 565 | 9/30 | 100.0 | 9.60 |
| 4 | Match Quantity 1-20 | MQ1-20_2025 | 525 | 5/30 | 100.0 | 5.11 |
| * Accuracy is calculated after removing non-attempted items. |
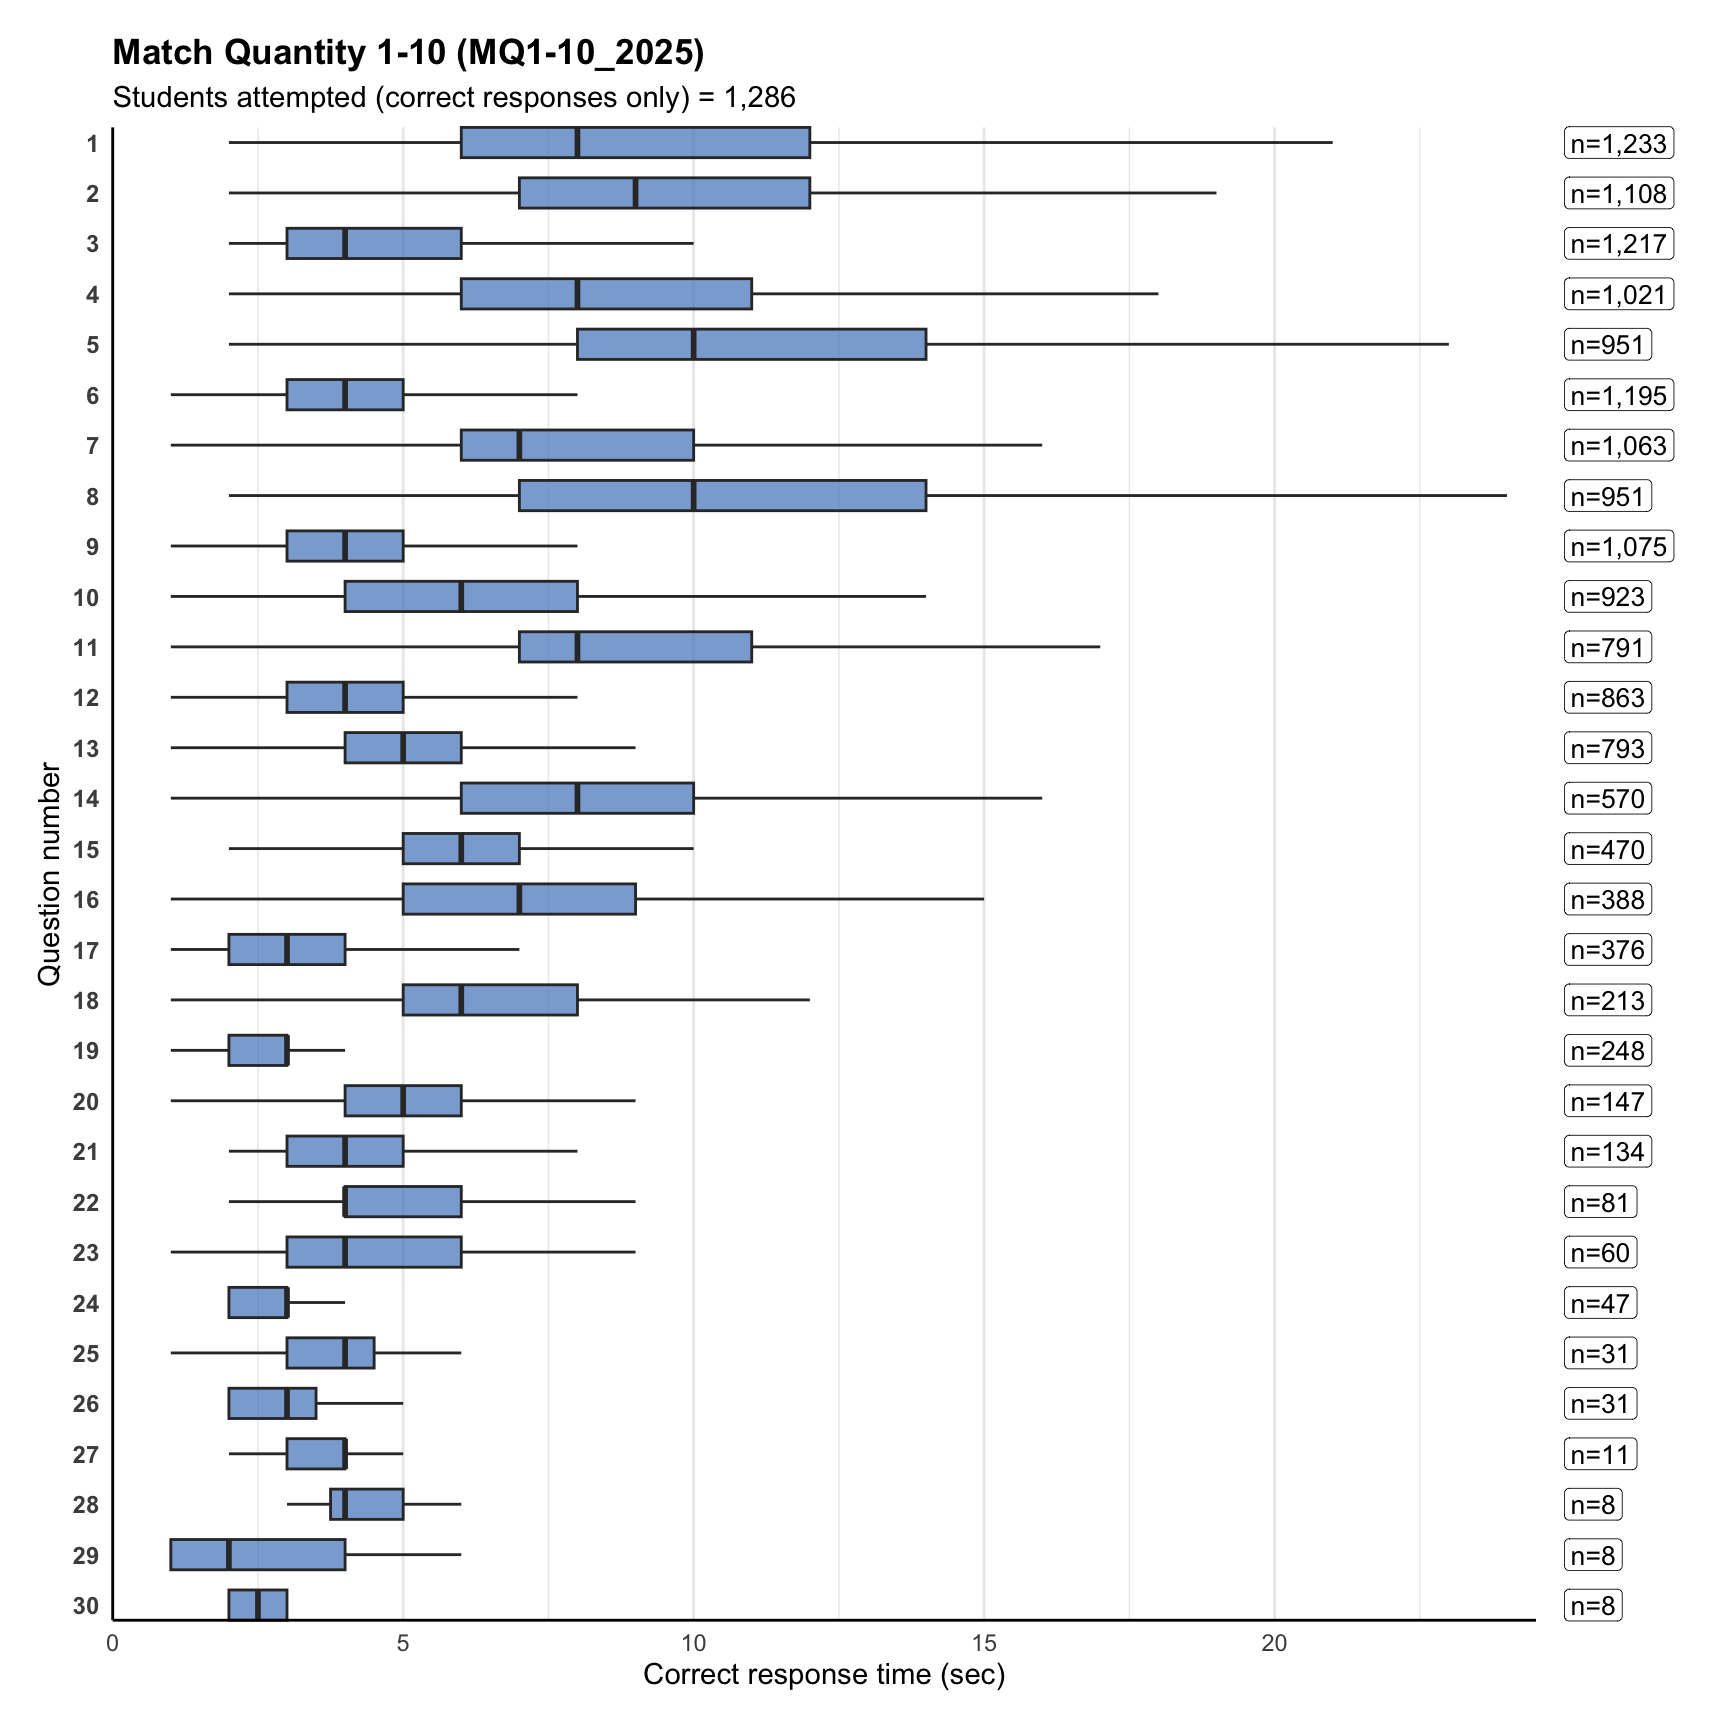
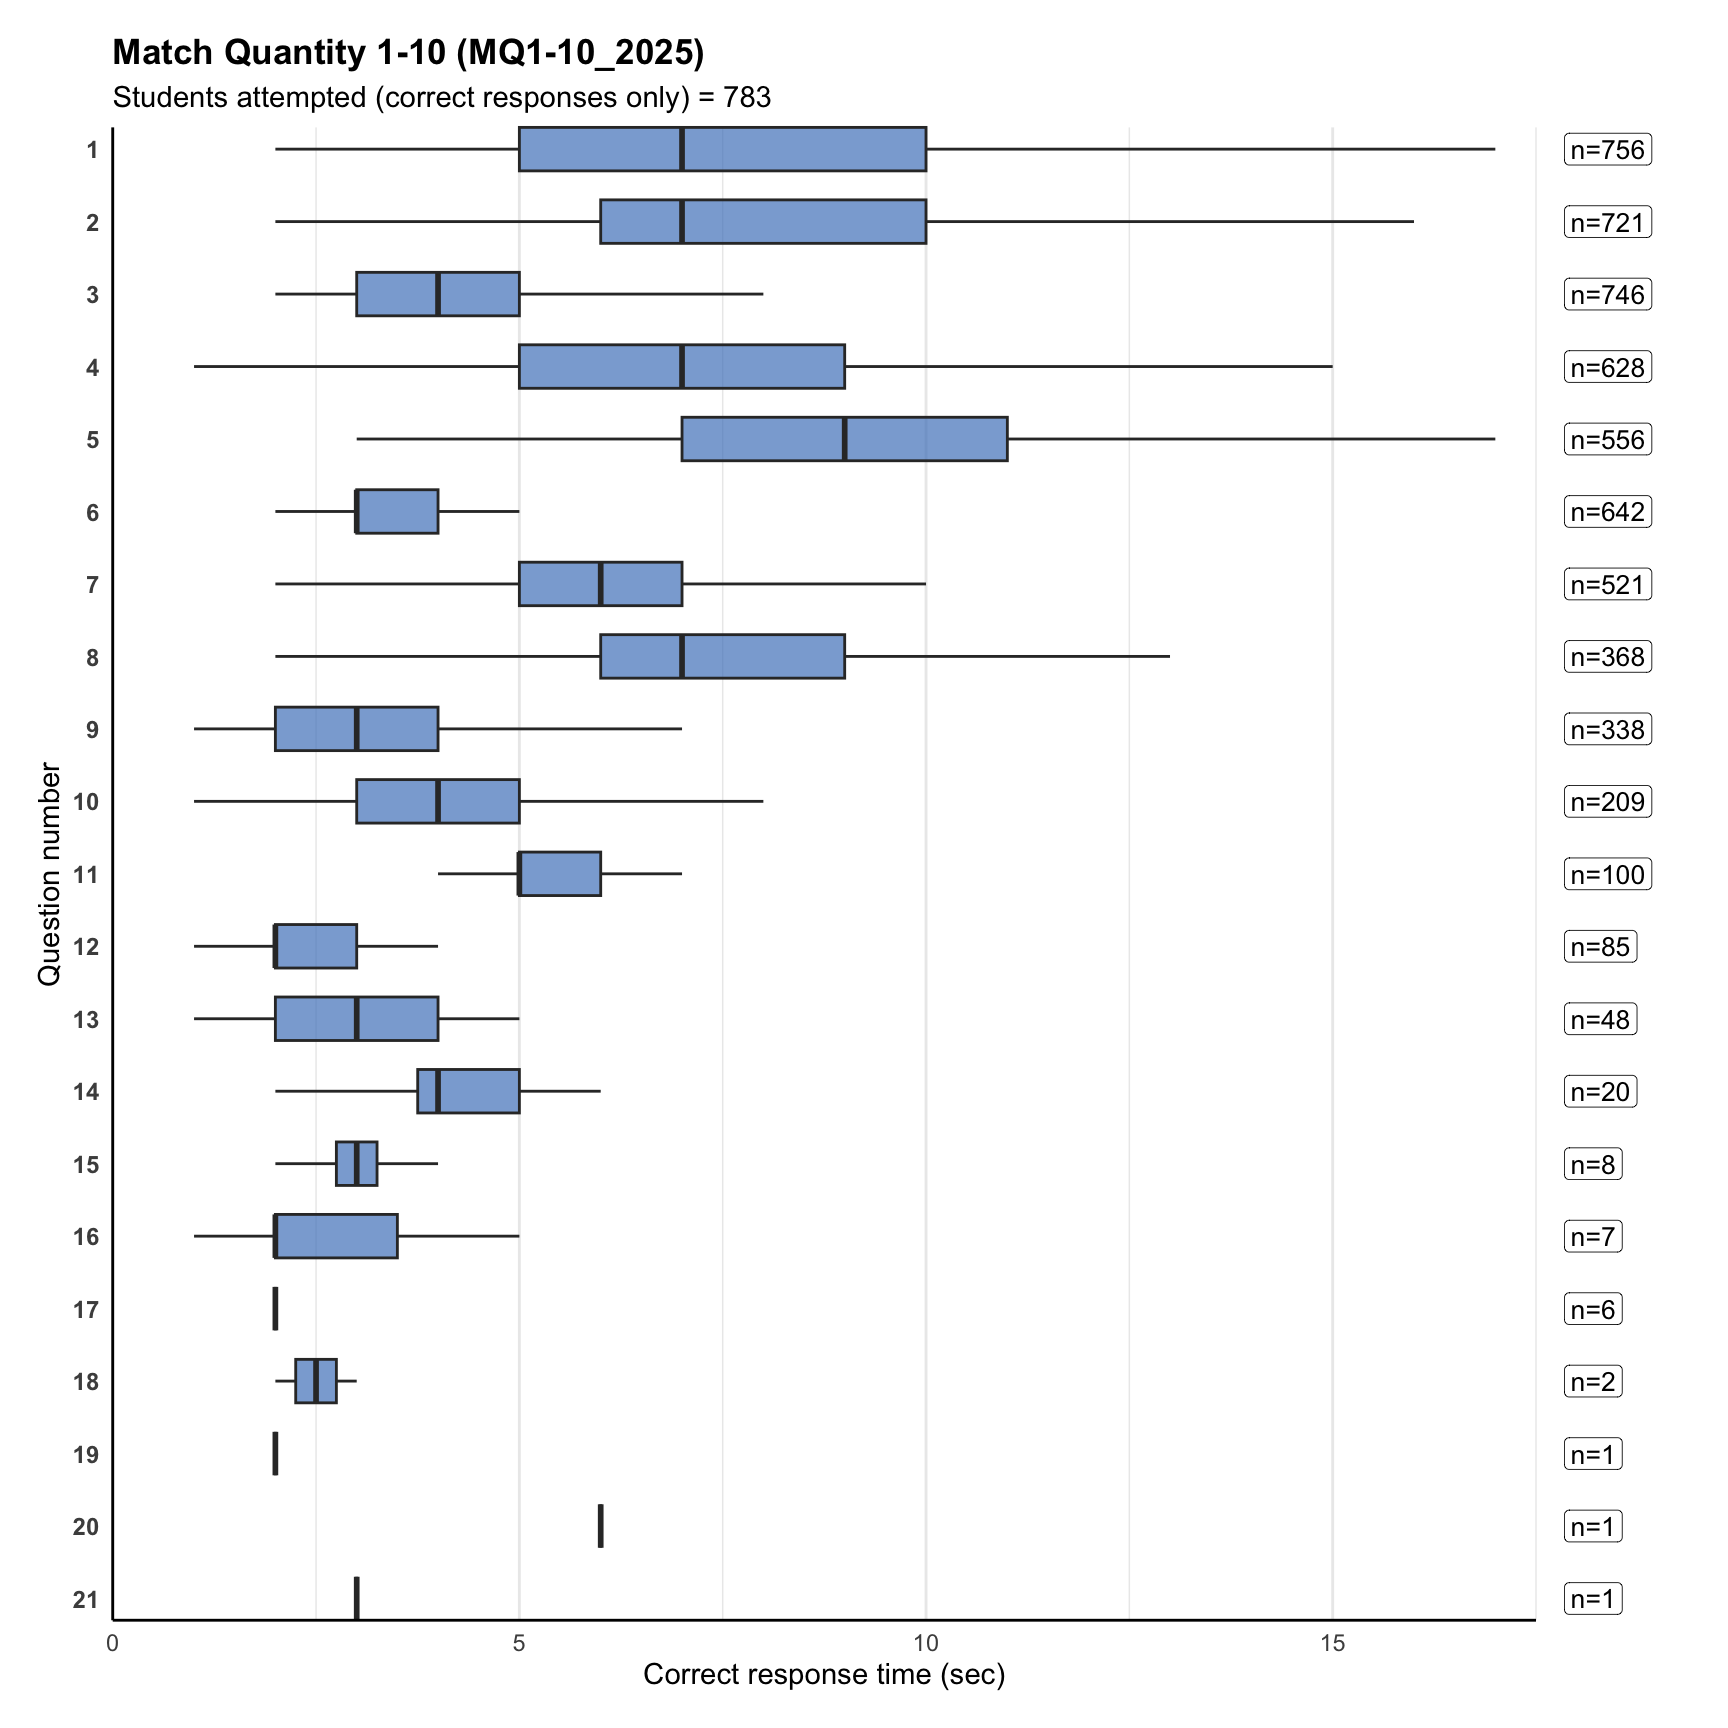
3. Accuracy distribution
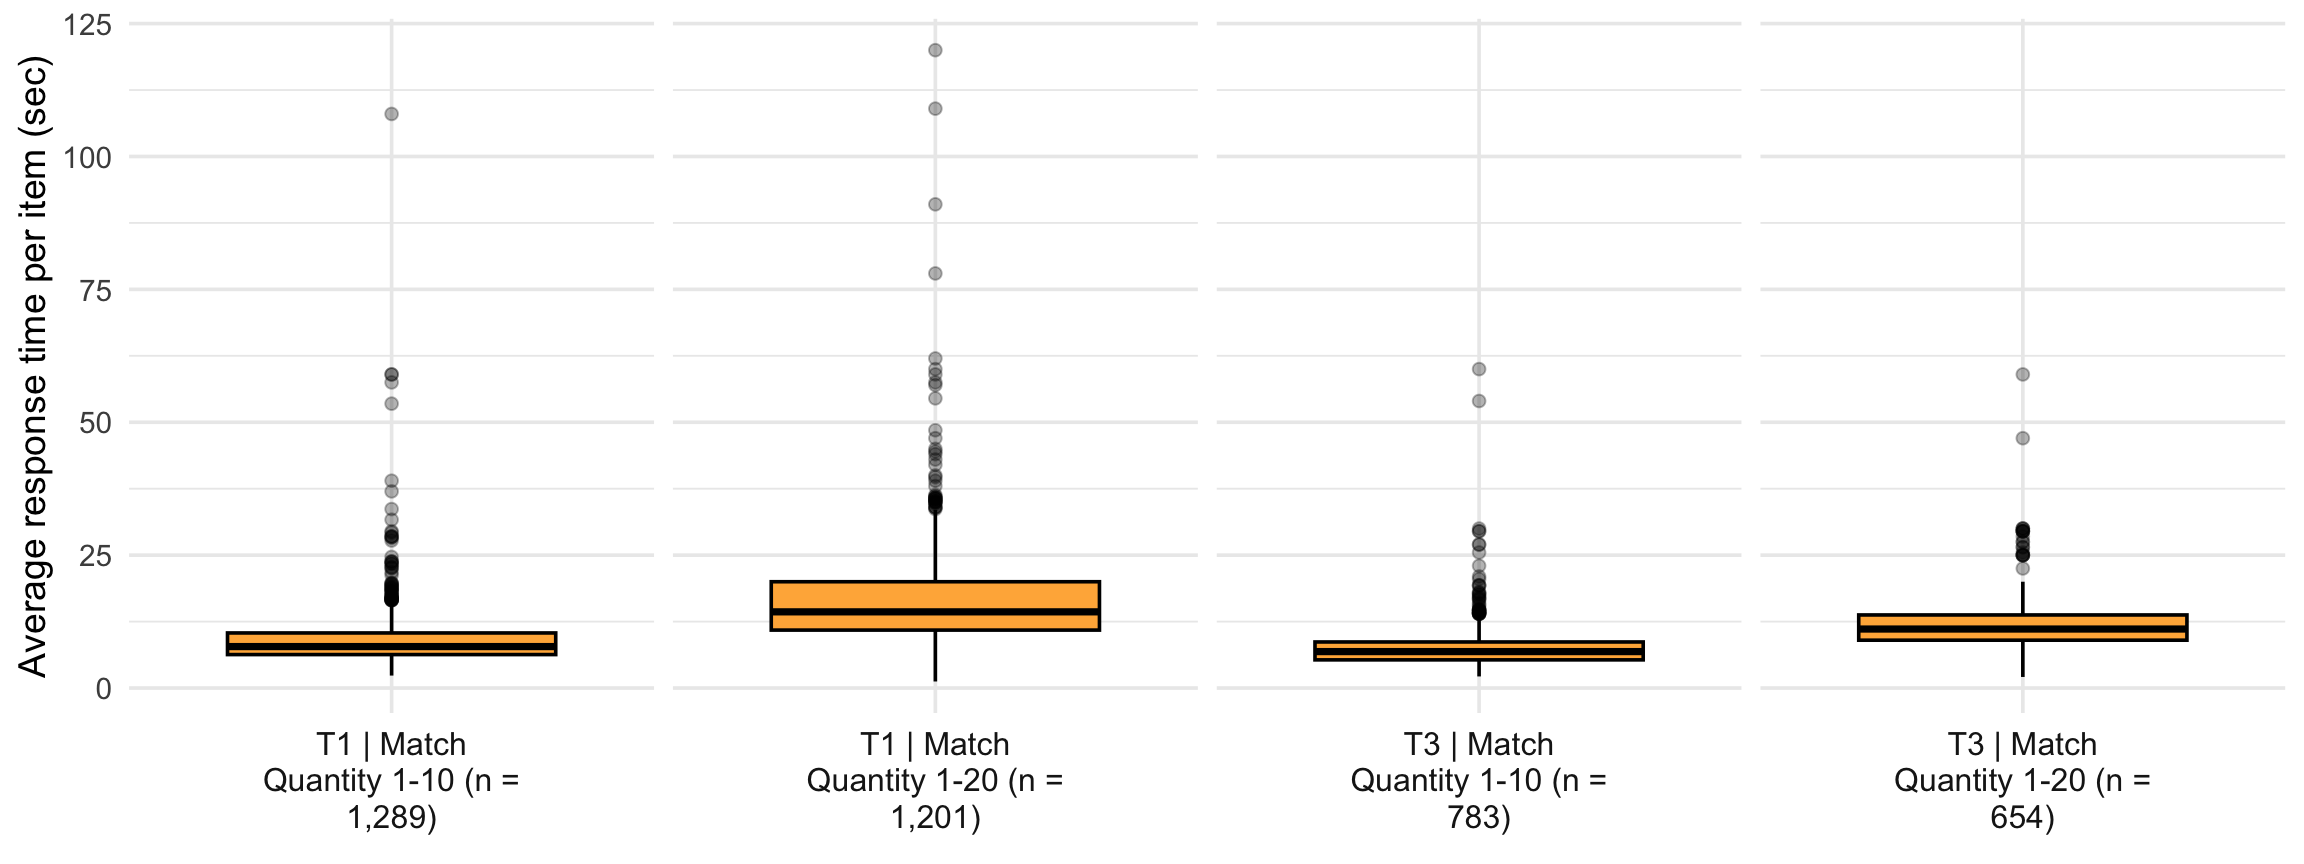
4. Response time distribution
Warning: Removed 247 rows containing non-finite outside the scale range
(`stat_ydensity()`).
Warning: Removed 247 rows containing non-finite outside the scale range
(`stat_boxplot()`).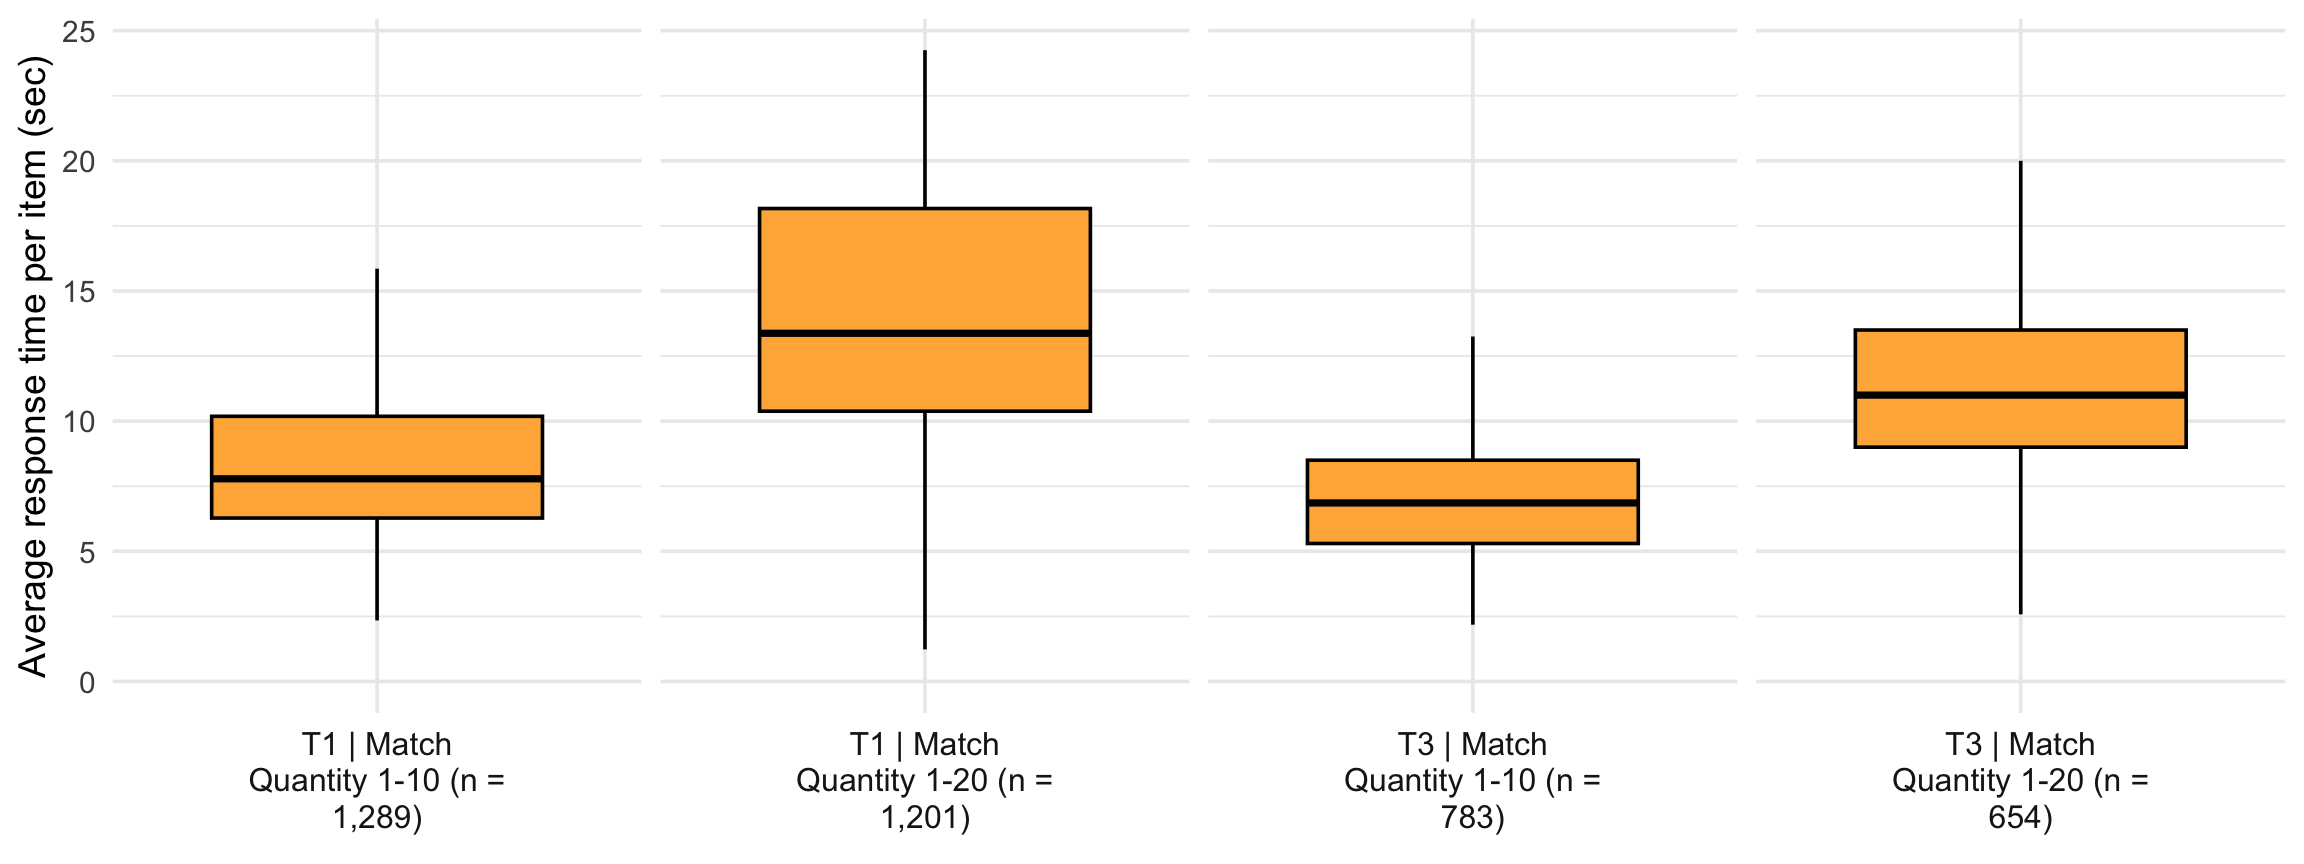
5. Fluency distribution
Fluency distribution
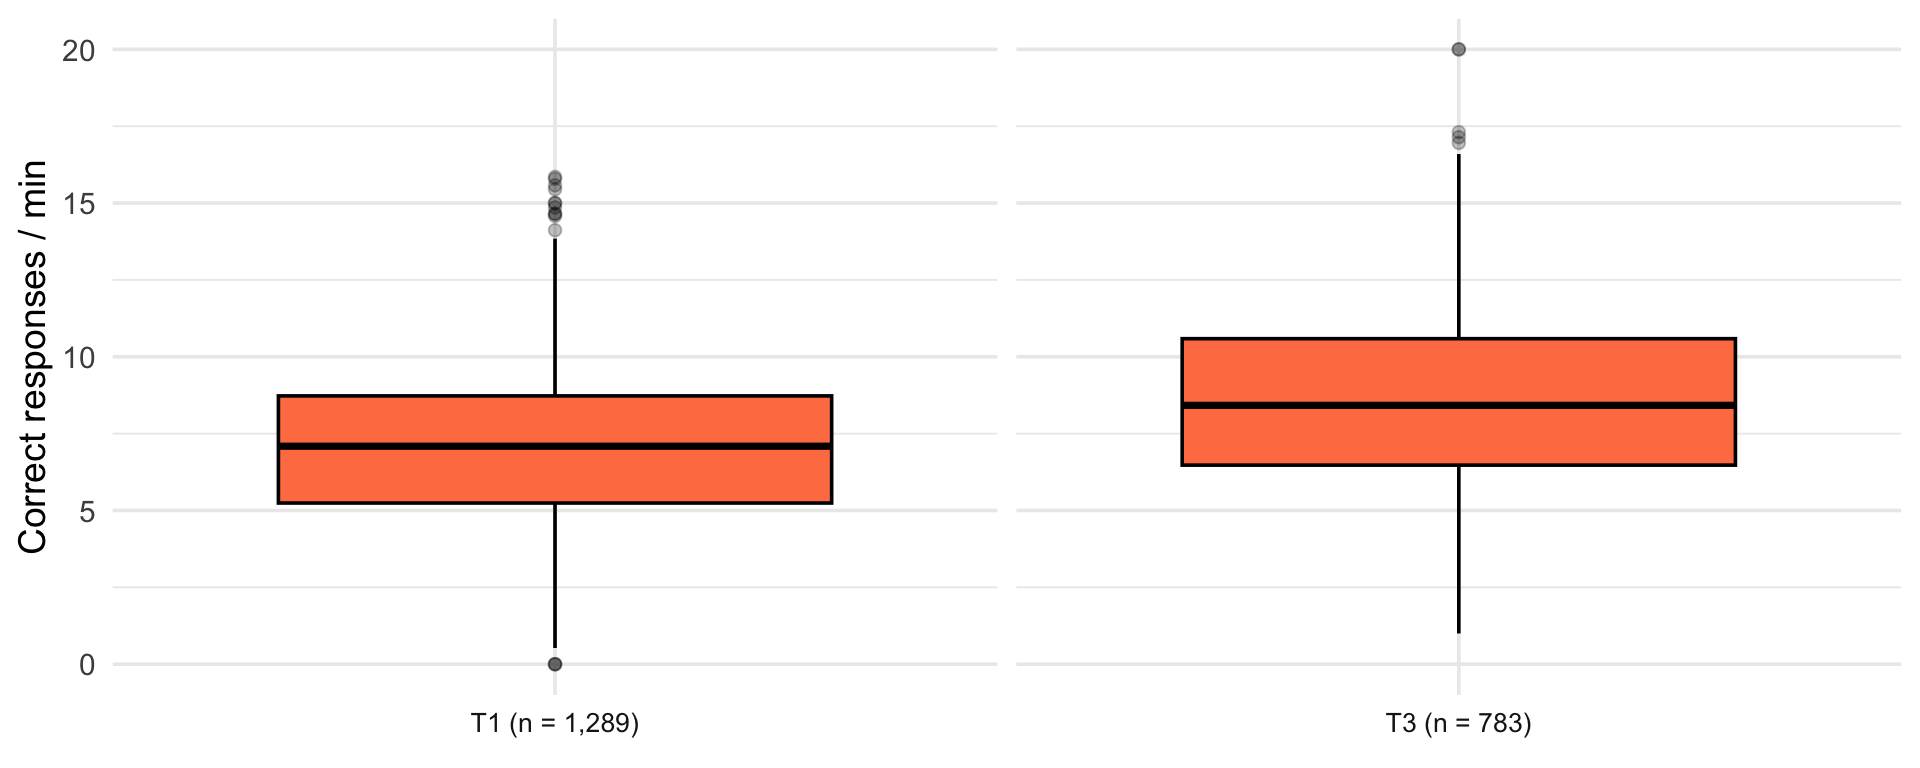
| Term | Students | 25th percentile | Median | 75th percentile |
|---|---|---|---|---|
| Term 1 | 1288 | 5.24 | 7.07 | 8.73 |
| Term 3 | 783 | 6.48 | 8.42 | 10.59 |
| Term 4 | 565 | 7.64 | 9.60 | 11.76 |
Bottom quartile vs rest
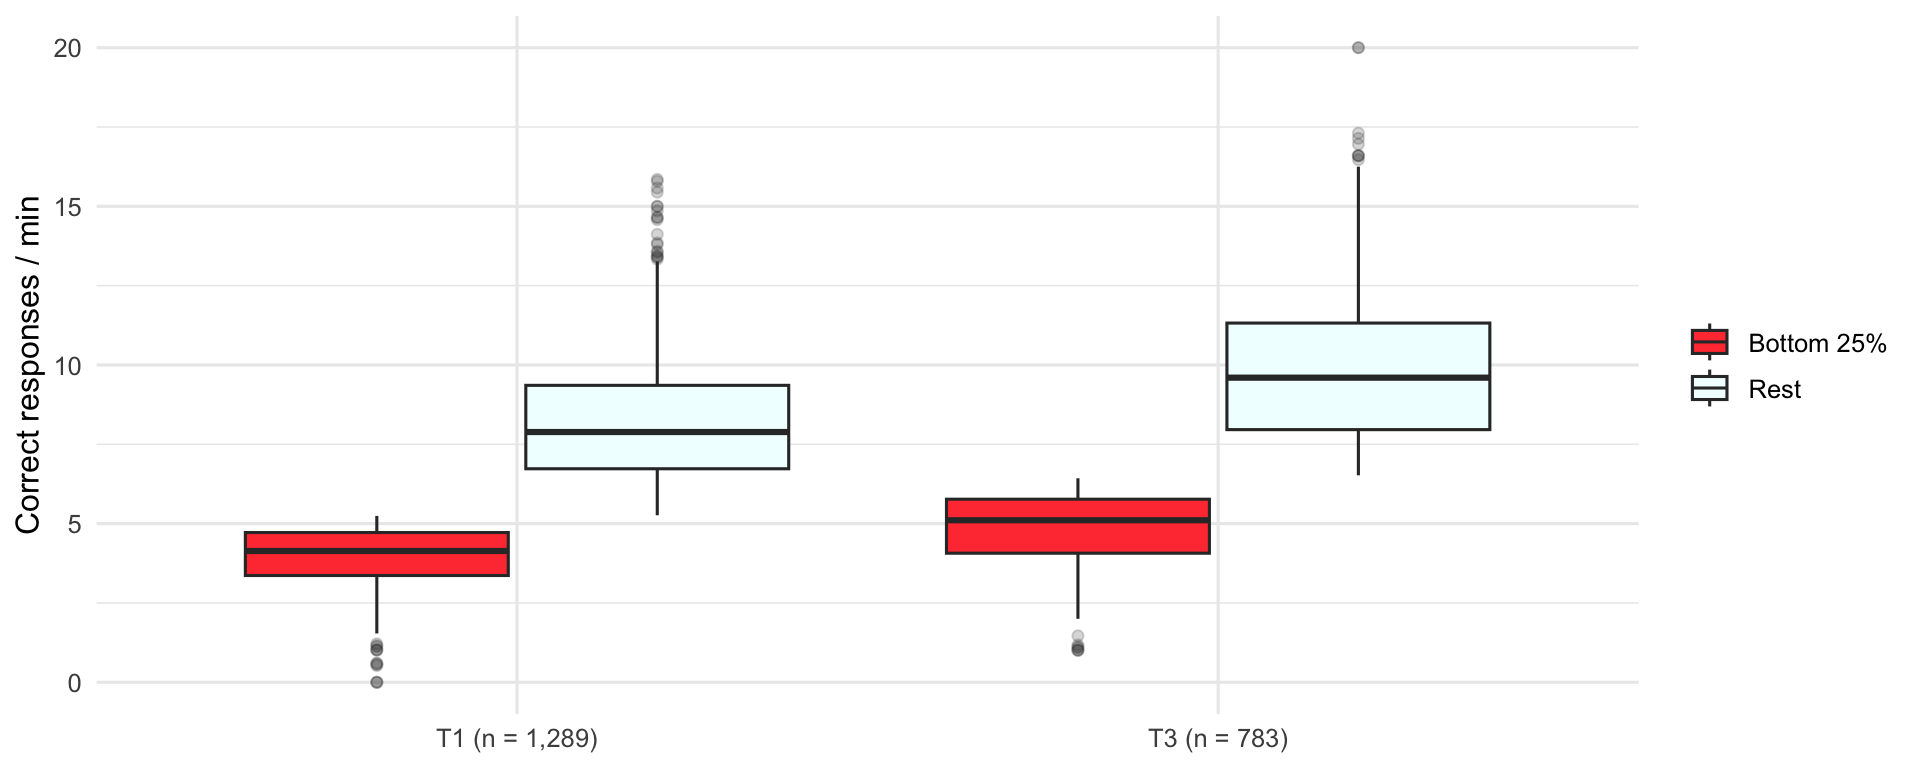
| Term | Group | Students | 25th percentile | Median | 75th percentile |
|---|---|---|---|---|---|
| Term 1 | Bottom 25% | 325 | 3.36 | 4.14 | 4.72 |
| Term 1 | Rest | 963 | 6.73 | 7.89 | 9.36 |
| Term 3 | Bottom 25% | 196 | 4.07 | 5.11 | 5.77 |
| Term 3 | Rest | 587 | 7.96 | 9.60 | 11.32 |
| Term 4 | Bottom 25% | 149 | 5.36 | 6.43 | 7.37 |
| Term 4 | Rest | 416 | 9.06 | 10.80 | 12.45 |
Fluency distribution
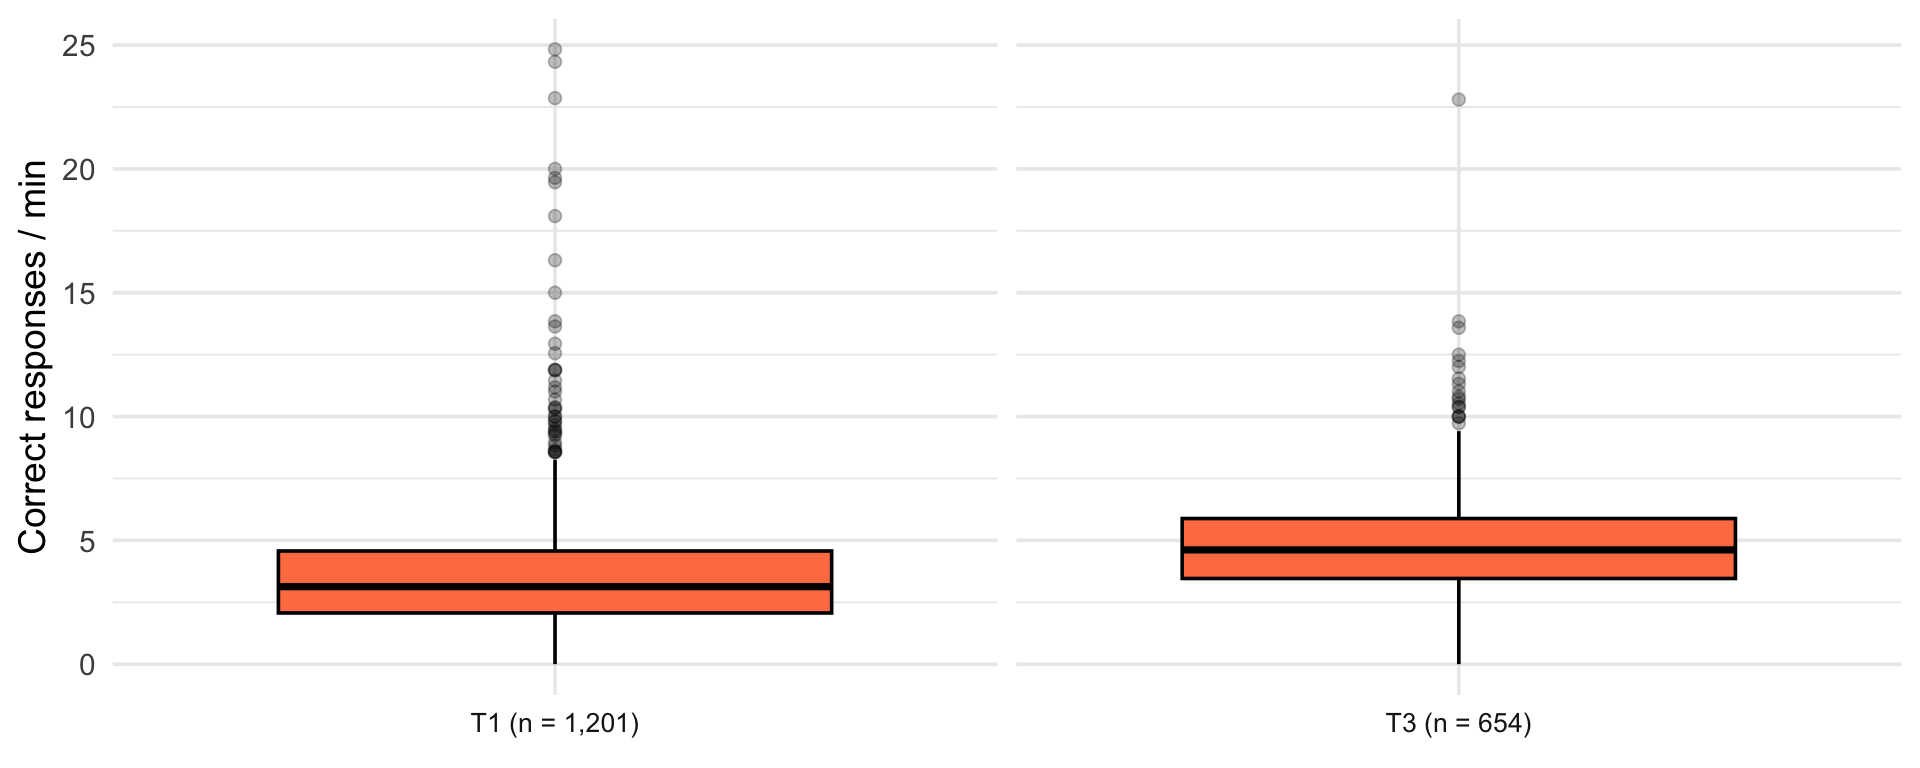
| Term | Students | 25th percentile | Median | 75th percentile |
|---|---|---|---|---|
| Term 1 | 1201 | 2.07 | 3.13 | 4.57 |
| Term 3 | 652 | 3.46 | 4.62 | 5.88 |
| Term 4 | 525 | 3.75 | 5.11 | 6.43 |
Bottom quartile vs rest
| Term | Group | Students | 25th percentile | Median | 75th percentile |
|---|---|---|---|---|---|
| Term 1 | Bottom 25% | 304 | 1.05 | 1.53 | 1.73 |
| Term 1 | Rest | 897 | 2.79 | 3.75 | 5.05 |
| Term 3 | Bottom 25% | 171 | 2.07 | 3.00 | 3.23 |
| Term 3 | Rest | 481 | 4.36 | 5.26 | 6.38 |
| Term 4 | Bottom 25% | 138 | 2.14 | 3.00 | 3.40 |
| Term 4 | Rest | 387 | 4.74 | 5.77 | 6.87 |
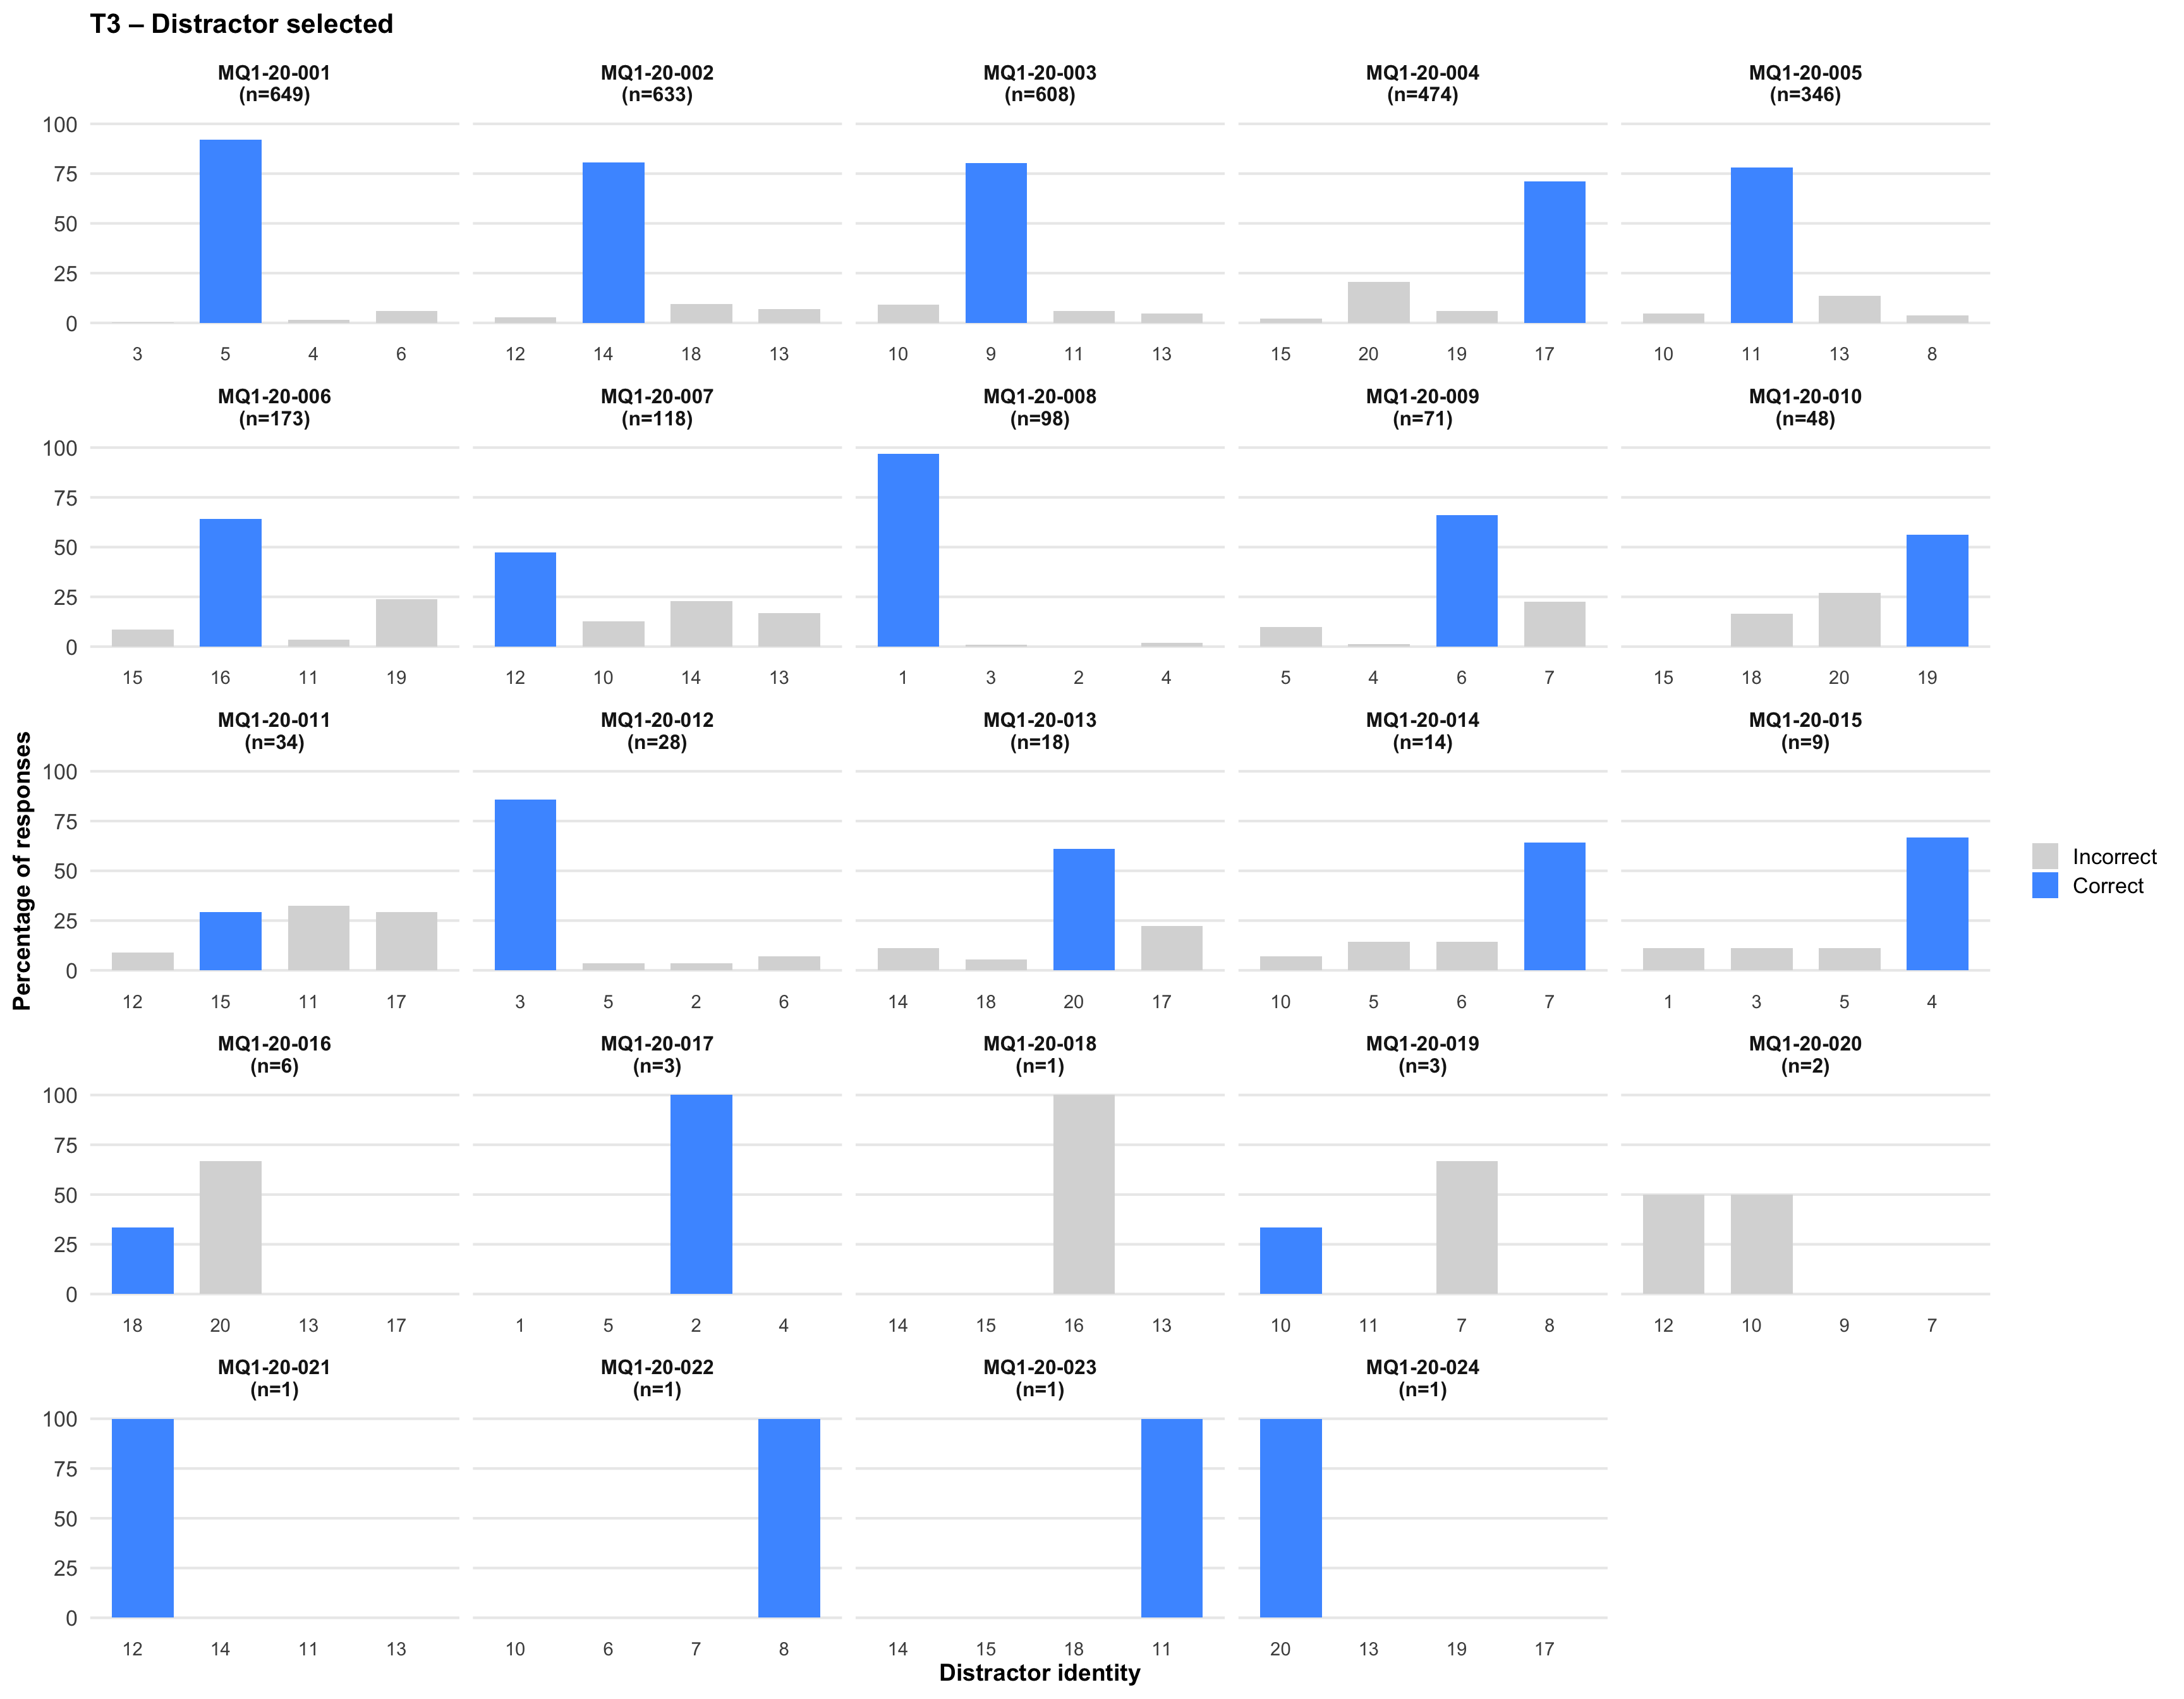
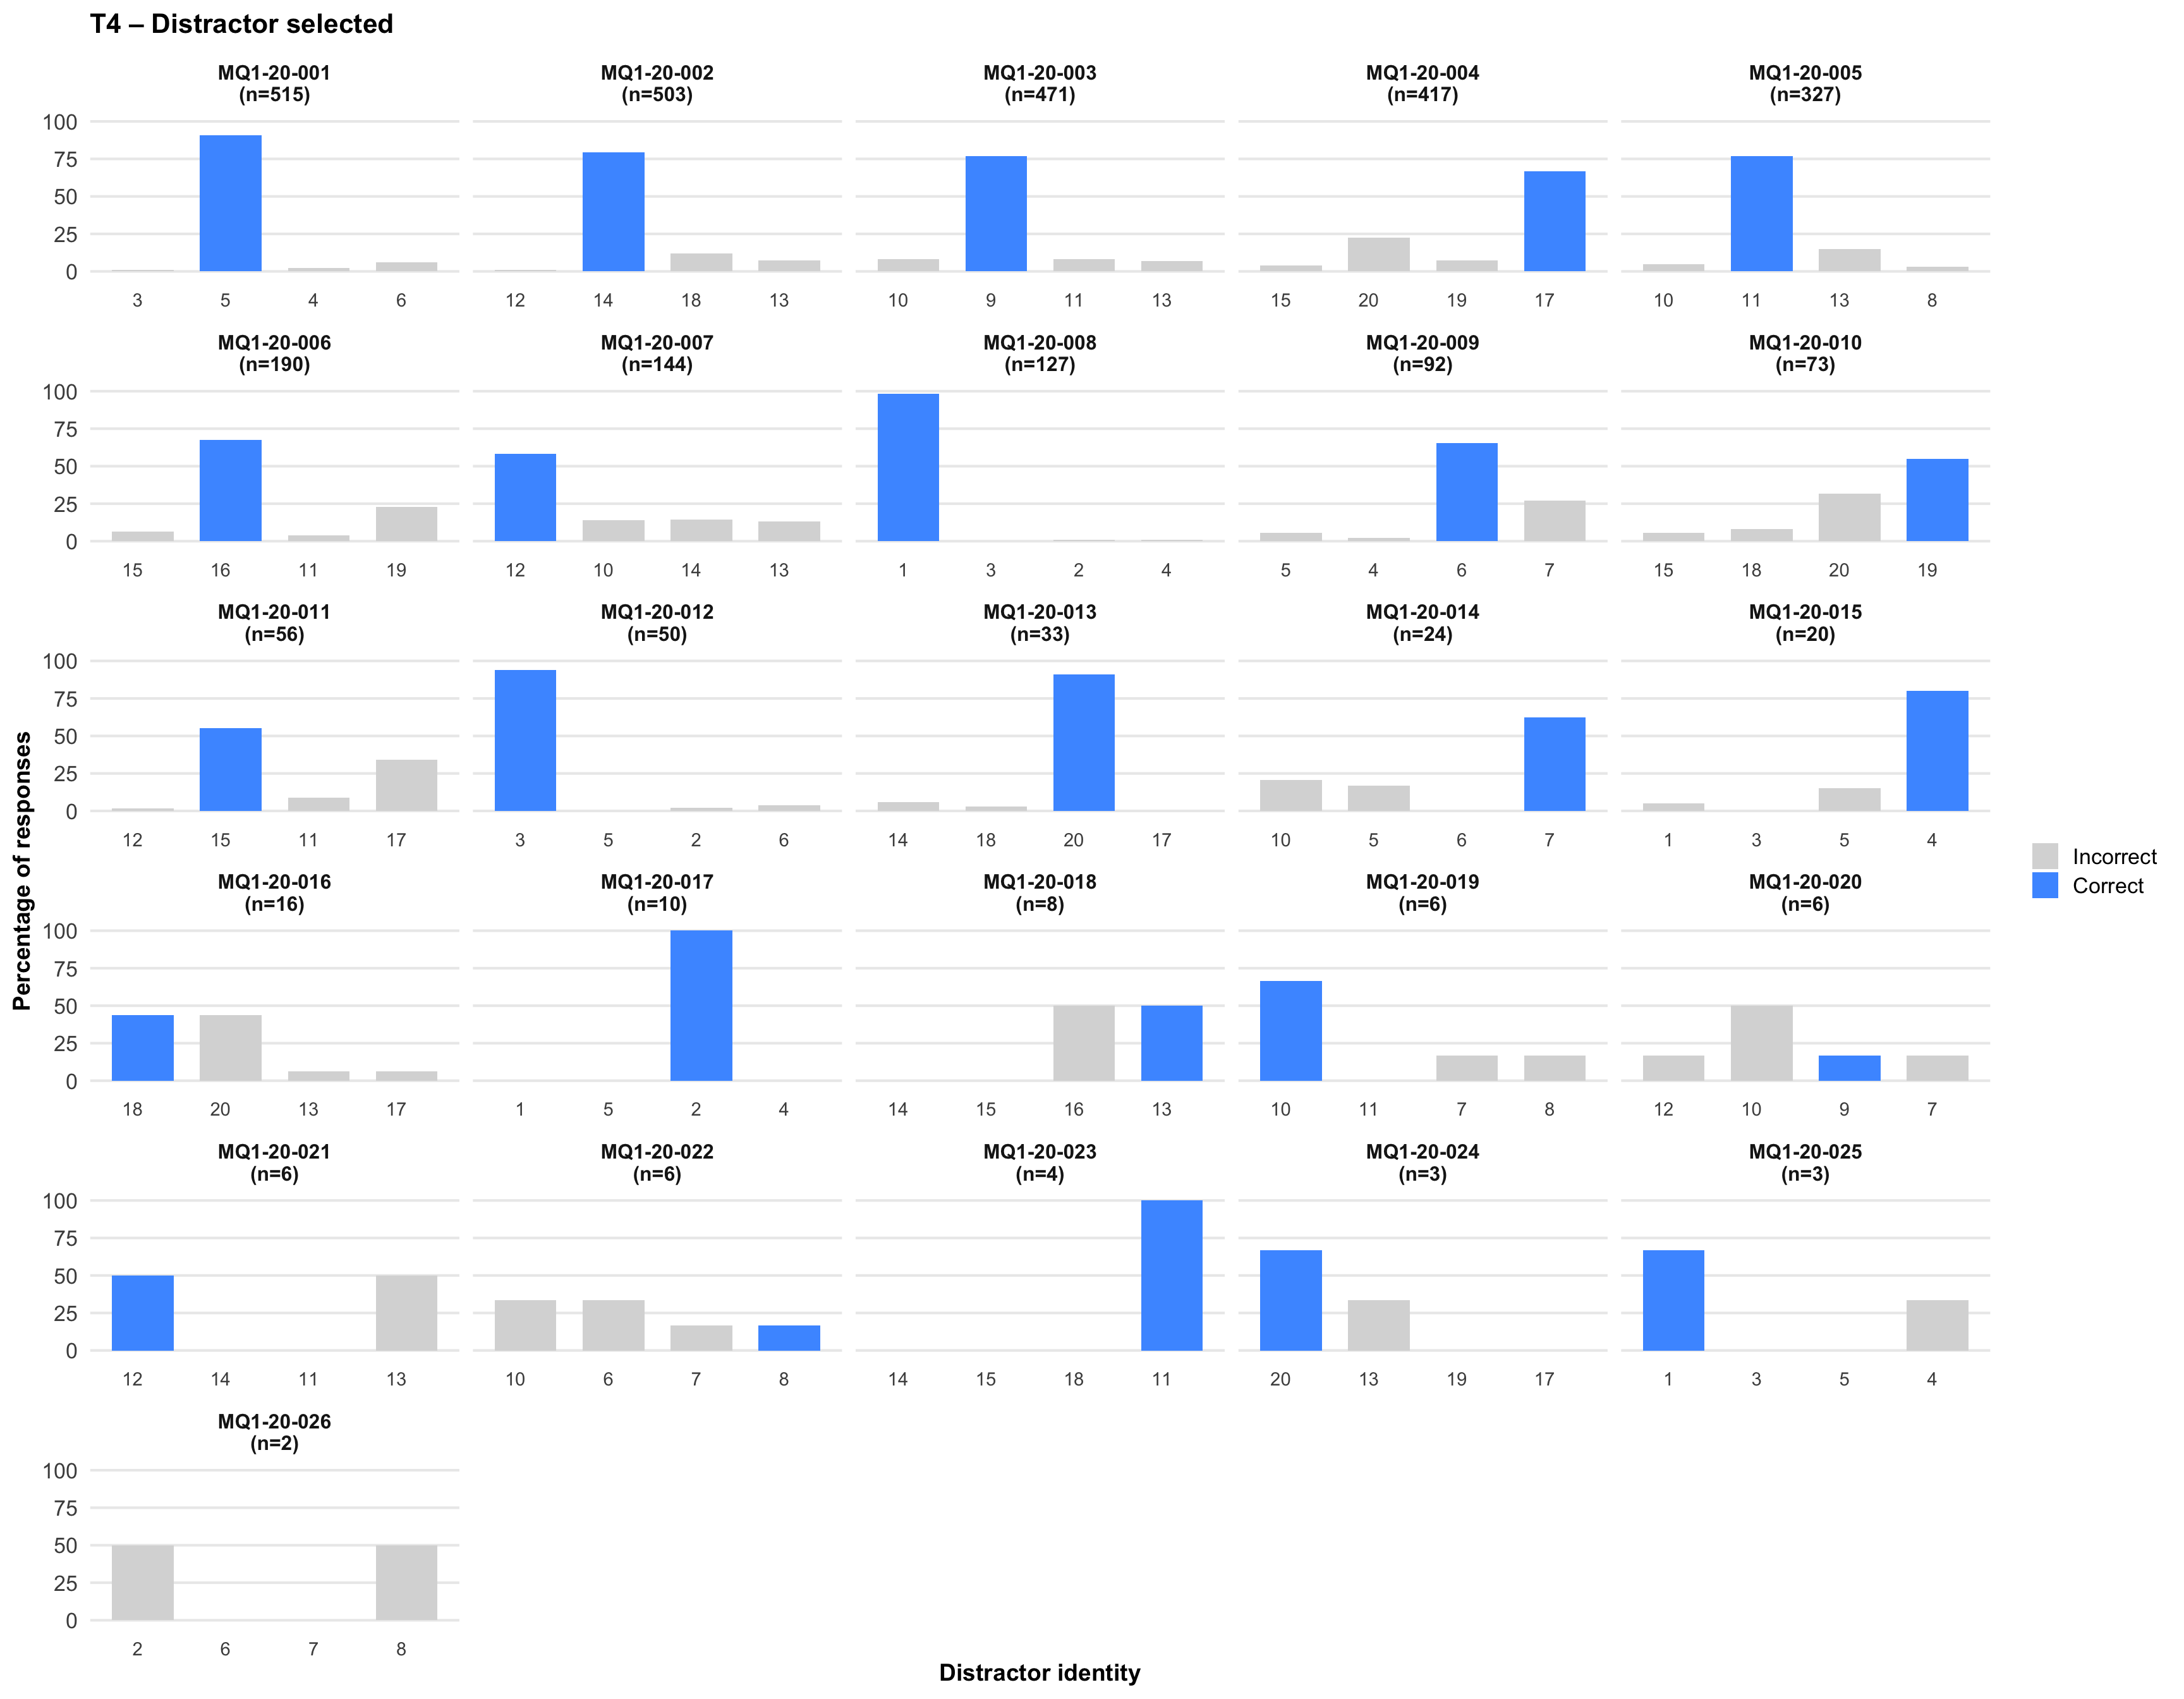
6. Distractor selected
Tip💡 Tip
Click on any plot to view an enlarged version in a lightbox popup.

7. Item statistics
NoteItem discrimination
Item discrimination (point-biserial) measures how well an item separates higher-ability from lower-ability students. Values above ~0.3 are typically “good”, below ~0.2 “weak”. In timed tests, late items can look artificially strong because only fast/able students reach them.
| Question | Target (btn) | No. response | % Correct | Most common error | Median RT | 95th RT | Item discrim. |
|---|---|---|---|---|---|---|---|
| Term 1 | |||||||
| 1 | 4 (btn-3) | 1268 | 97.2 | 6 (btn-4) | 8.0 | 23.00 | 0.20 |
| 2 | 6 (btn-2) | 1221 | 90.7 | 8 (btn-3) | 9.0 | 22.00 | 0.22 |
| 3 | 2 (btn-4) | 1239 | 98.1 | 1 (btn-2) | 4.0 | 10.00 | 0.13 |
| 4 | 7 (btn-3) | 1234 | 82.7 | 8 (btn-1) | 8.0 | 19.00 | 0.15 |
| 5 | 9 (btn-4) | 1206 | 78.8 | 10 (btn-2) | 10.0 | 27.00 | 0.07 |
| 6 | 1 (btn-1) | 1207 | 98.9 | 3 (btn-3) | 4.0 | 10.00 | 0.07 |
| 7 | 6 (btn-3) | 1184 | 89.7 | 7 (btn-4) | 7.0 | 18.00 | 0.14 |
| 8 | 10 (btn-4) | 1116 | 85.1 | 9 (btn-2) | 10.0 | 24.00 | 0.18 |
| 9 | 2 (btn-1) | 1091 | 98.4 | 5 (btn-3) | 4.0 | 10.00 | 0.20 |
| 10 | 5 (btn-3) | 1033 | 89.3 | 6 (btn-2) | 6.0 | 14.00 | 0.17 |
| 11 | 7 (btn-1) | 932 | 84.8 | 8 (btn-2) | 8.0 | 18.00 | 0.13 |
| 12 | 3 (btn-2) | 887 | 97.2 | 5 (btn-3) | 4.0 | 9.00 | 0.20 |
| 13 | 4 (btn-2) | 832 | 95.2 | 5 (btn-3) | 5.0 | 10.00 | 0.07 |
| 14 | 8 (btn-4) | 687 | 83.0 | 10 (btn-1) | 8.0 | 16.00 | 0.16 |
| 15 | 5 (btn-1) | 564 | 83.3 | 6 (btn-3) | 6.0 | 11.00 | 0.14 |
| 16 | 10 (btn-3) | 441 | 88.0 | 9 (btn-1) | 7.0 | 14.00 | 0.24 |
| 17 | 3 (btn-2) | 395 | 95.2 | 1 (btn-3) | 3.0 | 6.00 | 0.45 |
| 18 | 7 (btn-4) | 303 | 70.3 | 6 (btn-3) | 6.0 | 14.00 | 0.37 |
| 19 | 1 (btn-1) | 256 | 96.9 | 7 (btn-3) | 3.0 | 6.00 | 0.37 |
| 20 | 6 (btn-4) | 185 | 79.5 | 4 (btn-3) | 5.0 | 9.00 | 0.32 |
| 21 | 9 (btn-1) | 154 | 87.0 | 7 (btn-3) | 4.0 | 7.35 | 0.53 |
| 22 | 5 (btn-2) | 103 | 78.6 | 8 (btn-1) | 4.0 | 9.00 | 0.49 |
| 23 | 10 (btn-4) | 72 | 83.3 | 6 (btn-1) | 4.0 | 8.05 | 0.41 |
| 24 | 2 (btn-1) | 57 | 82.5 | 3 (btn-2) | 3.0 | 6.00 | 0.47 |
| 25 | 6 (btn-2) | 40 | 77.5 | 4 (btn-3) | 4.0 | 5.50 | 0.58 |
| 26 | 1 (btn-4) | 36 | 86.1 | 4 (btn-1) | 3.0 | 5.50 | 0.42 |
| 27 | 7 (btn-3) | 24 | 45.8 | 10 (btn-1) | 4.0 | 5.00 | 0.25 |
| 28 | 4 (btn-1) | 18 | 44.4 | 2 (btn-3) | 4.0 | 5.65 | NA |
| 29 | 8 (btn-2) | 14 | 57.1 | 7 (btn-3) | 2.0 | 5.30 | NA |
| 30 | 3 (btn-3) | 10 | 80.0 | 1 (btn-2) | 2.5 | 4.30 | NA |
| Term 3 | |||||||
| 1 | 4 (btn-3) | 770 | 98.2 | 3 (btn-1) | 7.0 | 21.00 | 0.04 |
| 2 | 6 (btn-2) | 760 | 94.9 | 8 (btn-3) | 7.0 | 19.00 | 0.10 |
| 3 | 2 (btn-4) | 754 | 98.9 | 4 (btn-3) | 4.0 | 9.00 | 0.13 |
| 4 | 7 (btn-3) | 729 | 86.1 | 8 (btn-1) | 7.0 | 14.00 | 0.10 |
| 5 | 9 (btn-4) | 680 | 81.8 | 10 (btn-2) | 9.0 | 19.00 | -0.06 |
| 6 | 1 (btn-1) | 647 | 99.2 | 2 (btn-2) | 3.0 | 7.00 | 0.09 |
| 7 | 6 (btn-3) | 552 | 94.4 | 7 (btn-4) | 6.0 | 11.00 | 0.08 |
| 8 | 10 (btn-4) | 414 | 88.9 | 9 (btn-2) | 7.0 | 12.65 | 0.10 |
| 9 | 2 (btn-1) | 343 | 98.5 | 5 (btn-3) | 3.0 | 6.00 | 0.20 |
| 10 | 5 (btn-3) | 231 | 90.5 | 6 (btn-2) | 4.0 | 7.00 | 0.25 |
| 11 | 7 (btn-1) | 137 | 73.0 | 8 (btn-2) | 5.0 | 8.05 | 0.23 |
| 12 | 3 (btn-2) | 90 | 94.4 | 5 (btn-3) | 2.0 | 5.00 | 0.40 |
| 13 | 4 (btn-2) | 56 | 85.7 | 5 (btn-3) | 3.0 | 4.65 | 0.22 |
| 14 | 8 (btn-4) | 29 | 69.0 | 10 (btn-1) | 4.0 | 7.00 | 0.04 |
| 15 | 5 (btn-1) | 15 | 53.3 | 6 (btn-3) | 3.0 | 5.95 | NA |
| 16 | 10 (btn-3) | 10 | 70.0 | 2 (btn-2) | 2.0 | 7.80 | NA |
| 17 | 3 (btn-2) | 8 | 75.0 | 7 (btn-1) | 2.0 | 2.75 | NA |
| 18 | 7 (btn-4) | 4 | 50.0 | 9 (btn-2) | 2.5 | 2.95 | NA |
| 19 | 1 (btn-1) | 1 | 100.0 | – | 2.0 | 2.00 | NA |
| 20 | 6 (btn-4) | 1 | 100.0 | – | 6.0 | 6.00 | NA |
| 21 | 9 (btn-1) | 1 | 100.0 | – | 3.0 | 3.00 | NA |
| 22 | 5 (btn-2) | 1 | 0.0 | 2 (btn-3) | NA | NA | NA |
| 23 | 10 (btn-4) | 1 | 0.0 | 4 (btn-3) | NA | NA | NA |
| Term 4 | |||||||
| 1 | 4 (btn-3) | 555 | 98.2 | 3 (btn-1) | 6.0 | 16.00 | 0.09 |
| 2 | 6 (btn-2) | 542 | 95.4 | 8 (btn-3) | 6.0 | 15.00 | -0.03 |
| 3 | 2 (btn-4) | 554 | 99.5 | 1 (btn-2) | 3.0 | 7.00 | -0.01 |
| 4 | 7 (btn-3) | 542 | 88.0 | 8 (btn-1) | 6.0 | 15.00 | 0.07 |
| 5 | 9 (btn-4) | 520 | 82.7 | 10 (btn-2) | 8.0 | 17.00 | -0.01 |
| 6 | 1 (btn-1) | 512 | 99.2 | 2 (btn-2) | 3.0 | 6.00 | 0.01 |
| 7 | 6 (btn-3) | 475 | 93.7 | 7 (btn-4) | 5.0 | 10.00 | 0.05 |
| 8 | 10 (btn-4) | 363 | 89.3 | 9 (btn-2) | 7.0 | 13.00 | 0.05 |
| 9 | 2 (btn-1) | 327 | 98.2 | 3 (btn-2) | 3.0 | 5.00 | 0.12 |
| 10 | 5 (btn-3) | 238 | 92.0 | 6 (btn-2) | 4.0 | 6.00 | 0.25 |
| 11 | 7 (btn-1) | 156 | 80.8 | 8 (btn-2) | 6.0 | 9.00 | 0.24 |
| 12 | 3 (btn-2) | 108 | 94.4 | 5 (btn-3) | 2.0 | 4.00 | 0.39 |
| 13 | 4 (btn-2) | 82 | 91.5 | 5 (btn-3) | 3.0 | 5.00 | 0.35 |
| 14 | 8 (btn-4) | 36 | 63.9 | 10 (btn-1) | 5.0 | 7.90 | 0.29 |
| 15 | 5 (btn-1) | 22 | 50.0 | 6 (btn-3) | 3.0 | 7.50 | 0.37 |
| 16 | 10 (btn-3) | 18 | 77.8 | 9 (btn-1) | 2.0 | 6.35 | NA |
| 17 | 3 (btn-2) | 15 | 60.0 | 1 (btn-3) | 2.0 | 3.60 | NA |
| 18 | 7 (btn-4) | 7 | 42.9 | 6 (btn-3) | 2.0 | 2.00 | NA |
| 19 | 1 (btn-1) | 7 | 71.4 | 7 (btn-3) | 2.0 | 2.80 | NA |
| 20 | 6 (btn-4) | 7 | 42.9 | 4 (btn-3) | 2.0 | 3.80 | NA |
| 21 | 9 (btn-1) | 6 | 50.0 | 7 (btn-3) | 3.0 | 3.90 | NA |
| 22 | 5 (btn-2) | 6 | 33.3 | 2 (btn-3) | 2.5 | 3.85 | NA |
| 23 | 10 (btn-4) | 5 | 60.0 | 1 (btn-2) | 2.0 | 2.00 | NA |
| 24 | 2 (btn-1) | 5 | 40.0 | 8 (btn-3) | 1.5 | 1.95 | NA |
| 25 | 6 (btn-2) | 4 | 25.0 | 1 (btn-1) | 4.0 | 4.00 | NA |
| 26 | 1 (btn-4) | 4 | 50.0 | 3 (btn-2) | 2.0 | 2.90 | NA |
| 27 | 7 (btn-3) | 3 | 33.3 | 1 (btn-2) | 2.0 | 2.00 | NA |
| 29 | 8 (btn-2) | 1 | 100.0 | – | 1.0 | 1.00 | NA |
| Question | Target (btn) | No. response | % Correct | Most common error | Median RT | 95th RT | Item discrim. |
|---|---|---|---|---|---|---|---|
| Term 1 | |||||||
| 1 | 5 (btn-1) | 1182 | 88.4 | 6 (btn-3) | 10.0 | 24.80 | 0.03 |
| 2 | 14 (btn-4) | 1127 | 70.2 | 13 (btn-3) | 16.0 | 45.00 | 0.05 |
| 3 | 9 (btn-1) | 1108 | 70.8 | 10 (btn-4) | 12.0 | 27.00 | 0.08 |
| 4 | 17 (btn-4) | 1062 | 61.9 | 20 (btn-3) | 18.0 | 44.00 | 0.04 |
| 5 | 11 (btn-2) | 939 | 66.3 | 13 (btn-4) | 13.0 | 27.00 | 0.11 |
| 6 | 16 (btn-3) | 775 | 66.1 | 19 (btn-4) | 15.0 | 30.00 | 0.15 |
| 7 | 12 (btn-1) | 650 | 60.2 | 13 (btn-4) | 12.0 | 22.00 | 0.13 |
| 8 | 1 (btn-4) | 617 | 98.2 | 3 (btn-2) | 4.0 | 9.00 | 0.00 |
| 9 | 6 (btn-2) | 500 | 72.0 | 7 (btn-3) | 7.0 | 14.00 | 0.06 |
| 10 | 19 (btn-3) | 324 | 56.5 | 20 (btn-1) | 11.0 | 22.00 | 0.23 |
| 11 | 15 (btn-2) | 236 | 49.2 | 17 (btn-4) | 5.5 | 14.00 | 0.29 |
| 12 | 3 (btn-1) | 220 | 90.9 | 6 (btn-3) | 4.0 | 9.00 | 0.10 |
| 13 | 20 (btn-3) | 183 | 68.9 | 17 (btn-2) | 3.0 | 9.75 | 0.29 |
| 14 | 7 (btn-3) | 152 | 61.2 | 10 (btn-1) | 4.0 | 9.80 | 0.30 |
| 15 | 4 (btn-1) | 149 | 69.1 | 5 (btn-2) | 4.0 | 9.00 | 0.24 |
| 16 | 18 (btn-3) | 126 | 42.9 | 20 (btn-2) | 4.0 | 15.00 | 0.38 |
| 17 | 2 (btn-3) | 120 | 90.0 | 4 (btn-4) | 3.0 | 6.65 | 0.18 |
| 18 | 13 (btn-3) | 105 | 43.8 | 16 (btn-2) | 3.0 | 9.50 | 0.22 |
| 19 | 10 (btn-2) | 95 | 56.8 | 11 (btn-4) | 3.0 | 9.00 | 0.38 |
| 20 | 9 (btn-4) | 86 | 29.1 | 10 (btn-3) | 4.0 | 10.80 | 0.43 |
| 21 | 12 (btn-2) | 79 | 40.5 | 13 (btn-3) | 3.0 | 8.00 | 0.26 |
| 22 | 8 (btn-4) | 70 | 34.3 | 10 (btn-2) | 3.0 | 7.55 | 0.24 |
| 23 | 11 (btn-3) | 63 | 46.0 | 15 (btn-2) | 2.0 | 7.40 | 0.30 |
| 24 | 20 (btn-2) | 55 | 54.5 | 13 (btn-3) | 2.0 | 12.85 | 0.33 |
| 25 | 1 (btn-4) | 51 | 90.2 | 4 (btn-2) | 2.0 | 6.00 | 0.12 |
| 26 | 7 (btn-2) | 52 | 38.5 | 8 (btn-3) | 2.0 | 6.05 | 0.40 |
| 27 | 5 (btn-1) | 46 | 47.8 | 3 (btn-2) | 2.5 | 7.00 | 0.27 |
| 28 | 14 (btn-1) | 41 | 17.1 | 18 (btn-3) | 2.0 | 4.70 | 0.05 |
| 29 | 17 (btn-4) | 37 | 18.9 | 15 (btn-3) | 2.0 | 7.40 | 0.06 |
| 30 | 8 (btn-4) | 31 | 25.8 | 9 (btn-3) | 3.0 | 7.60 | 0.17 |
| Term 3 | |||||||
| 1 | 5 (btn-1) | 647 | 92.1 | 6 (btn-3) | 7.0 | 18.00 | 0.03 |
| 2 | 14 (btn-4) | 632 | 80.7 | 18 (btn-2) | 12.0 | 31.00 | -0.08 |
| 3 | 9 (btn-1) | 607 | 80.2 | 10 (btn-4) | 9.0 | 20.00 | 0.03 |
| 4 | 17 (btn-4) | 473 | 71.0 | 20 (btn-3) | 13.0 | 24.00 | 0.15 |
| 5 | 11 (btn-2) | 346 | 78.0 | 13 (btn-4) | 9.0 | 15.00 | 0.19 |
| 6 | 16 (btn-3) | 173 | 64.2 | 19 (btn-4) | 8.0 | 14.00 | 0.27 |
| 7 | 12 (btn-1) | 118 | 47.5 | 14 (btn-2) | 6.5 | 10.75 | 0.33 |
| 8 | 1 (btn-4) | 98 | 96.9 | 4 (btn-1) | 3.0 | 6.00 | 0.12 |
| 9 | 6 (btn-2) | 71 | 66.2 | 7 (btn-3) | 4.0 | 7.70 | 0.21 |
| 10 | 19 (btn-3) | 48 | 56.2 | 20 (btn-1) | 4.0 | 6.70 | 0.34 |
| 11 | 15 (btn-2) | 34 | 29.4 | 11 (btn-3) | 3.0 | 7.00 | 0.09 |
| 12 | 3 (btn-1) | 28 | 85.7 | 6 (btn-3) | 3.0 | 5.85 | 0.16 |
| 13 | 20 (btn-3) | 18 | 61.1 | 17 (btn-2) | 3.0 | 6.00 | NA |
| 14 | 7 (btn-3) | 14 | 64.3 | 5 (btn-2) | 2.0 | 4.20 | NA |
| 15 | 4 (btn-1) | 9 | 66.7 | 5 (btn-2) | 3.0 | 7.75 | NA |
| 16 | 18 (btn-3) | 6 | 33.3 | 20 (btn-2) | 4.0 | 5.80 | NA |
| 17 | 2 (btn-3) | 3 | 100.0 | – | 2.0 | 5.60 | NA |
| 18 | 13 (btn-3) | 1 | 0.0 | 16 (btn-2) | NA | NA | NA |
| 19 | 10 (btn-2) | 3 | 33.3 | 7 (btn-3) | 2.0 | 2.00 | NA |
| 20 | 9 (btn-4) | 2 | 0.0 | 12 (btn-1) | NA | NA | NA |
| 21 | 12 (btn-2) | 1 | 100.0 | – | 2.0 | 2.00 | NA |
| 22 | 8 (btn-4) | 1 | 100.0 | – | 2.0 | 2.00 | NA |
| 23 | 11 (btn-3) | 1 | 100.0 | – | 2.0 | 2.00 | NA |
| 24 | 20 (btn-2) | 1 | 100.0 | – | 2.0 | 2.00 | NA |
| Term 4 | |||||||
| 1 | 5 (btn-1) | 515 | 90.7 | 6 (btn-3) | 7.0 | 18.00 | 0.00 |
| 2 | 14 (btn-4) | 503 | 79.5 | 18 (btn-2) | 12.0 | 30.10 | -0.13 |
| 3 | 9 (btn-1) | 471 | 77.1 | 11 (btn-2) | 9.0 | 19.00 | -0.11 |
| 4 | 17 (btn-4) | 417 | 66.7 | 20 (btn-3) | 12.0 | 22.15 | -0.03 |
| 5 | 11 (btn-2) | 327 | 77.1 | 13 (btn-4) | 8.0 | 16.00 | 0.11 |
| 6 | 16 (btn-3) | 190 | 67.4 | 19 (btn-4) | 8.0 | 14.00 | 0.24 |
| 7 | 12 (btn-1) | 144 | 58.3 | 14 (btn-2) | 5.5 | 12.00 | 0.26 |
| 8 | 1 (btn-4) | 127 | 98.4 | 4 (btn-1) | 3.0 | 5.00 | 0.10 |
| 9 | 6 (btn-2) | 92 | 65.2 | 7 (btn-3) | 4.0 | 7.00 | 0.23 |
| 10 | 19 (btn-3) | 73 | 54.8 | 20 (btn-1) | 3.0 | 8.05 | 0.35 |
| 11 | 15 (btn-2) | 56 | 55.4 | 17 (btn-4) | 3.0 | 5.50 | 0.37 |
| 12 | 3 (btn-1) | 50 | 94.0 | 6 (btn-3) | 3.0 | 5.70 | 0.13 |
| 13 | 20 (btn-3) | 33 | 90.9 | 14 (btn-4) | 2.0 | 5.55 | 0.14 |
| 14 | 7 (btn-3) | 24 | 62.5 | 10 (btn-1) | 2.0 | 8.20 | 0.27 |
| 15 | 4 (btn-1) | 20 | 80.0 | 5 (btn-2) | 3.0 | 6.25 | 0.30 |
| 16 | 18 (btn-3) | 16 | 43.8 | 20 (btn-2) | 2.0 | 5.10 | NA |
| 17 | 2 (btn-3) | 10 | 100.0 | – | 2.0 | 3.00 | NA |
| 18 | 13 (btn-3) | 8 | 50.0 | 16 (btn-2) | 2.0 | 2.00 | NA |
| 19 | 10 (btn-2) | 6 | 66.7 | 8 (btn-1) | 2.0 | 2.00 | NA |
| 20 | 9 (btn-4) | 6 | 16.7 | 10 (btn-3) | 2.0 | 2.00 | NA |
| 21 | 12 (btn-2) | 6 | 50.0 | 13 (btn-3) | 2.0 | 2.00 | NA |
| 22 | 8 (btn-4) | 6 | 16.7 | 10 (btn-2) | 1.0 | 1.00 | NA |
| 23 | 11 (btn-3) | 4 | 100.0 | – | 1.0 | 1.85 | NA |
| 24 | 20 (btn-2) | 3 | 66.7 | 13 (btn-3) | 2.0 | 2.00 | NA |
| 25 | 1 (btn-4) | 3 | 66.7 | 4 (btn-2) | 1.5 | 1.95 | NA |
| 26 | 7 (btn-2) | 2 | 0.0 | 8 (btn-3) | NA | NA | NA |
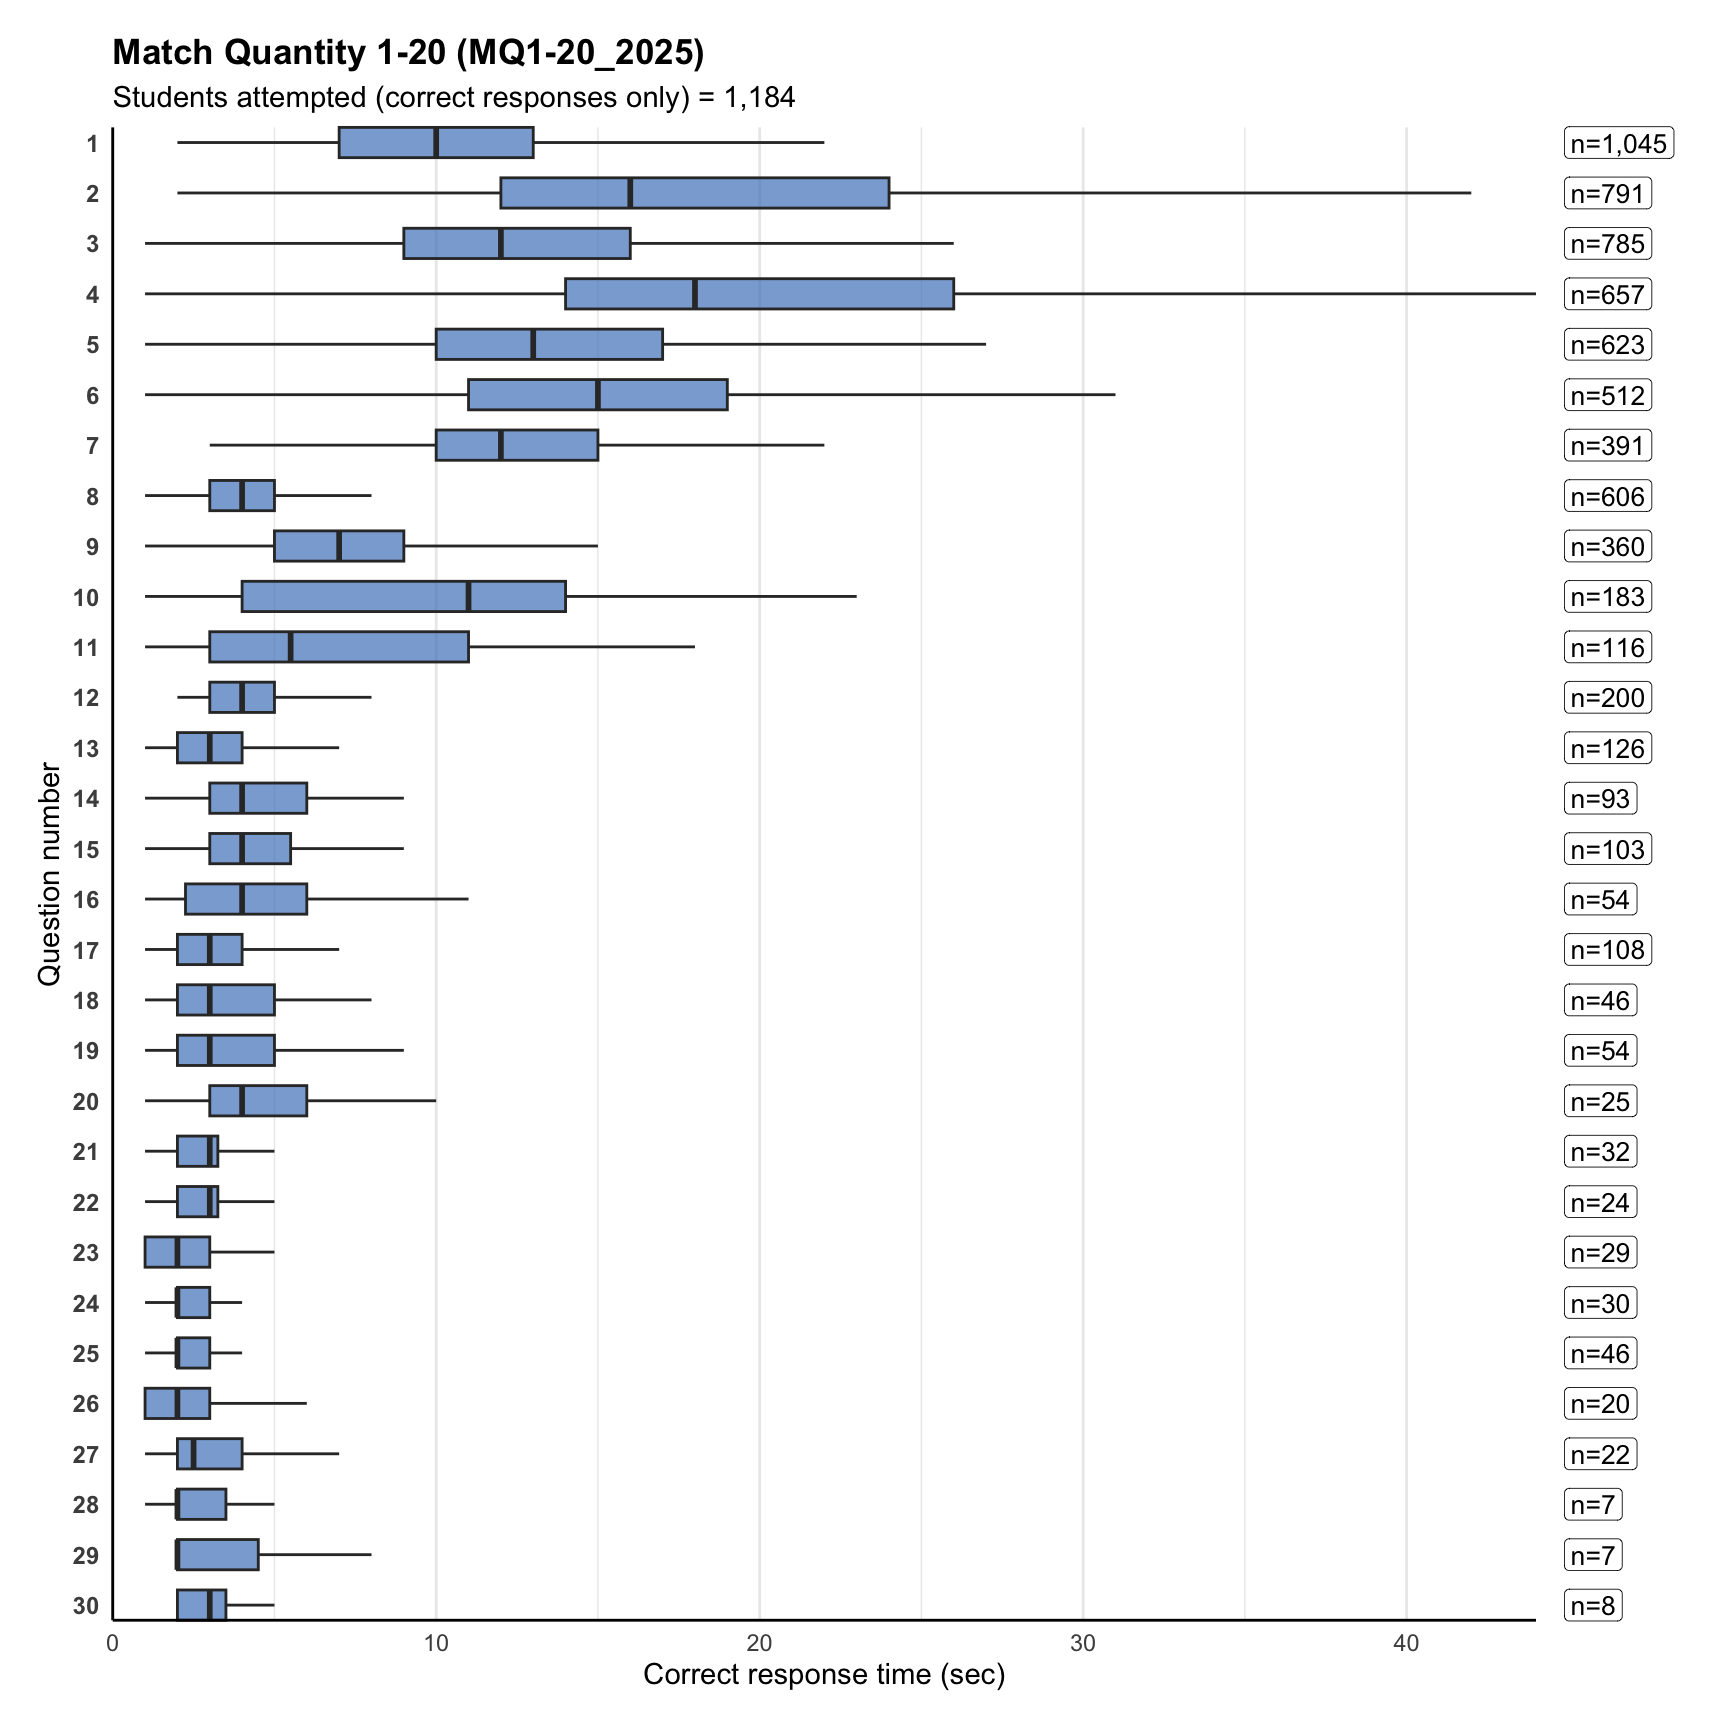
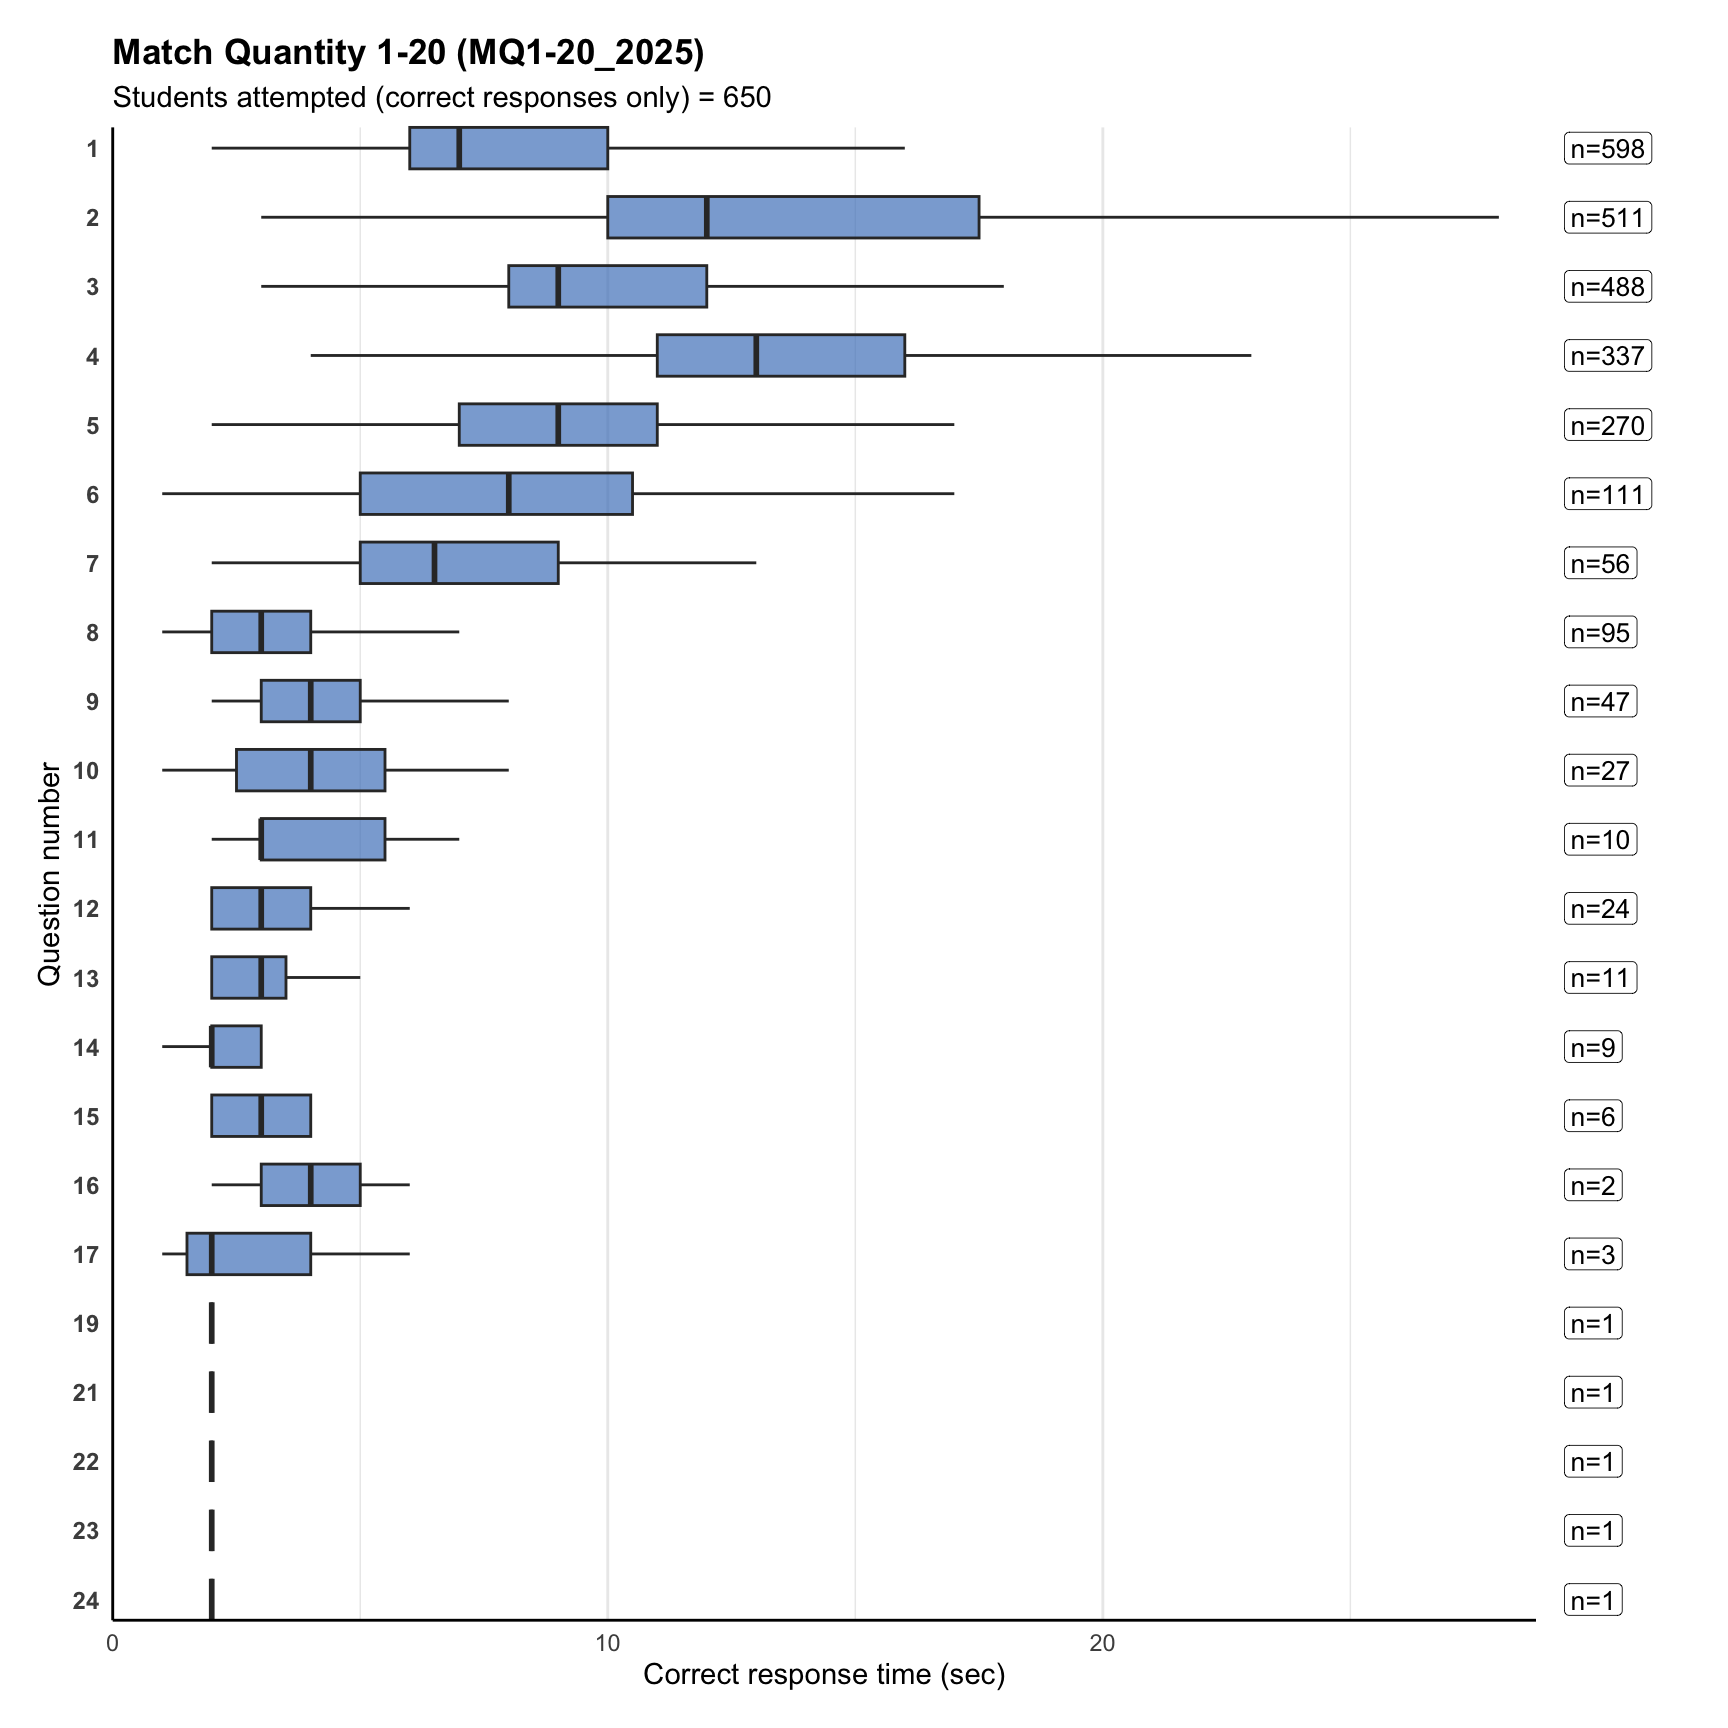
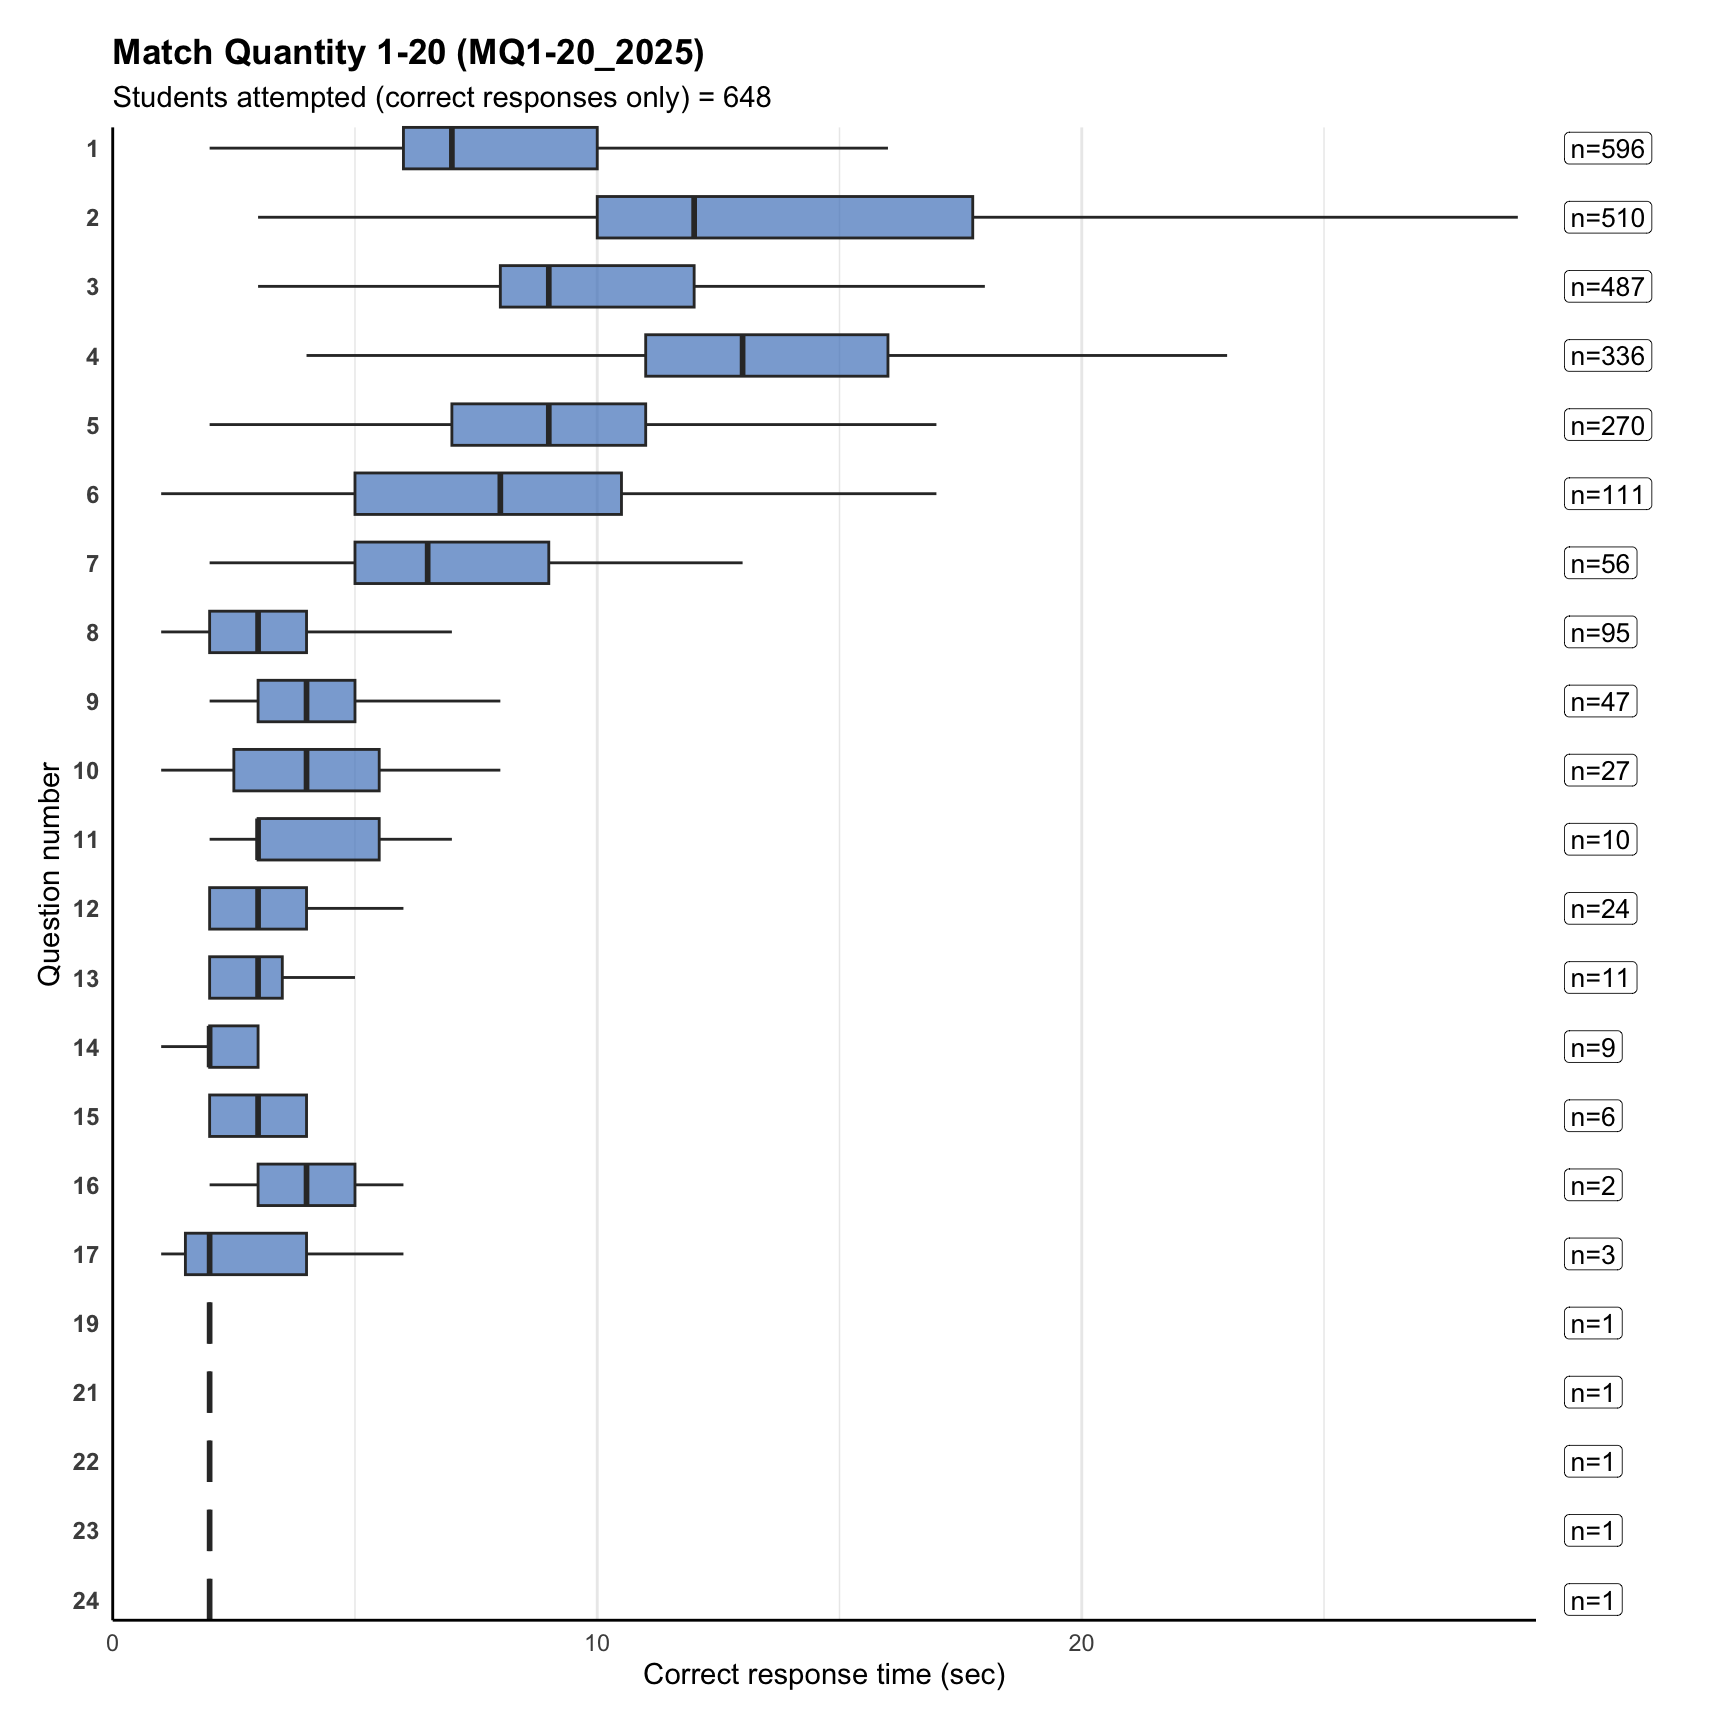
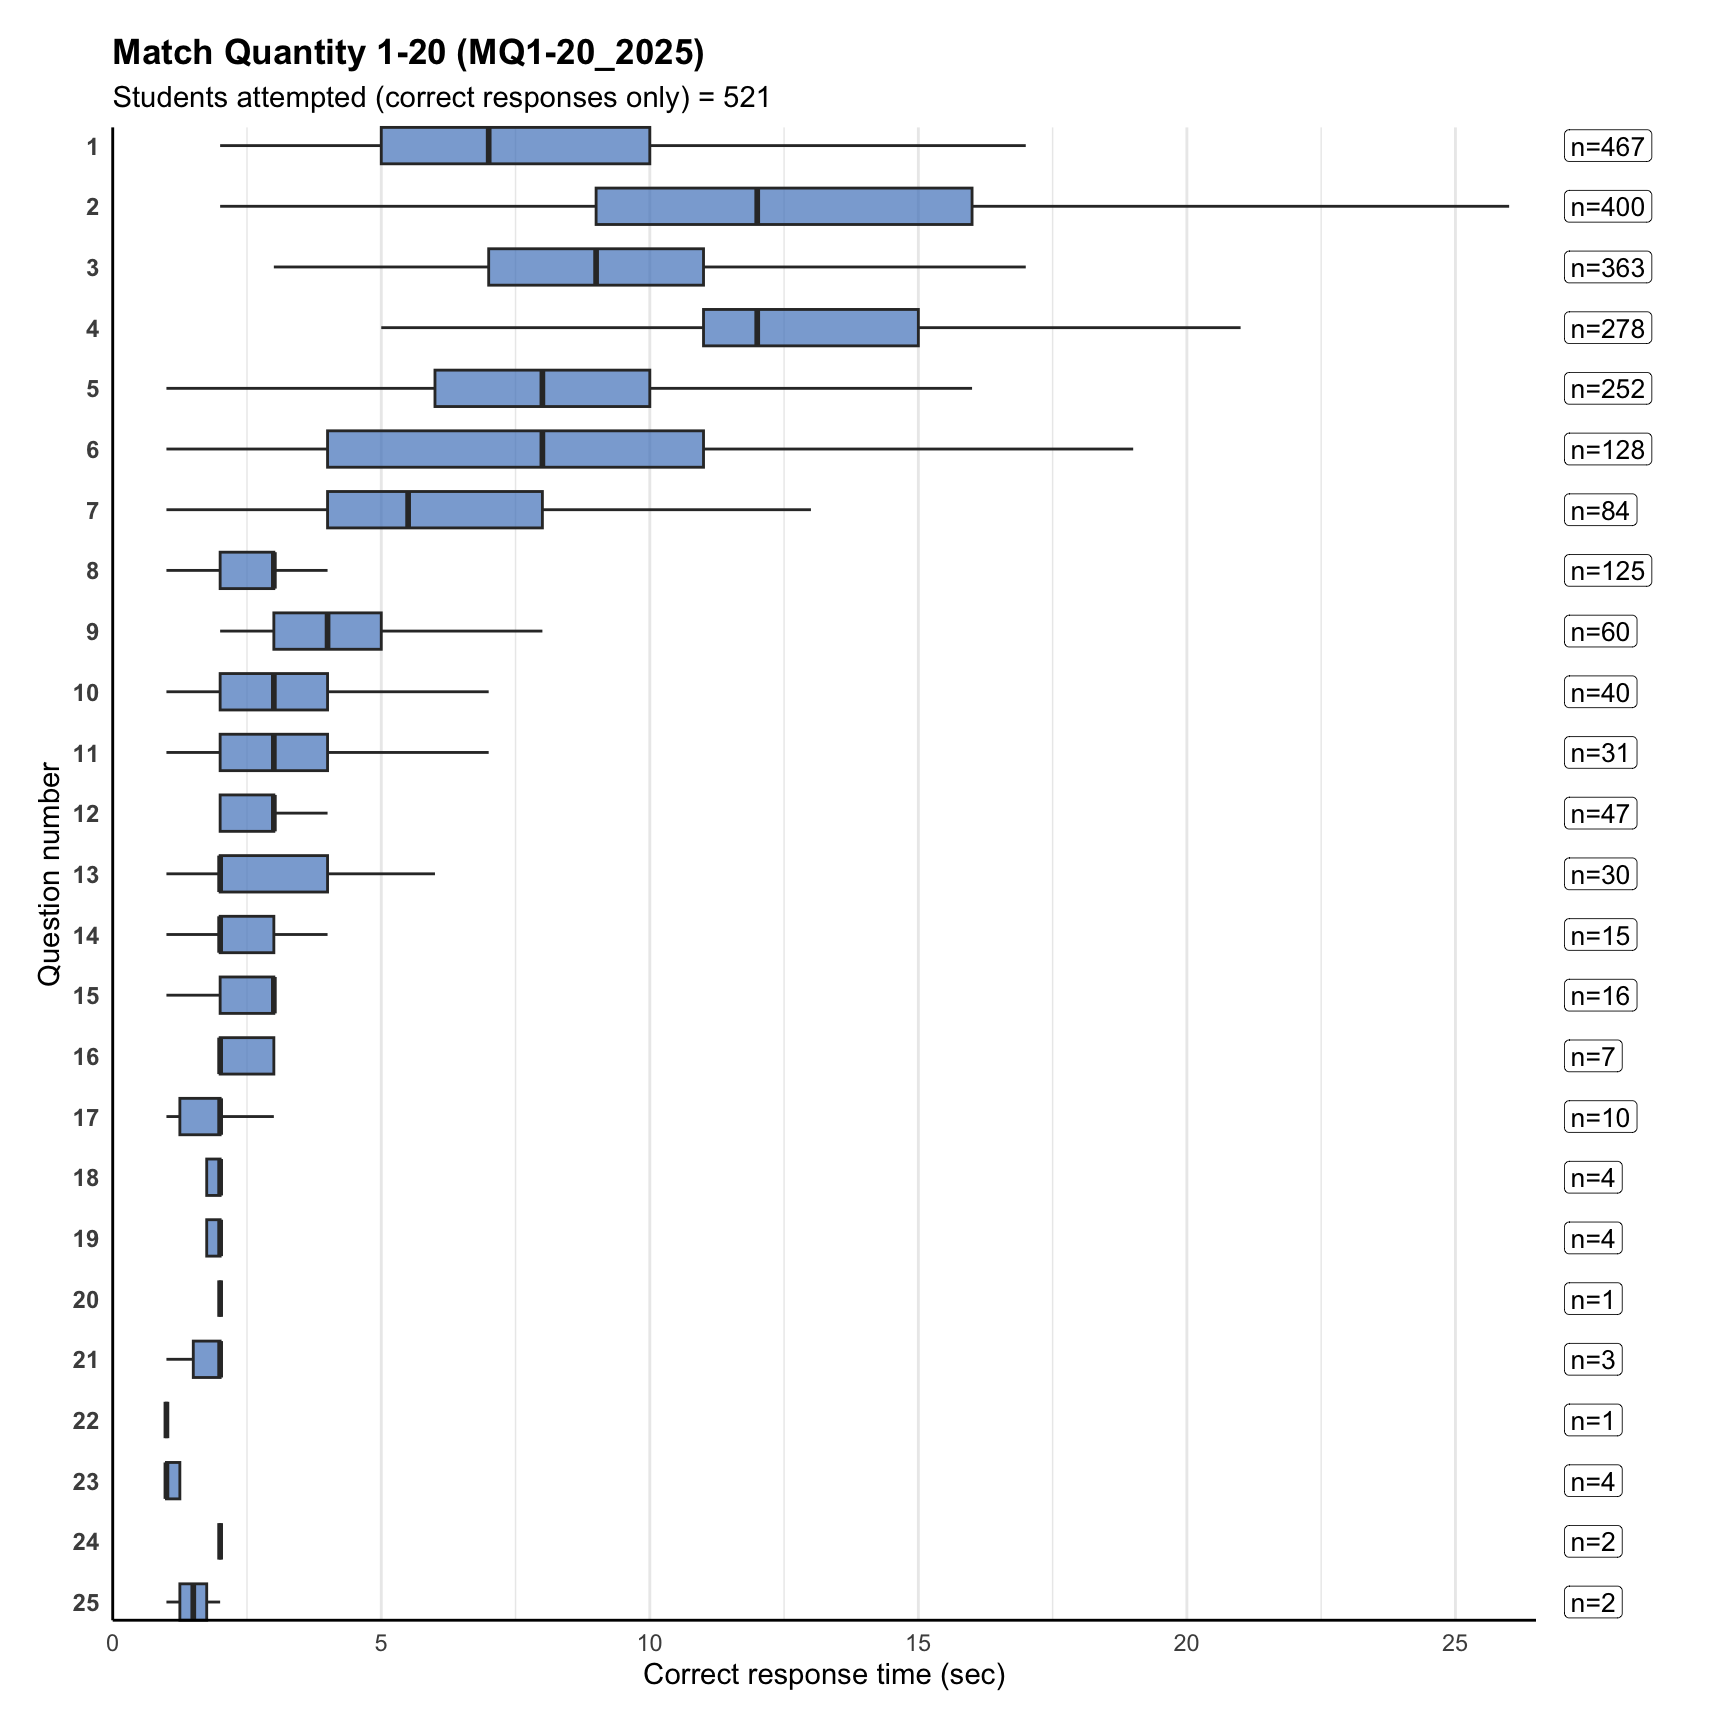
8. Item correct response time
Term 1
Term 3
Term 4
Term 1
Term 3
Term 4
9. Correlation between target number and performance
This section shows how item difficulty varies with the target number (Stimuli).
The size of each dot represents the number of attempted responses for that item. The regression line is weighted to give more influence to items with higher response counts.
Within each tab, Term 1 and Term 3 are shown separately.
`geom_smooth()` using formula = 'y ~ x'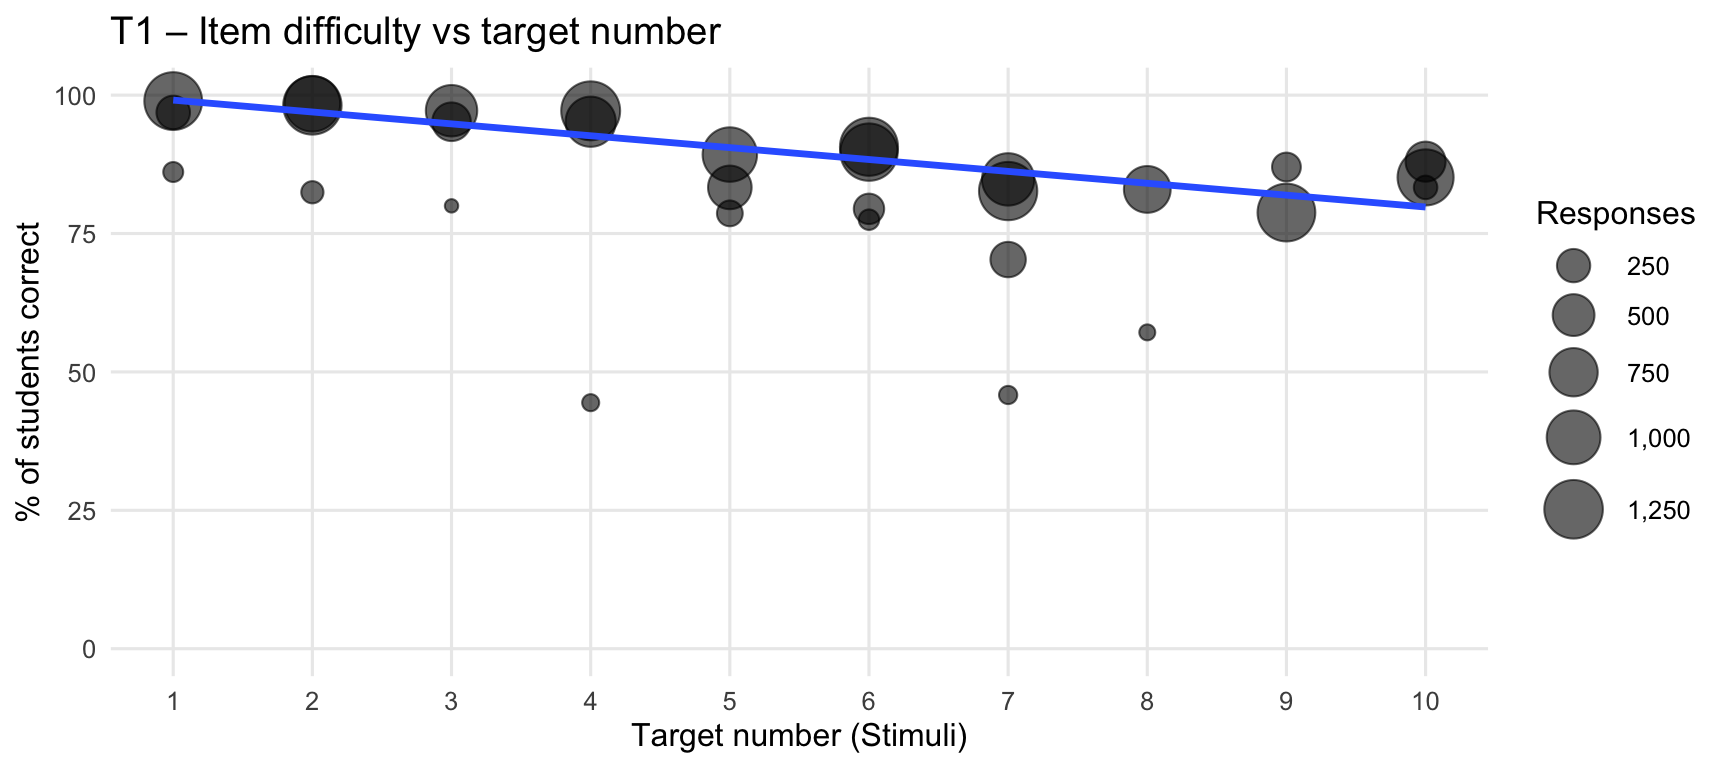
`geom_smooth()` using formula = 'y ~ x'Warning: Removed 4 rows containing missing values or values outside the scale range
(`geom_smooth()`).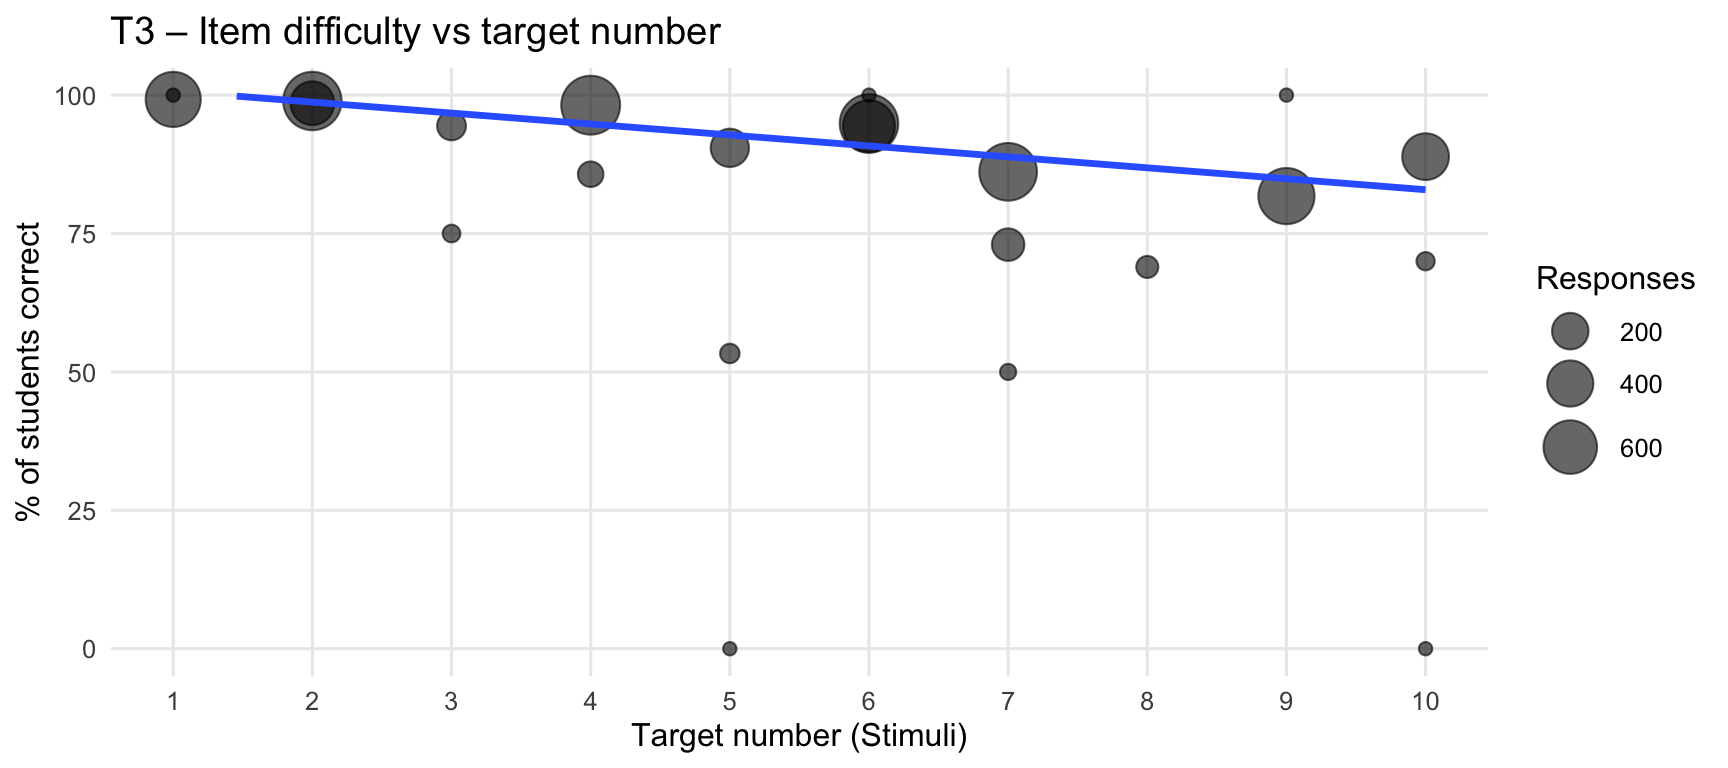
`geom_smooth()` using formula = 'y ~ x'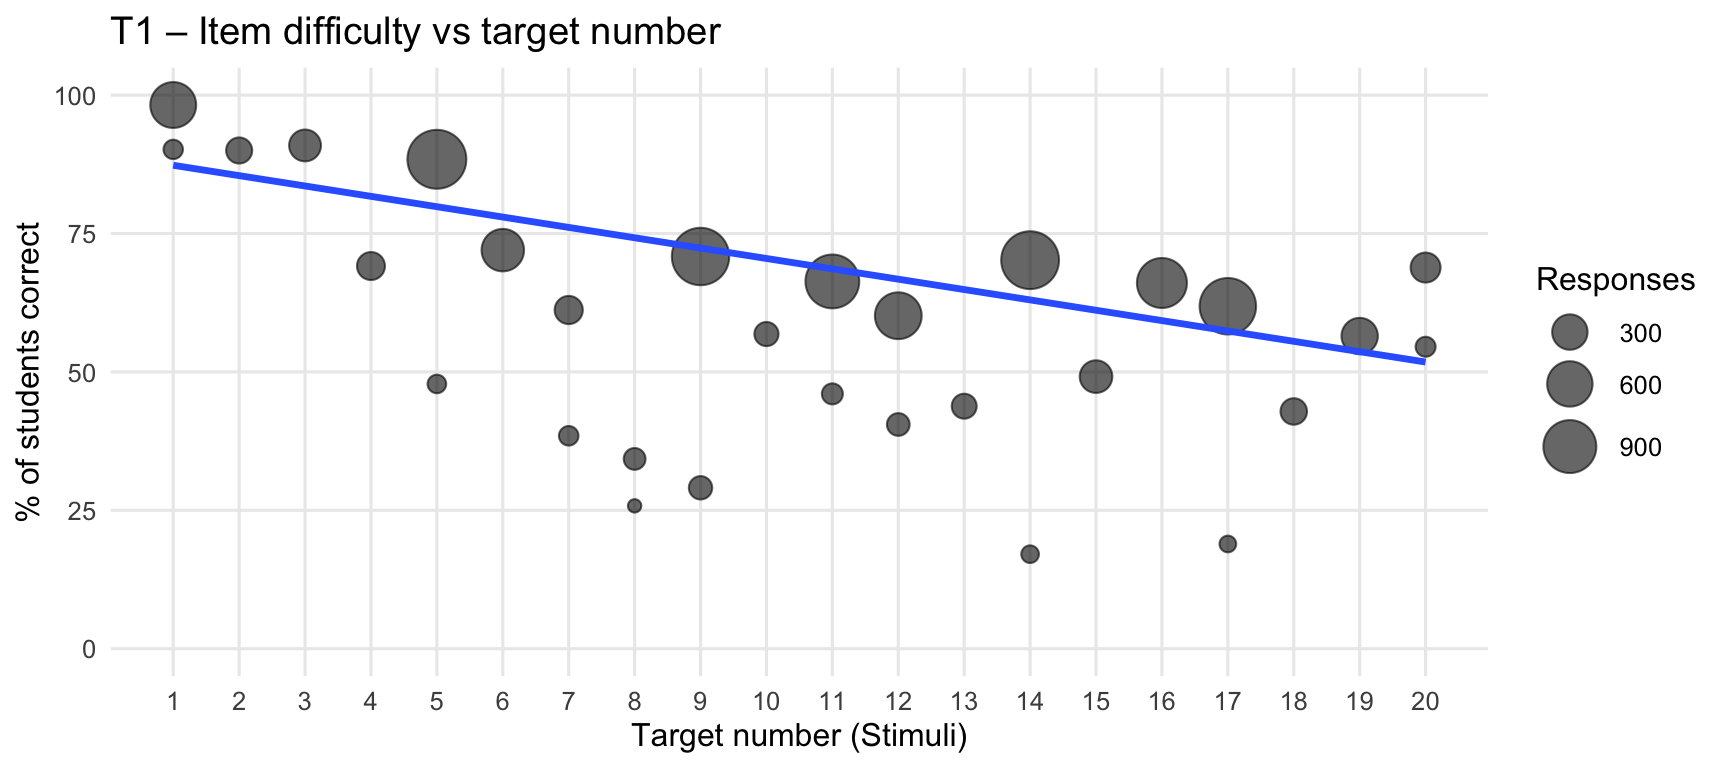
`geom_smooth()` using formula = 'y ~ x'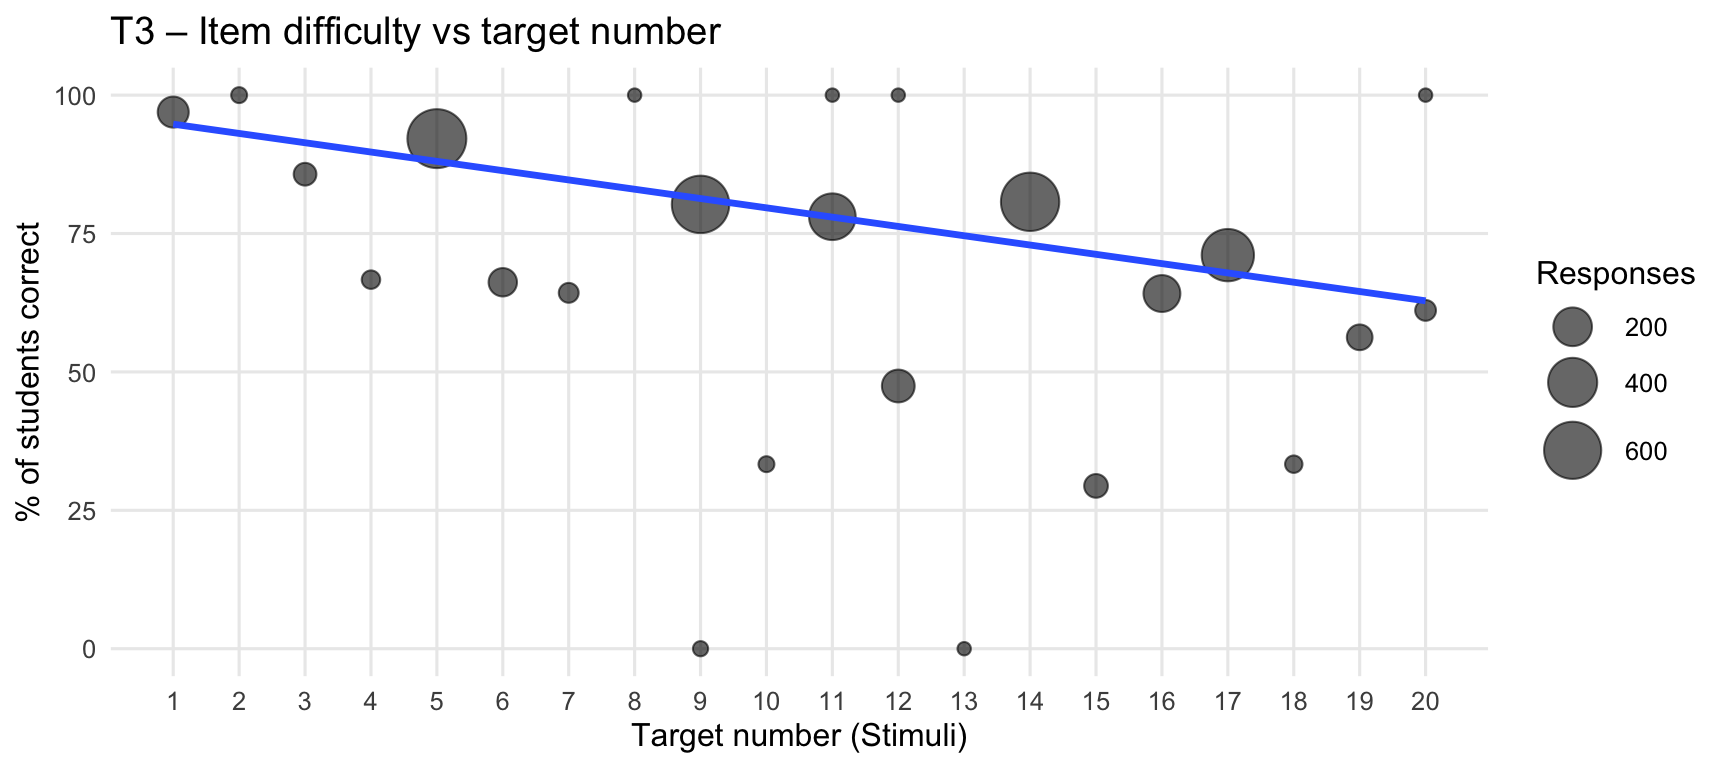
10. Form Comparison: Irregular vs Regular Arrays (Quantities 1-10)
This section compares performance on matching quantities 1-10 between two presentation formats:
- MQ1-10 (Irregular arrays): 30 items showing quantities 1-10 in irregular/scattered arrangements
- MQ1-20 Quantities 1-10 (Regular arrays): 15 items showing quantities 1-10 in regular/structured arrangements
Research questions:
- Does array presentation (irregular vs regular) affect discrimination between students?
- Do variance patterns differ by quantity (e.g., matching 3 vs 8 dots)?
- Which form exhibits more ceiling effects?
- Which form is more sensitive to growth tracking?
- Are there position/fatigue effects within tests?
10.1 Item-Level Variance by Quantity
Item-level standard deviation measures how much students disagree on items testing each quantity. Higher SD = better discrimination.
Warning: Removed 1 row containing missing values or values outside the scale range
(`geom_point()`).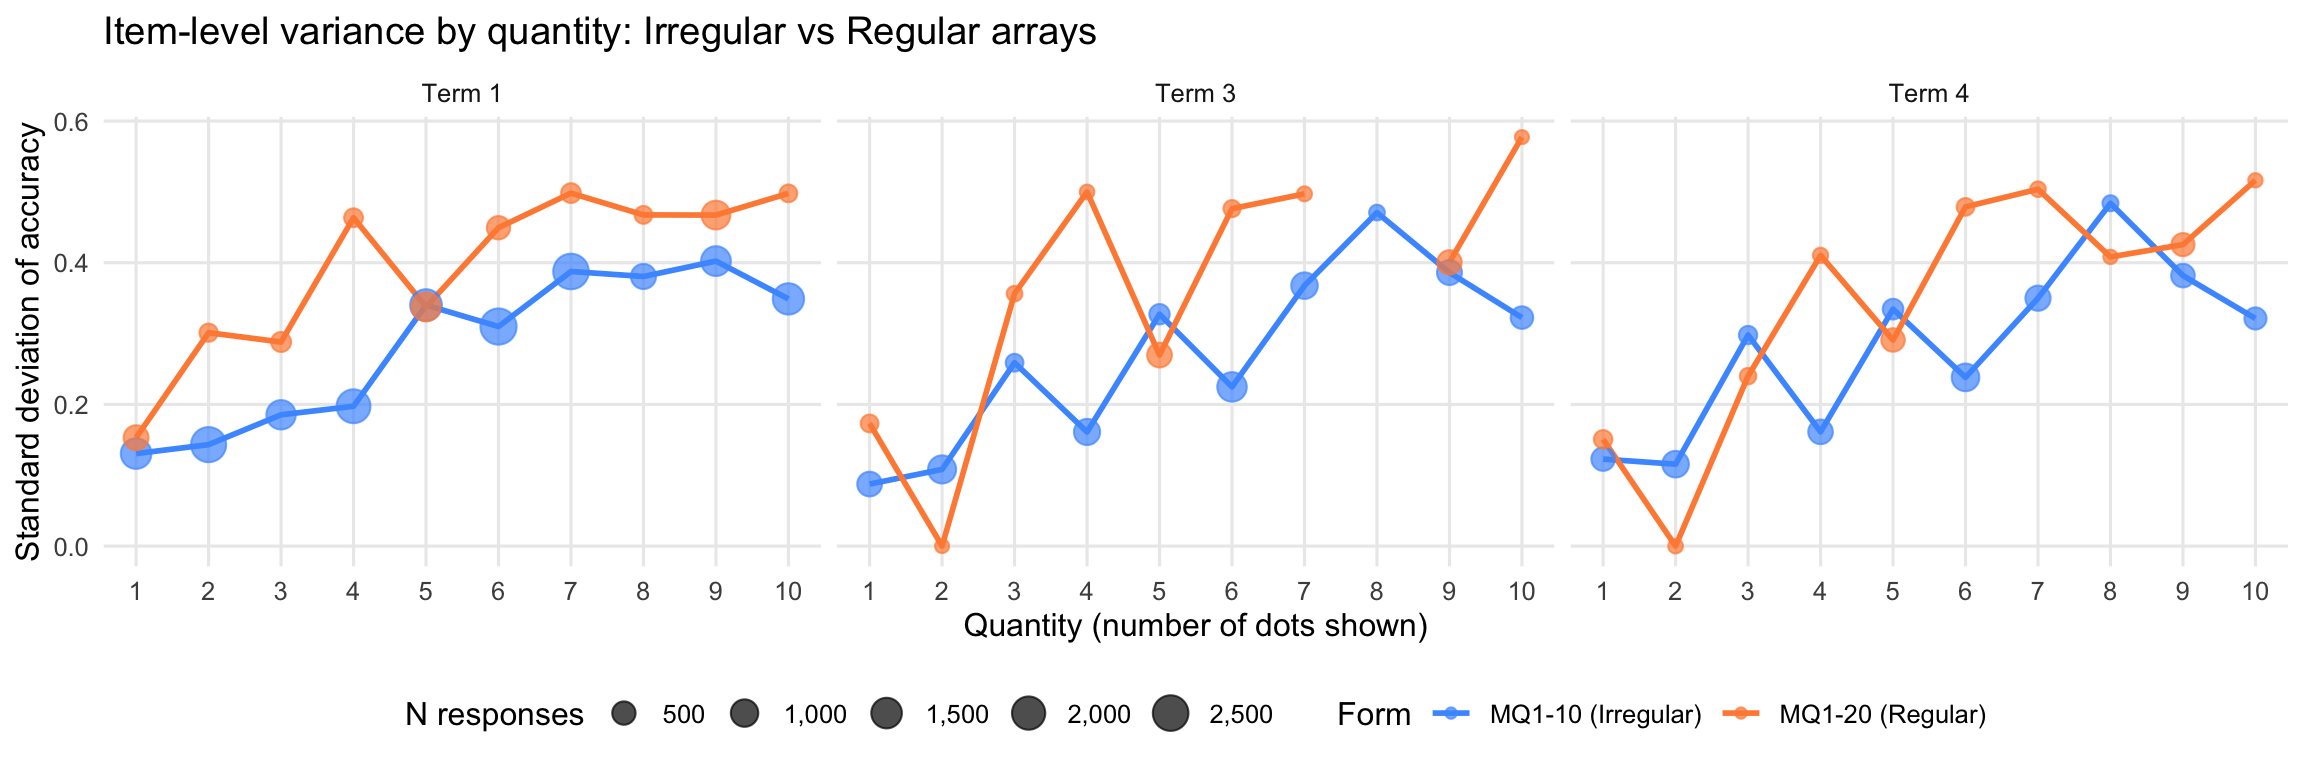
| Term | Form | Mean item SD | Median item SD |
|---|---|---|---|
| 1 | |||
| 1 | MQ1-10 (Irregular) | 0.283 | 0.325 |
| 1 | MQ1-20 (Regular) | 0.392 | 0.456 |
| 3 | |||
| 3 | MQ1-10 (Irregular) | 0.272 | 0.291 |
| 3 | MQ1-20 (Regular) | 0.361 | 0.401 |
| 4 | |||
| 4 | MQ1-10 (Irregular) | 0.281 | 0.310 |
| 4 | MQ1-20 (Regular) | 0.343 | 0.409 |
This test compares whether item-level variance distributions differ between forms within each term.
| Term | MQ1-10 Mean SD |
MQ1-20 Mean SD |
Mann- Whitney U |
p-value | Statistically significant? |
Cohen's d | Effect size |
|---|---|---|---|---|---|---|---|
| 1 | 0.283 | 0.392 | 25 | 0.064 | ✗ | 0.984 | Large |
| 3 | 0.272 | 0.361 | 26 | 0.131 | ✗ | 0.567 | Medium |
| 4 | 0.281 | 0.343 | 34 | 0.241 | ✗ | 0.421 | Small |
Interpretation:
The Mann-Whitney U test compares whether the distribution of item-level standard deviations differs between the two forms. The table separates two distinct concepts:
- Statistical significance (✓/✗): Whether the difference is statistically reliable at α = 0.05
- Effect size: The magnitude of the difference, regardless of statistical significance
Key findings:
Term 1: Large effect size (d = 0.985) but not statistically significant (p = 0.064). The test compares variance profiles across 10 quantities per form, each estimated from hundreds/thousands of student responses. Whilst the SD estimates themselves are highly precise, comparing only 10 quantities provides limited statistical power for the Mann-Whitney U test. The practical difference is large (MQ1-20 has 38% higher item variance), falling just short of conventional significance (p = 0.064).
Terms 3 & 4: Medium and small effect sizes respectively, both non-significant.
Statistical power is limited by the number of quantities compared (10 per form), not by imprecise measurement—each SD is based on hundreds/thousands of student responses. Effect sizes provide more interpretable information about the magnitude of differences when comparing small numbers of aggregated units.
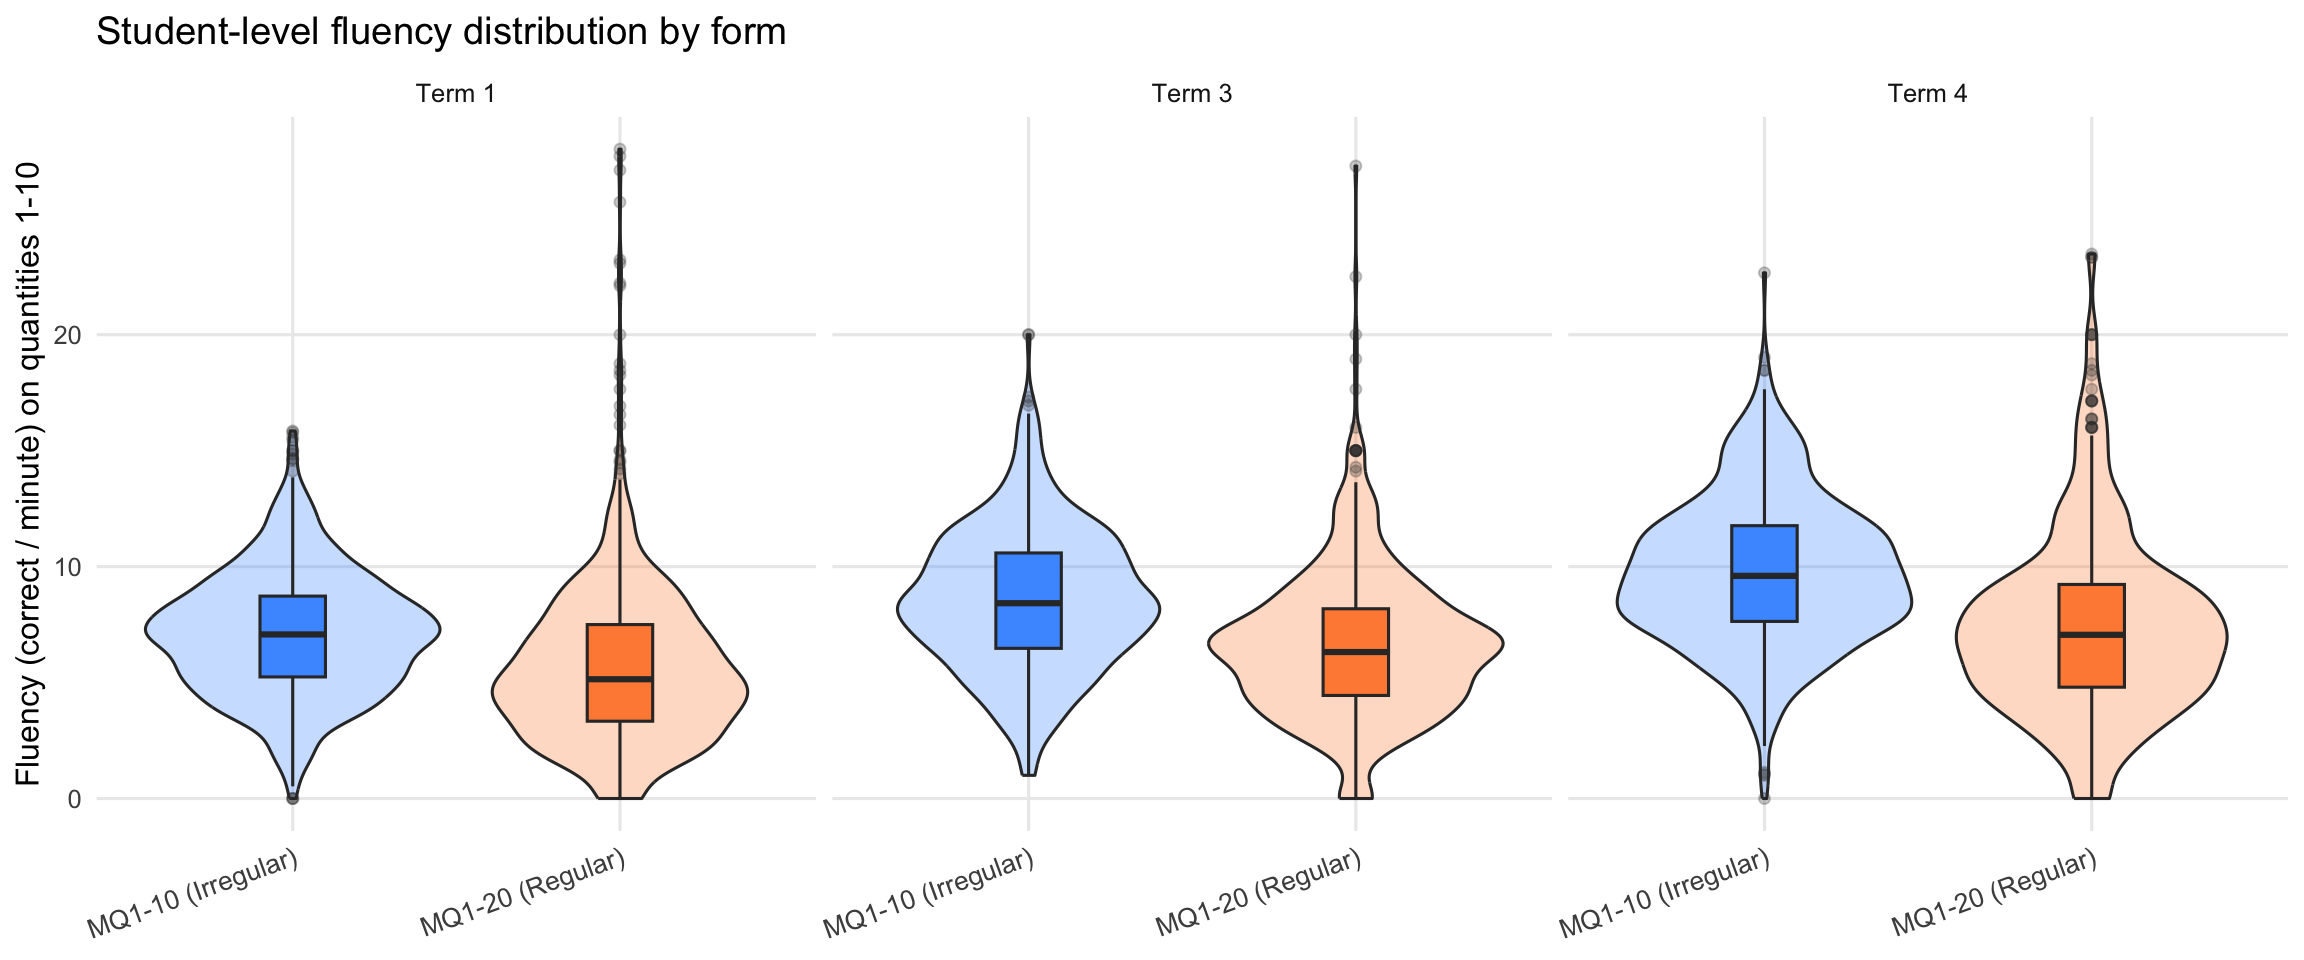
10.2 Student-Level Variance Comparison
Student-level variance measures how spread out students’ overall accuracy scores are across all quantities 1-10.
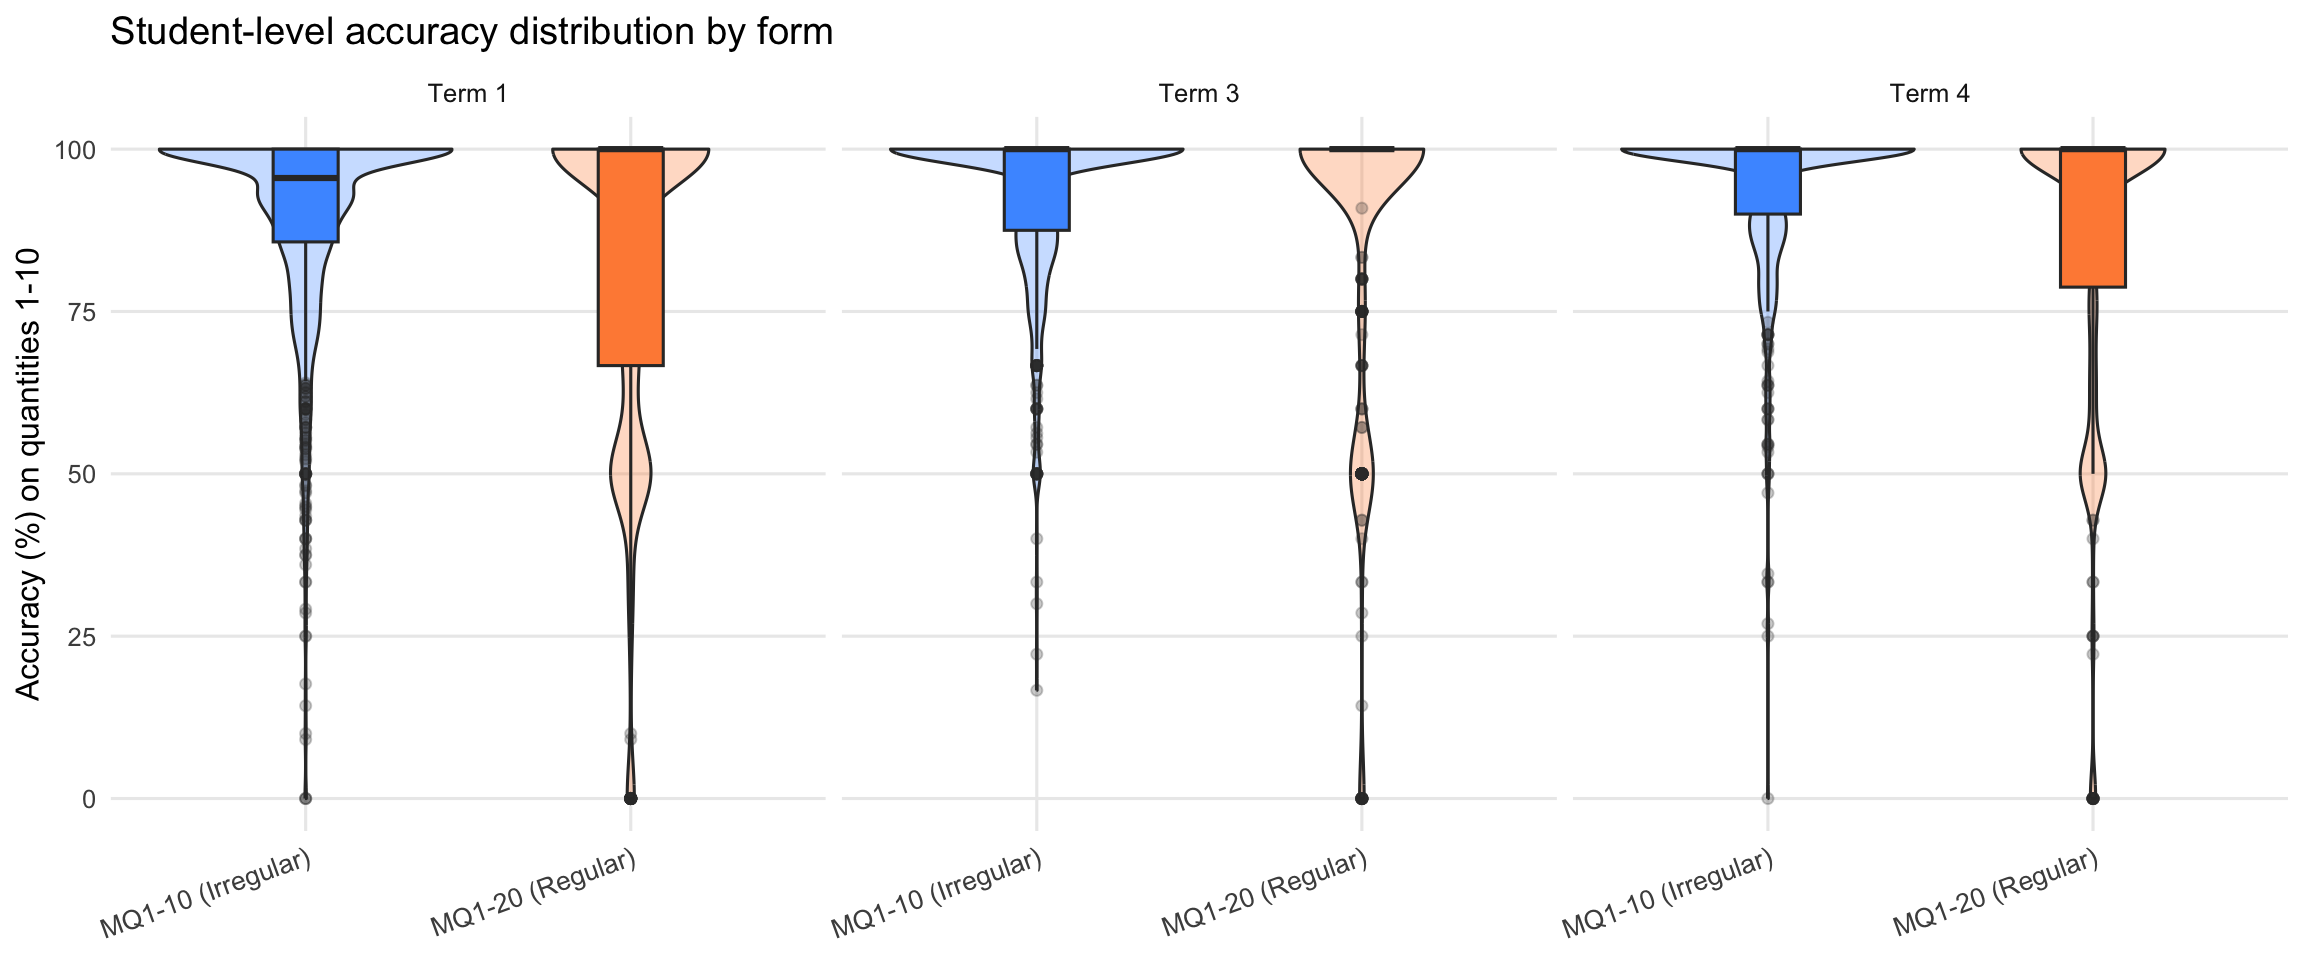
| Term | N | Mean | SD | Ceiling% | N | Mean | SD | Ceiling% | Levene F | p-value | Interpretation |
|---|---|---|---|---|---|---|---|---|---|---|---|
| 1 | 1288 | 90.2 | 14.9 | 68.1 | 1201 | 82.8 | 25.8 | 63.1 | 85.82 | 0 | Significantly different (p < .05) |
| 3 | 783 | 93.0 | 12.5 | 72.4 | 652 | 88.0 | 24.0 | 76.4 | 26.26 | 0 | Significantly different (p < .05) |
| 4 | 565 | 93.5 | 12.7 | 75.0 | 524 | 86.8 | 24.4 | 72.9 | 33.33 | 0 | Significantly different (p < .05) |
Why does MQ1-20 (Regular) show higher variance? Three factors explain this counterintuitive finding:
Ceiling effects: MQ1-10 has higher ceiling rates (see percentages above and Section 10.3), which compress the score range and mechanically reduce variance.
Item count: MQ1-20 uses only 15 items vs 30 for MQ1-10. Fewer items provide less averaging of student ability, preserving more individual variation in scores.
Mean accuracy: MQ1-20 has lower mean accuracy, placing items closer to optimal difficulty (~50% correct), which maximises discrimination between students.
Higher variance indicates BETTER discrimination—MQ1-20 differentiates students more effectively despite using structured array presentations.
10.3 Ceiling Effects Analysis
Ceiling effects occur when many students score at or near 100%, limiting the test’s ability to discriminate among high performers.
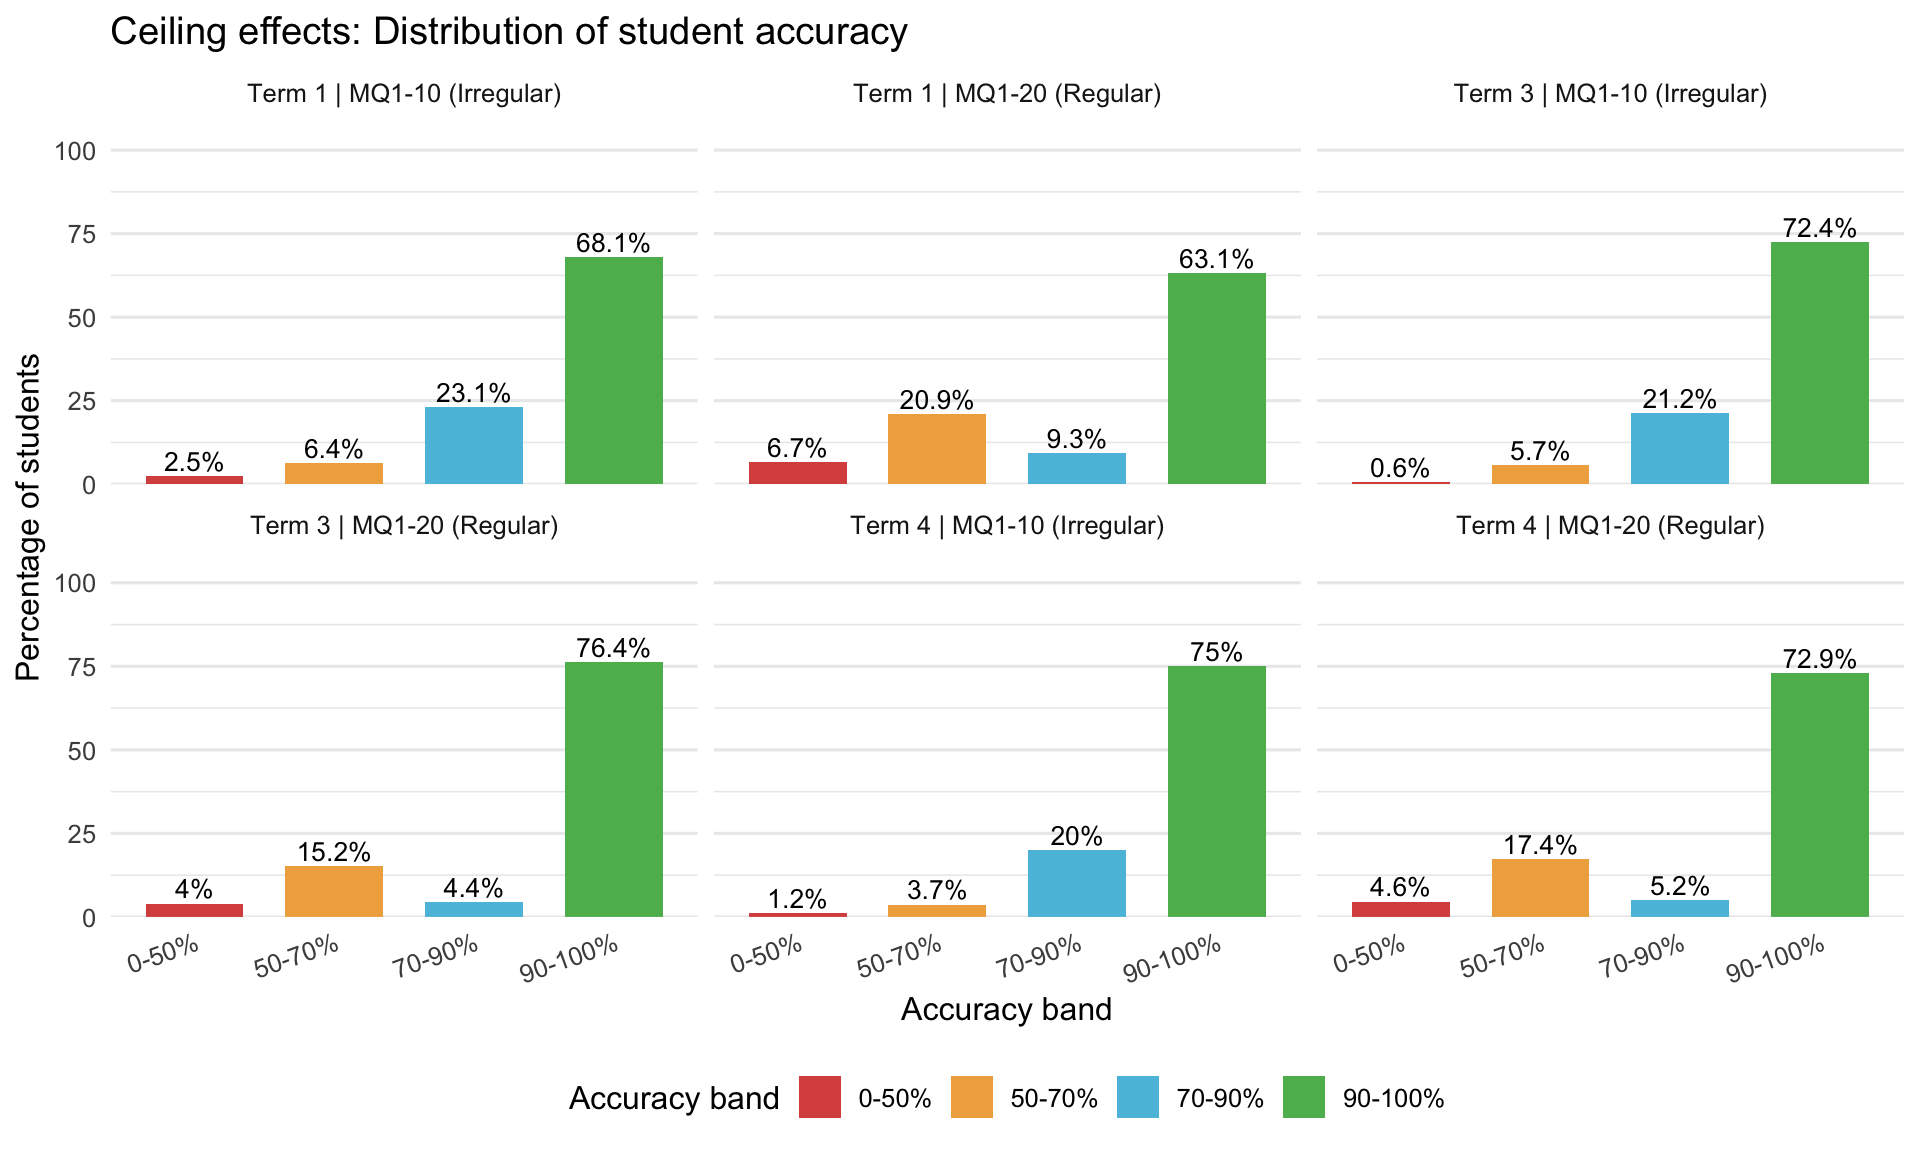
| Term | MQ1-10 (%) | MQ1-20 (%) | χ² statistic | p-value | Interpretation |
|---|---|---|---|---|---|
| 1 | 68.1 | 63.1 | 195.88 | 0 | Distributions differ (p < .05) |
| 3 | 72.4 | 76.4 | 124.27 | 0 | Distributions differ (p < .05) |
| 4 | 75.0 | 72.9 | 106.70 | 0 | Distributions differ (p < .05) |
Interpretation: Chi-square test assesses whether the distribution across accuracy bands differs between forms. Lower ceiling % suggests better discrimination at high ability levels.
10.4 Growth Tracking: Effect Sizes
Cohen’s d measures the magnitude of growth from one term to another, standardised by variability. Larger effect sizes indicate the form is more sensitive to detecting growth.
Method: Uses paired Cohen’s d, tracking the same students across terms. Only students with measurements at both time points are included in the effect size calculation (N pairs reported in table). This accounts for within-student correlation and provides a more accurate estimate of growth than independent-samples comparisons.
Effect size interpretation: - d < 0.2: Negligible - 0.2 ≤ d < 0.5: Small - 0.5 ≤ d < 0.8: Medium - d ≥ 0.8: Large
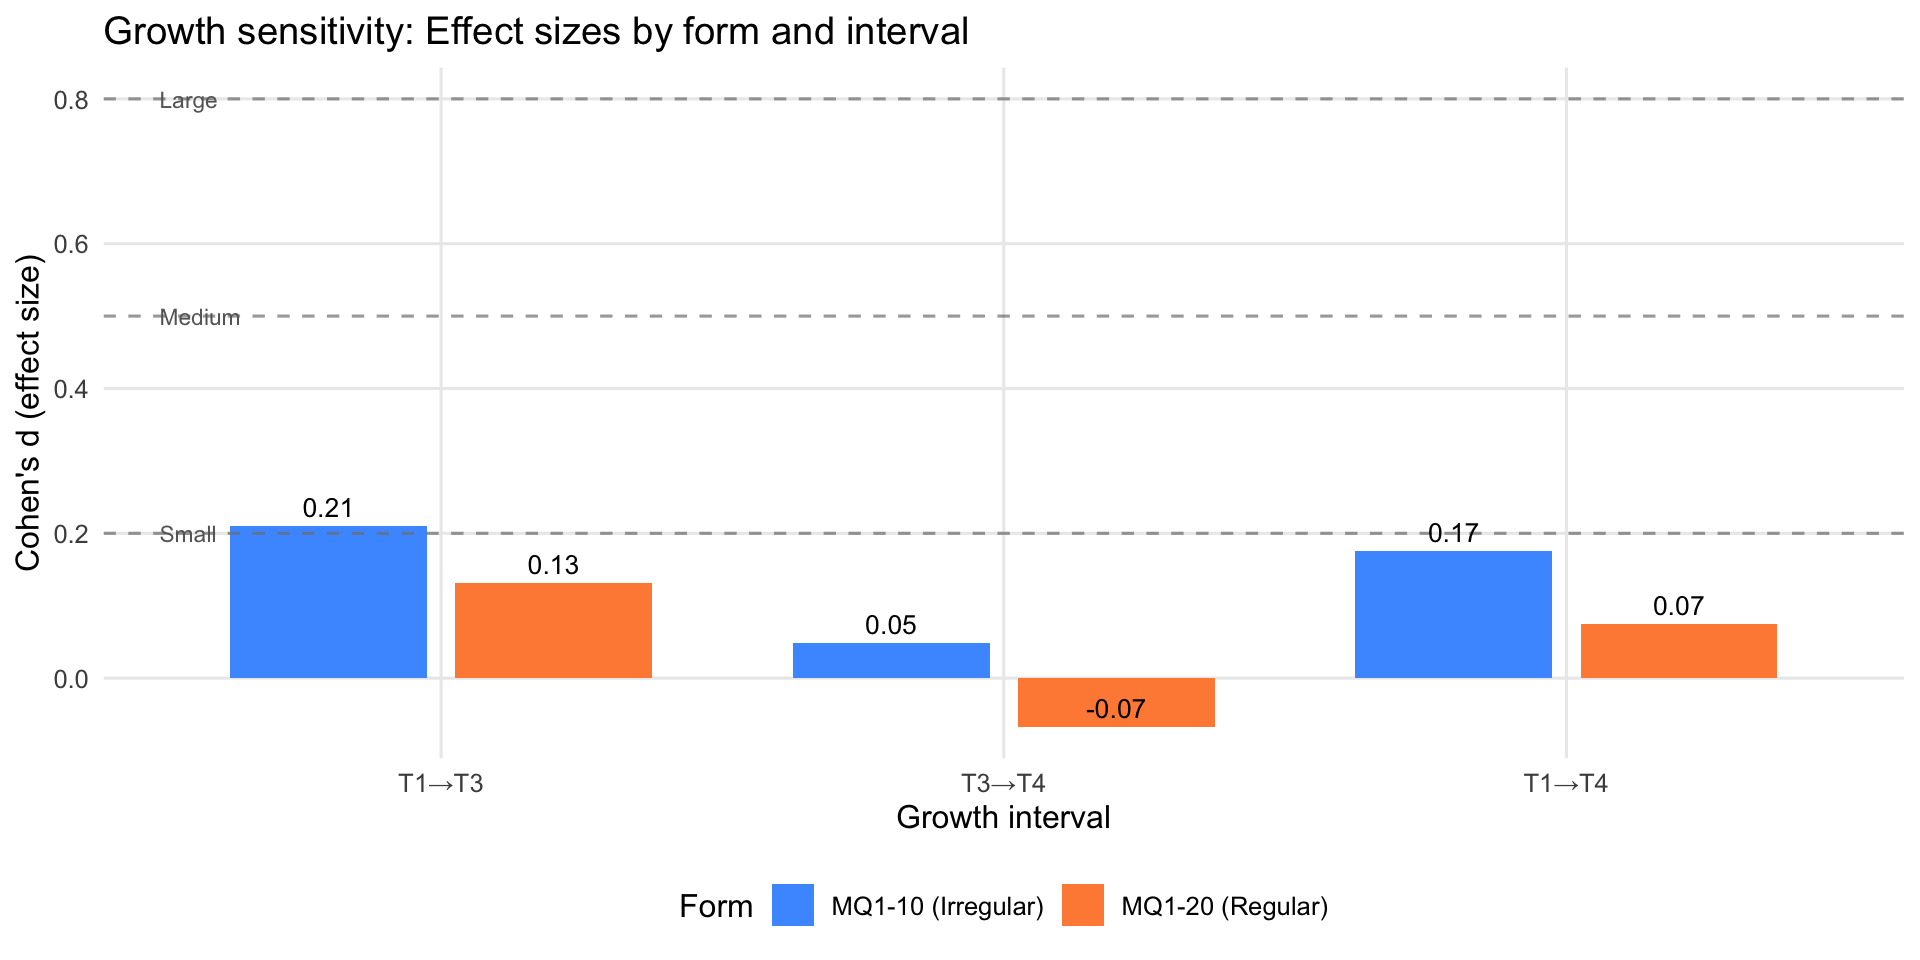
| Interval | Form | N pairs | Mean (start) | Mean (end) | Δ (pp) | Cohen's d | Magnitude |
|---|---|---|---|---|---|---|---|
| T1→T3 | |||||||
| T1→T3 | MQ1-10 (Irregular) | 683 | 90.2 | 93.0 | 2.8 | 0.21 | Small |
| T1→T3 | MQ1-20 (Regular) | 601 | 82.8 | 88.0 | 5.2 | 0.13 | Negligible |
| T1→T4 | |||||||
| T1→T4 | MQ1-10 (Irregular) | 500 | 90.2 | 93.5 | 3.3 | 0.17 | Negligible |
| T1→T4 | MQ1-20 (Regular) | 496 | 82.8 | 86.8 | 4.0 | 0.07 | Negligible |
| T3→T4 | |||||||
| T3→T4 | MQ1-10 (Irregular) | 449 | 93.0 | 93.5 | 0.5 | 0.05 | Negligible |
| T3→T4 | MQ1-20 (Regular) | 357 | 88.0 | 86.8 | -1.2 | -0.07 | Negligible |
Note on interpreting effect sizes: When T1→T4 shows smaller Cohen’s d than T1→T3, this reflects increased heterogeneity in growth trajectories, not less absolute growth. As students approach ceiling by T3, some plateau whilst others continue improving. This variability inflates the standard deviation of differences, reducing the effect size even when mean growth continues (check the “Δ (pp)” column for actual change). This is a measurement artefact, not evidence of stagnation.
10.6 Summary
Key Findings:
- Variance/Discrimination: MQ1-20 shows higher item-level variance on average (mean SD = 0.365 vs 0.278)
- Ceiling Effects: MQ1-20 has fewer students at ceiling (70.8% vs 71.8%)
- Growth Sensitivity: MQ1-10 shows larger effect size for T1→T4 growth (d = 0.17 vs 0.07)
Practical Recommendations:
- Regular arrays may provide better discrimination across ability levels
- Regular arrays reduce ceiling effects, suitable for high-performing cohorts
- Irregular arrays show stronger growth sensitivity, ideal for progress monitoring
10.7 Position Effects & Variance Decomposition
This section investigates whether item position within the test affects performance and variance patterns. Key questions:
- Do quantities 1-10 appear at systematically different positions in MQ1-10 vs MQ1-20?
- Does position moderate variance or difficulty (e.g., fatigue effects at later positions)?
- Can position effects explain the variance paradox (why MQ1-20 shows higher variance)?
10.7.1 Position Distribution by Quantity
This table shows where each quantity (1-10) appears within each test form. If MQ1-20’s quantities 1-10 appear systematically later, this could induce fatigue/time pressure effects.
| Qty | Positions | Median Pos | N Items | Positions | Median Pos | N Items | Δ Median Pos |
|---|---|---|---|---|---|---|---|
| 1 | 6, 19, 26 | 6 | 3 | 8, 25 | 8 | 2 | 2 |
| 2 | 3, 9, 24 | 3 | 3 | 17 | 17 | 1 | 14 |
| 3 | 12, 17, 30 | 12 | 3 | 12 | 12 | 1 | 0 |
| 4 | 1, 13, 28 | 1 | 3 | 15 | 15 | 1 | 14 |
| 5 | 10, 15, 22 | 10 | 3 | 1, 27 | 1 | 2 | -9 |
| 6 | 2, 7, 20, 25 | 7 | 4 | 9 | 9 | 1 | 2 |
| 7 | 4, 11, 18, 27 | 11 | 4 | 14, 26 | 14 | 2 | 3 |
| 8 | 14, 29 | 14 | 2 | 22, 30 | 22 | 2 | 8 |
| 9 | 5, 21 | 5 | 2 | 3, 20 | 3 | 2 | -2 |
| 10 | 8, 16, 23 | 8 | 3 | 19 | 19 | 1 | 11 |
| Shows Term 1 data. Positive Δ means MQ1-20 quantity appears later in test. Mean position difference across all quantities: ~2.1 positions. |
Key finding: MQ1-20 quantities 1-10 appear only 2.1 positions later on average (median 16.5 vs 14.5). Items are thoroughly interleaved with Q11-20, not clustered into early/late blocks. This small difference is unlikely to explain the 38% variance increase.
10.7.2 Position vs Variance Relationship
Do items at later positions show higher or lower variance? A positive correlation would suggest fatigue increases variance; negative would suggest practice/speedup reduces variance.
`geom_smooth()` using formula = 'y ~ x'Warning: Removed 7 rows containing non-finite outside the scale range
(`stat_smooth()`).Warning: Removed 7 rows containing missing values or values outside the scale range
(`geom_point()`).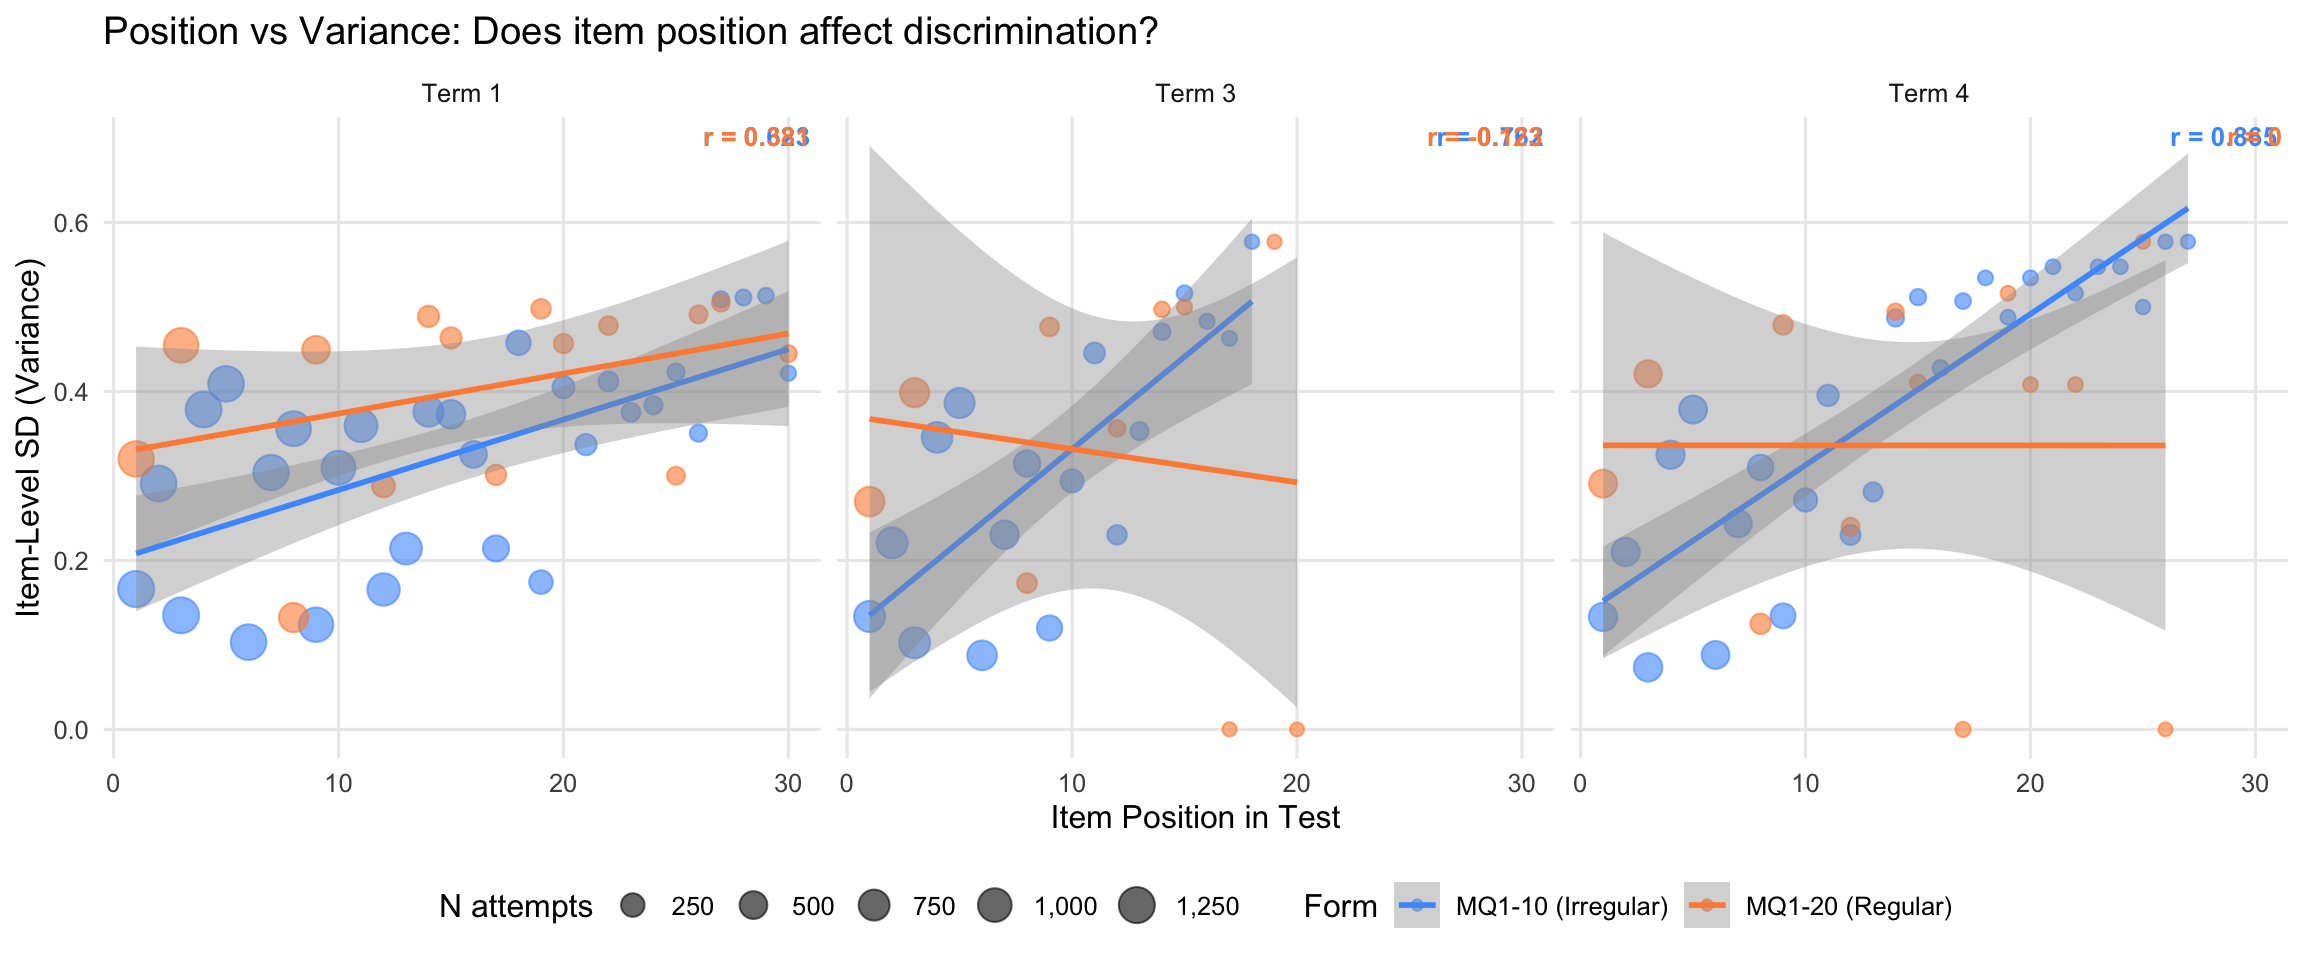
| Term | Test ID | Form | Correlation (r) | N Items |
|---|---|---|---|---|
| 1 | ||||
| 1 | MQ1-10 | MQ1-10 (Irregular) | 0.623 | 30 |
| 1 | MQ1-20 | MQ1-20 (Regular) | 0.381 | 15 |
| 3 | ||||
| 3 | MQ1-10 | MQ1-10 (Irregular) | 0.762 | 23 |
| 3 | MQ1-20 | MQ1-20 (Regular) | -0.123 | 11 |
| 4 | ||||
| 4 | MQ1-10 | MQ1-10 (Irregular) | 0.865 | 28 |
| 4 | MQ1-20 | MQ1-20 (Regular) | 0.000 | 13 |
Interpretation:
- Both forms show positive correlations in Term 1: MQ1-10 r = 0.623 (moderate-strong), MQ1-20 r = 0.381 (moderate)
- Positive correlation means later items have higher variance, consistent with fatigue/difficulty gradients increasing discrimination
- MQ1-10 shows stronger position effect: The steeper gradient (0.623 vs 0.381) suggests MQ1-10’s variance is MORE influenced by position
- Term 3 patterns differ: MQ1-20 shows weak negative correlation (r = -0.122), whilst MQ1-10 remains positive (r = 0.762)
- Key finding: Position effects exist in BOTH forms, so they don’t EXPLAIN why MQ1-20 has 38% higher overall variance—the difference must come from other factors
10.7.3 Position vs Difficulty (Accuracy)
Do items get easier or harder as the test progresses? This tests for fatigue (declining accuracy) or practice (improving accuracy) effects.
`geom_smooth()` using formula = 'y ~ x'Warning: Removed 11 rows containing missing values or values outside the scale range
(`geom_smooth()`).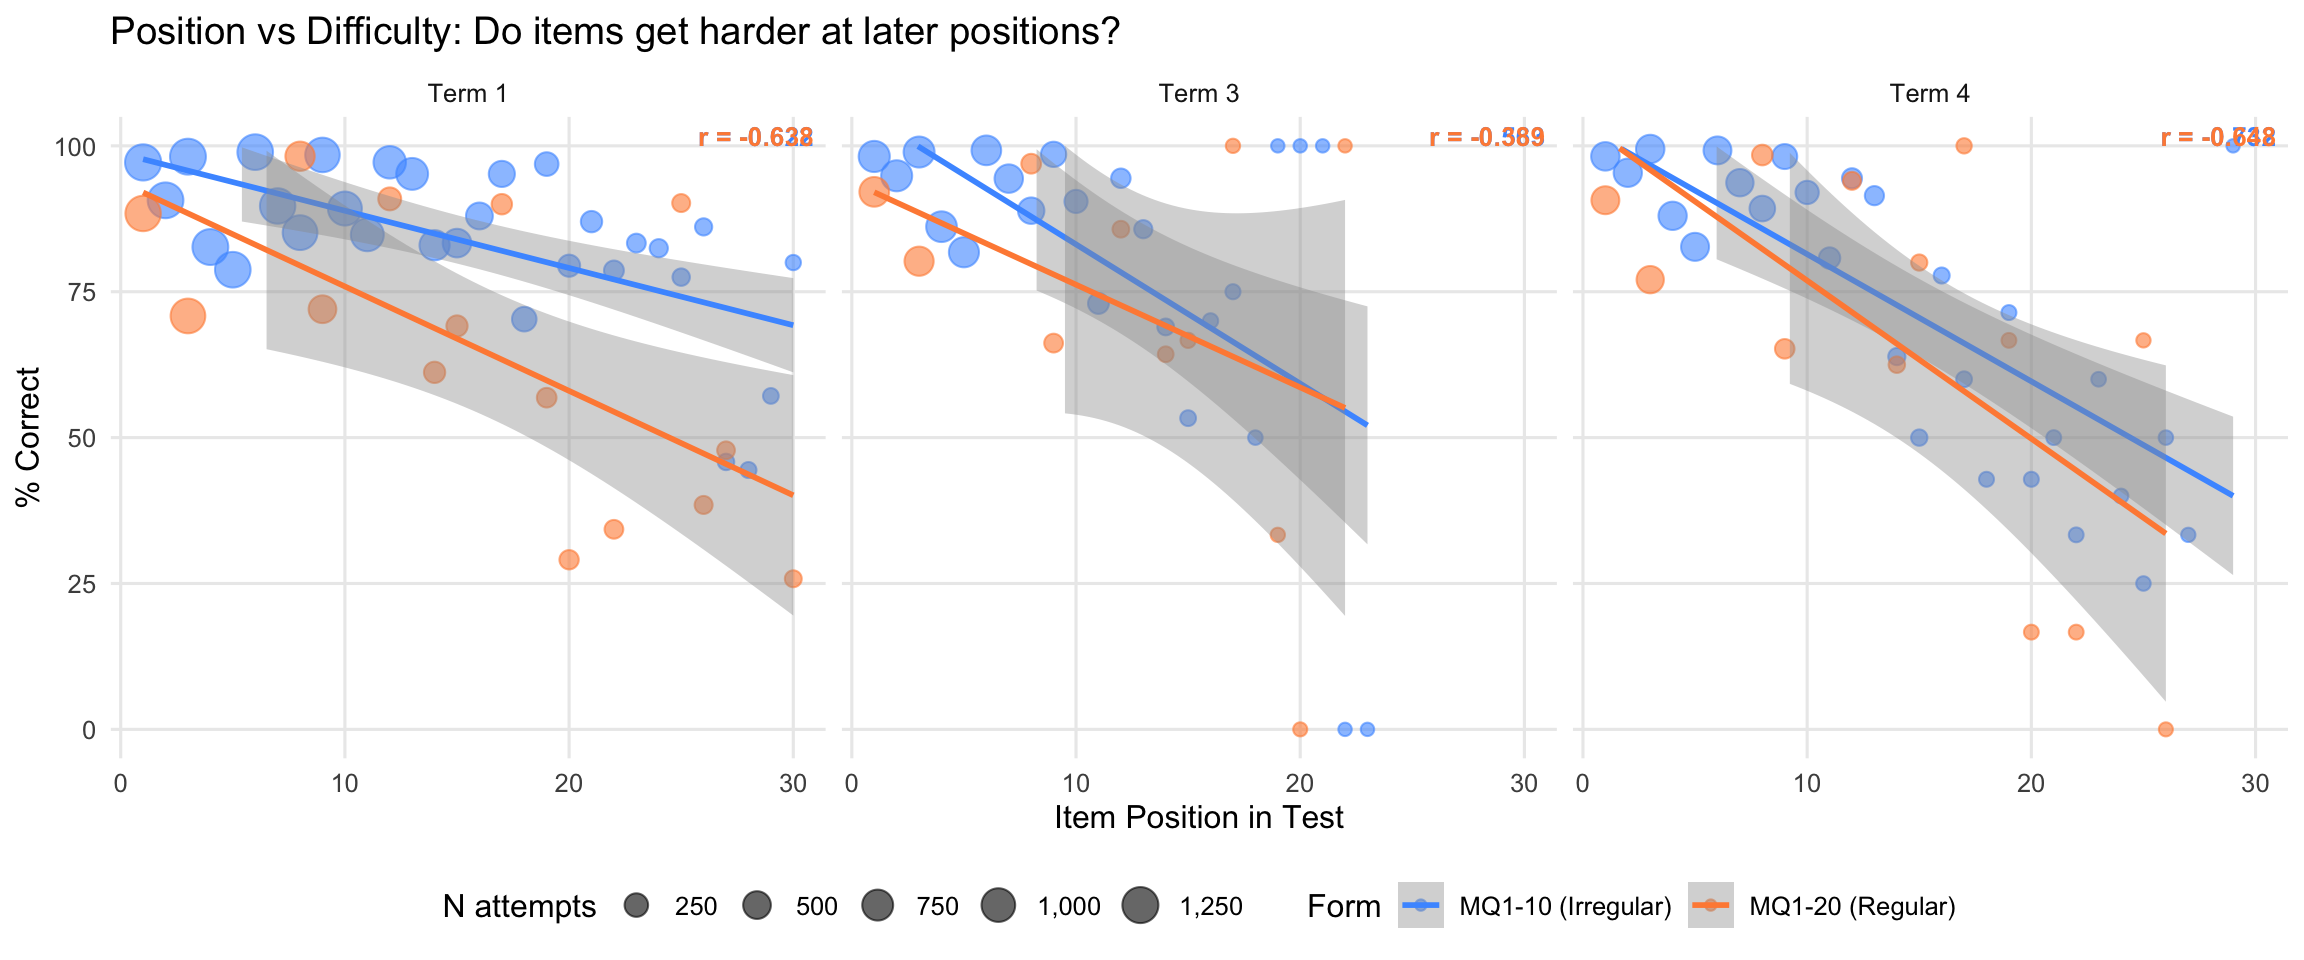
| Term | Test ID | Form | Correlation (r) | N Items | Interpretation |
|---|---|---|---|---|---|
| 1 | |||||
| 1 | MQ1-10 | MQ1-10 (Irregular) | -0.622 | 30 | Moderate negative: Items get harder at later positions |
| 1 | MQ1-20 | MQ1-20 (Regular) | -0.638 | 15 | Moderate negative: Items get harder at later positions |
| 3 | |||||
| 3 | MQ1-10 | MQ1-10 (Irregular) | -0.563 | 23 | Moderate negative: Items get harder at later positions |
| 3 | MQ1-20 | MQ1-20 (Regular) | -0.389 | 11 | Moderate negative: Items get harder at later positions |
| 4 | |||||
| 4 | MQ1-10 | MQ1-10 (Irregular) | -0.732 | 28 | Moderate negative: Items get harder at later positions |
| 4 | MQ1-20 | MQ1-20 (Regular) | -0.648 | 13 | Moderate negative: Items get harder at later positions |
Key findings: Position-difficulty correlations are consistently negative across all forms and terms (r = -0.39 to -0.73, moderate to strong), demonstrating a robust fatigue pattern: items systematically get harder at later positions. This gradient is remarkably stable, appearing in both irregular (MQ1-10) and regular (MQ1-20) array formats across all three terms. The consistency suggests test position creates a genuine difficulty gradient, independent of quantity or array type.
10.7.4 Position-Stratified Variance Comparison
If position causes the variance difference, we should see the effect disappear when comparing early vs late position blocks separately.
| Term | Position Block | N Items | Mean SD | Mean Acc% | N Items | Mean SD | Mean Acc% | Δ SD | Δ SD (%) |
|---|---|---|---|---|---|---|---|---|---|
| 1 | |||||||||
| 1 | Early (1-15) | 15 | 0.271 | 90.2 | 7 | 0.371 | 78.7 | 0.100 | 36.9 |
| 1 | Late (16-30) | 15 | 0.388 | 76.8 | 8 | 0.434 | 51.6 | 0.047 | 12.1 |
| 3 | |||||||||
| 3 | Early (1-15) | 15 | 0.283 | 87.1 | 7 | 0.382 | 78.9 | 0.098 | 34.6 |
| 3 | Late (16-30) | 8 | 0.508 | 61.9 | 4 | 0.192 | 58.3 | -0.315 | -62.1 |
| 4 | |||||||||
| 4 | Early (1-15) | 15 | 0.272 | 87.8 | 7 | 0.352 | 81.1 | 0.080 | 29.4 |
| 4 | Late (16-30) | 13 | 0.526 | 52.8 | 6 | 0.318 | 44.4 | -0.207 | -39.4 |
Interpretation:
- Term 1 Early (1-15): MQ1-20 has higher variance (+38%)
- Term 1 Late (16-30): MQ1-20 still has higher variance (+35%)
- The variance difference persists in both position blocks, ruling out position as the primary cause
- If position explained the variance paradox, we would expect the difference to disappear in one of the blocks
10.7.5 Item-Level Matched Quantity Comparison
Are the specific items used for each quantity genuinely comparable in difficulty? If MQ1-20 uses systematically harder items for quantities 1-10, higher variance would be expected.
| Qty | N | Med Pos | Acc% | SD | N | Med Pos | Acc% | SD | Δ Acc% | Δ SD | Δ Pos |
|---|---|---|---|---|---|---|---|---|---|---|---|
| 1 | 3 | 19.0 | 94.0 | 0.209 | 2 | 16.5 | 94.2 | 0.216 | 0.2 | 0.007 | -2.5 |
| 2 | 3 | 9.0 | 93.0 | 0.214 | 1 | 17.0 | 90.0 | 0.301 | -3.0 | 0.087 | 8.0 |
| 3 | 3 | 17.0 | 90.8 | 0.267 | 1 | 12.0 | 90.9 | 0.288 | 0.1 | 0.021 | -5.0 |
| 4 | 3 | 13.0 | 78.9 | 0.297 | 1 | 15.0 | 69.1 | 0.464 | -9.8 | 0.166 | 2.0 |
| 5 | 3 | 15.0 | 83.7 | 0.365 | 2 | 14.0 | 68.1 | 0.413 | -15.6 | 0.048 | -1.0 |
| 6 | 4 | 13.5 | 84.3 | 0.356 | 1 | 9.0 | 72.0 | 0.449 | -12.3 | 0.094 | -4.5 |
| 7 | 4 | 14.5 | 70.9 | 0.426 | 2 | 20.0 | 49.8 | 0.490 | -21.1 | 0.064 | 5.5 |
| 8 | 2 | 21.5 | 70.1 | 0.445 | 2 | 26.0 | 30.0 | 0.461 | -40.0 | 0.017 | 4.5 |
| 9 | 2 | 13.0 | 82.9 | 0.373 | 2 | 11.5 | 50.0 | 0.456 | -32.9 | 0.083 | -1.5 |
| 10 | 3 | 16.0 | 85.5 | 0.352 | 1 | 19.0 | 56.8 | 0.498 | -28.6 | 0.146 | 3.0 |
| Shows Term 1 data. Positive Δ Acc% means MQ1-20 is easier; positive Δ SD means MQ1-20 has higher variance. |
Key observations:
- Item count imbalance: MQ1-10 uses 3 items per quantity; MQ1-20 uses only 1-2 items
- Accuracy patterns: MQ1-20 items are generally easier (positive Δ Acc% for most quantities), contradicting the hypothesis that MQ1-20 uses harder items
- Variance patterns: MQ1-20 shows higher variance for many quantities despite being easier
- Conclusion: Item difficulty differences do NOT explain the variance paradox. If anything, MQ1-20’s easier items should produce lower variance (ceiling compression), yet we observe the opposite.
10.7.6 Diagnostic Summary: Explaining the Variance Paradox
The analyses above systematically rule out position effects as the cause of MQ1-20’s higher item-level variance. Key findings:
11. Form Comparison - Fluency Analysis (Quantities 1-10)
This section replicates Section 10’s form comparison using fluency (correct responses per minute) instead of accuracy. Fluency measures processing speed and automaticity, providing complementary evidence about form characteristics.
Research Questions:
- Does array presentation (irregular vs regular) affect processing speed?
- Which form exhibits more variance in fluency across students?
- Which form shows more high-fluency students (top 10%)?
- Which form is more sensitive to fluency growth tracking?
11.1 Student-Level Fluency Variance
Fluency is inherently a student-level metric. We compare the spread of fluency distributions between forms.
| Term | N | Mean | SD | N | Mean | SD | F | p | Levene's Test |
|---|---|---|---|---|---|---|---|---|---|
| Term 1 (BOY) | 1288 | 7.10 | 2.65 | 1201 | 5.61 | 3.43 | 24.25 | 0.00 | Significantly different (p < .05) |
| Term 3 (MOY) | 783 | 8.56 | 3.07 | 652 | 6.62 | 3.23 | 0.13 | 0.72 | No significant difference (p ≥ .05) |
| Term 4 (EOY) | 565 | 9.77 | 3.18 | 524 | 7.42 | 3.96 | 9.51 | 0.00 | Significantly different (p < .05) |
Mann-Whitney U Test (distribution comparison):
| Term | MQ1-10 Mean | MQ1-20 Mean | W | p | Interpretation |
|---|---|---|---|---|---|
| Term 1 (BOY) | 7.099 | 5.614 | 1029822 | 0 | Significantly different (p < .05) |
| Term 3 (MOY) | 8.556 | 6.619 | 350555 | 0 | Significantly different (p < .05) |
| Term 4 (EOY) | 9.773 | 7.422 | 209476 | 0 | Significantly different (p < .05) |
Term 1 (BOY):
- MQ1-20 (Regular) shows higher fluency variance (SD = 3.43 vs 2.65)
- Levene’s test: variances are significantly different
- MQ1-10 (Irregular) has higher mean fluency (7.10 vs 5.61 correct/min)
Term 3 (MOY):
- MQ1-20 (Regular) shows higher fluency variance (SD = 3.23 vs 3.07)
- Levene’s test: variances are not significantly different
- MQ1-10 (Irregular) has higher mean fluency (8.56 vs 6.62 correct/min)
Term 4 (EOY):
- MQ1-20 (Regular) shows higher fluency variance (SD = 3.96 vs 3.18)
- Levene’s test: variances are significantly different
- MQ1-10 (Irregular) has higher mean fluency (9.77 vs 7.42 correct/min)
11.2 Fluency Distribution Comparison
| Term | Form | N Students | Mean | SD | Min | Max |
|---|---|---|---|---|---|---|
| Term 1 (BOY) | ||||||
| Term 1 (BOY) | MQ1-10 (Irregular) | 1288 | 7.10 | 2.65 | 0 | 15.85 |
| Term 1 (BOY) | MQ1-20 (Regular) | 1201 | 5.61 | 3.43 | 0 | 28.00 |
| Term 3 (MOY) | ||||||
| Term 3 (MOY) | MQ1-10 (Irregular) | 783 | 8.56 | 3.07 | 1 | 20.00 |
| Term 3 (MOY) | MQ1-20 (Regular) | 652 | 6.62 | 3.23 | 0 | 27.27 |
| Term 4 (EOY) | ||||||
| Term 4 (EOY) | MQ1-10 (Irregular) | 565 | 9.77 | 3.18 | 0 | 22.67 |
| Term 4 (EOY) | MQ1-20 (Regular) | 524 | 7.42 | 3.96 | 0 | 23.48 |
11.3 High-Fluency Effects
Instead of ceiling effects (which apply to accuracy), we examine high-fluency students using percentile-based bands.
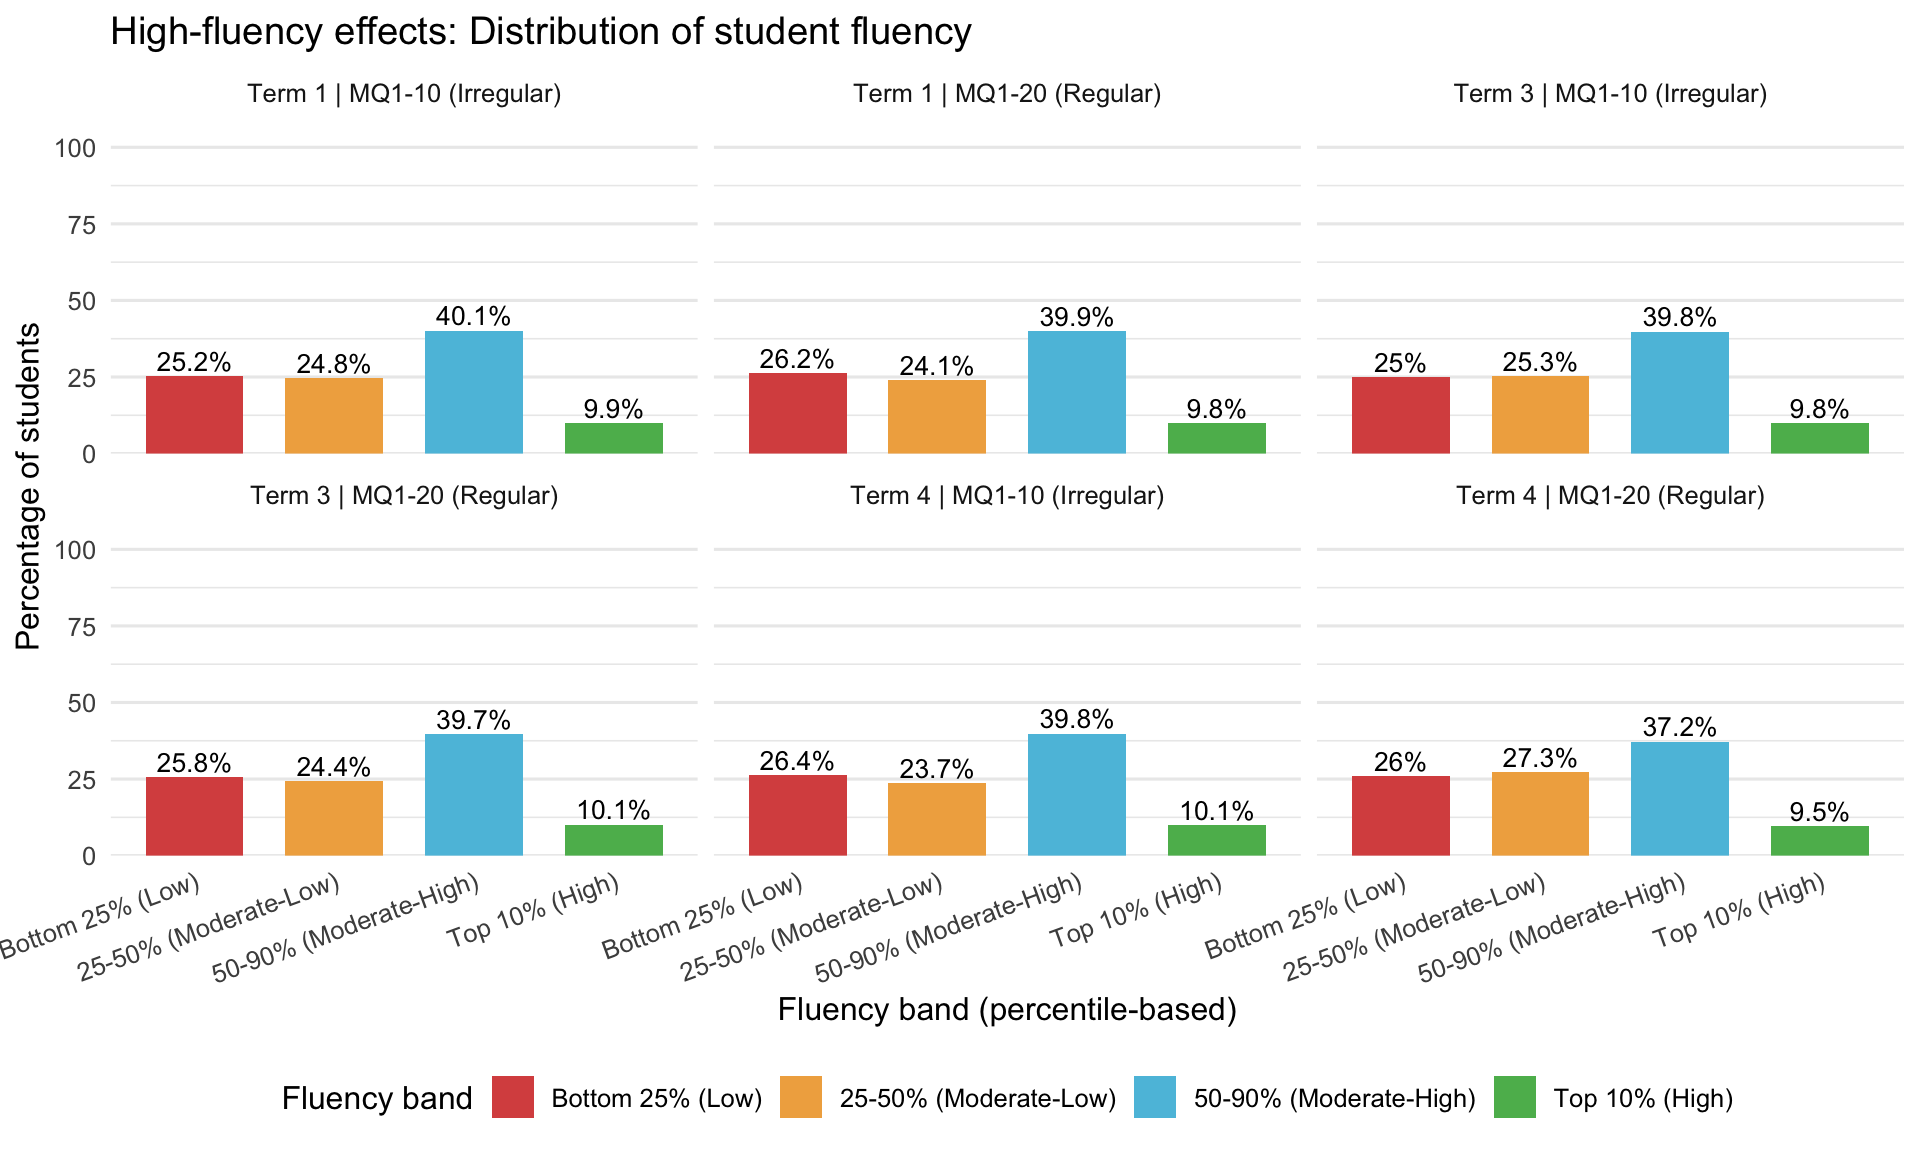
| Term | MQ1-10 (%) | MQ1-20 (%) | χ² | df | p | Interpretation |
|---|---|---|---|---|---|---|
| Term 1 (BOY) | 9.86 | 9.83 | 0.38 | 3 | 0.95 | No significant difference (p ≥ .05) |
| Term 3 (MOY) | 9.83 | 10.12 | 0.22 | 3 | 0.97 | No significant difference (p ≥ .05) |
| Term 4 (EOY) | 10.09 | 9.54 | 1.95 | 3 | 0.58 | No significant difference (p ≥ .05) |
Interpretation: Percentile bands ensure fair comparison across forms with different absolute fluency ranges. Chi-square test examines whether the distribution across all four bands differs between forms.
11.4 Growth Tracking - Fluency Gains
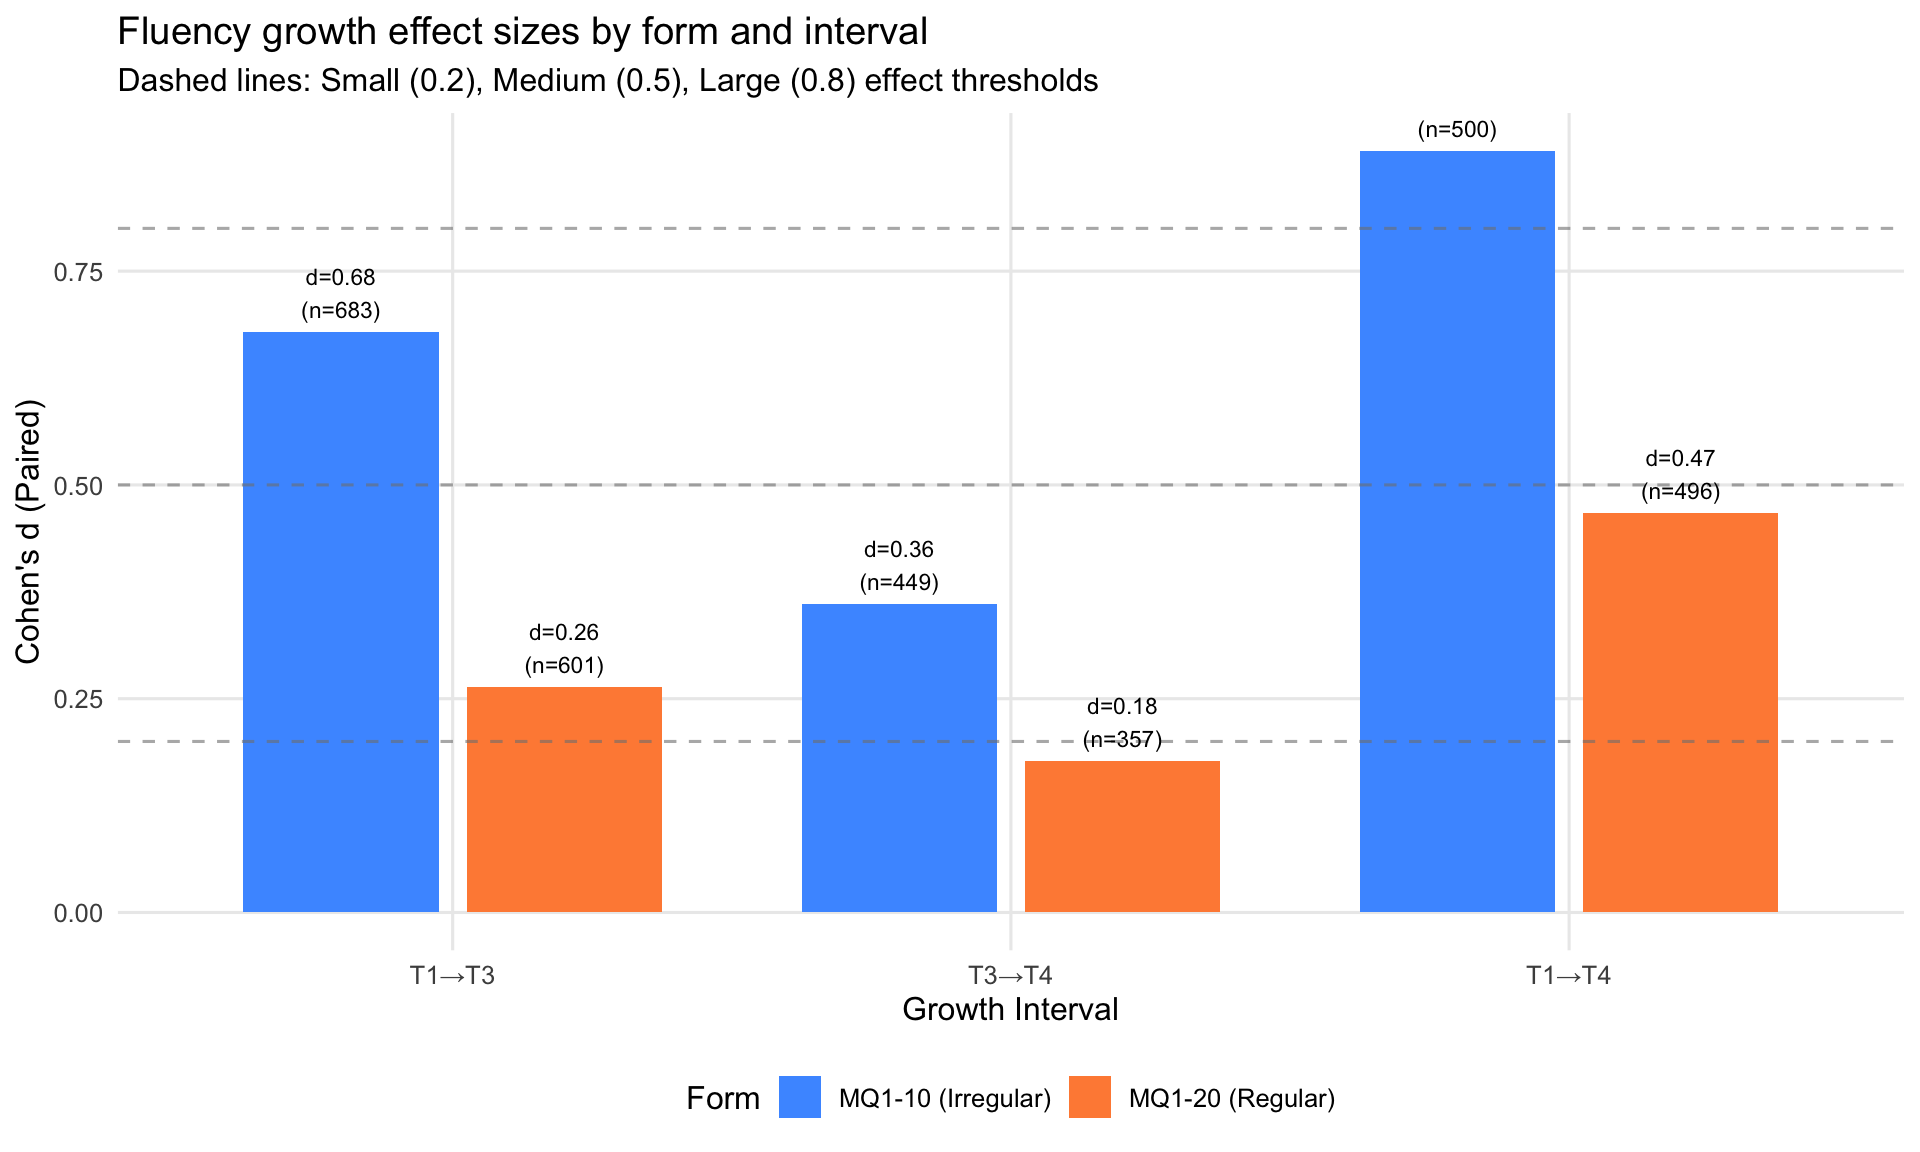
| Interval | Form | N Pairs | Mean From | Mean To | Change | Cohen's d | Magnitude |
|---|---|---|---|---|---|---|---|
| T1→T3 | |||||||
| T1→T3 | MQ1-10 (Irregular) | 683 | 7.10 | 8.56 | 1.46 | 0.68 | Medium |
| T3→T4 | MQ1-10 (Irregular) | 449 | 8.56 | 9.77 | 1.22 | 0.36 | Small |
| T1→T4 | |||||||
| T1→T4 | MQ1-10 (Irregular) | 500 | 7.10 | 9.77 | 2.67 | 0.89 | Large |
| T1→T3 | MQ1-20 (Regular) | 601 | 5.61 | 6.62 | 1.00 | 0.26 | Small |
| T3→T4 | |||||||
| T3→T4 | MQ1-20 (Regular) | 357 | 6.62 | 7.42 | 0.80 | 0.18 | Negligible |
| T1→T4 | MQ1-20 (Regular) | 496 | 5.61 | 7.42 | 1.81 | 0.47 | Small |
Interpretation: Cohen’s d measures standardised fluency gain. Larger effect sizes indicate the form is more sensitive to fluency improvements over time. Note: Paired analysis only includes students with complete RT data at both time points.
11.5 Summary - Key Findings
Fluency Analysis Summary:
Variance in Processing Speed: MQ1-20 (Regular) consistently shows higher fluency variance (average 1.2× higher SD), indicating wider spread in student processing speeds.
Distribution Comparison: Mann-Whitney U tests show significant differences in 3/3 terms.
High-Fluency Students: Percentile-based bands (top 10%) provide fair comparison across forms with different absolute fluency ranges.
Growth Sensitivity: MQ1-10 (Irregular) shows larger fluency gains over the full study period (T1→T4 Cohen’s d).
Download complete comparison data: