Analysing end of year outcome data
PAT scores, teacher ratings, and end-of-year risk classification
1 Data Sources & Quality Overview
This report starts with coverage: who has PAT data, who has teacher ratings, and where the two sources overlap. The synthesis outcome (η) is introduced after the individual evidence sources are shown.
The Sparse Data Challenge
Most students have only teacher ratings and no PAT. That makes η estimation fundamentally an evidence synthesis problem: PAT is a strong ruler but sparse; ratings are widespread but noisy.
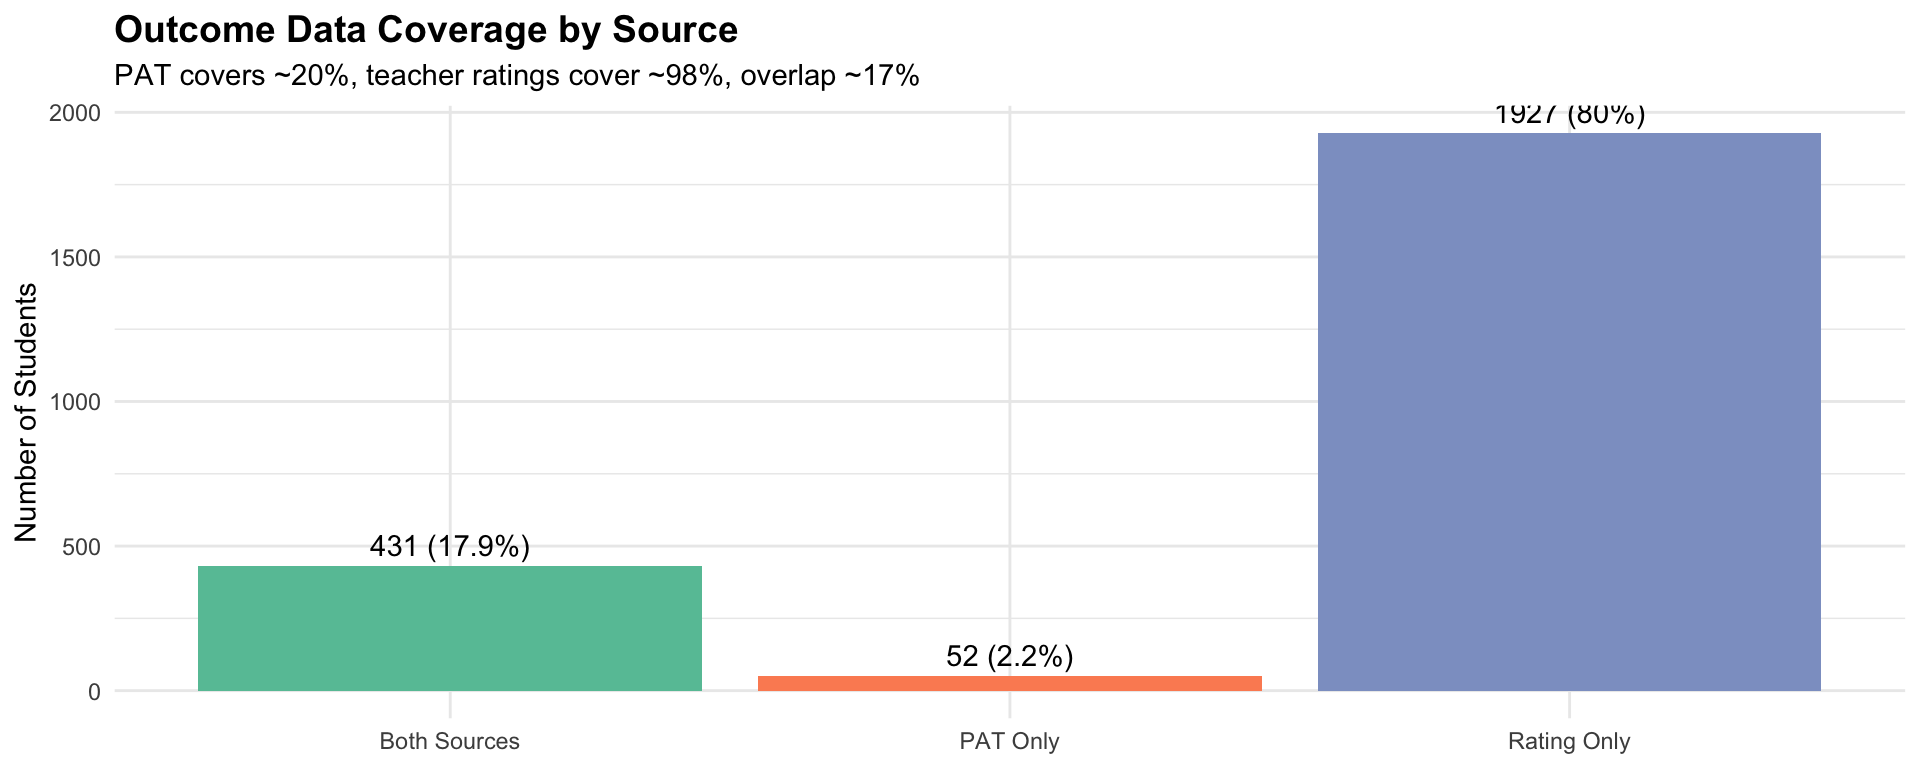
The Problem: How do we create a unified risk metric when: - PAT scores (standardised tests) cover only ~20% of students - Teacher ratings cover ~98% but are ordinal and subject to rater bias - Only ~17% have both sources for cross-validation
Data Sources
PAT: Standardised mathematics assessments developed by ACER. Two variants in this study:
- PAT Early Years (Foundation): Reference-group normed (self-selecting schools)
- PAT Maths 4th Edition (Year 1): Nationally normed (2022 Australian norms)
Strengths: Objective and standardised; interval scale (differences meaningful); established norms (Year 1: μ=99.5, σ=11.4); conditional standard errors.
Limitations: Low coverage (~20%); timing heterogeneity (6-month window); Foundation uses self-selecting reference groups; PAT variants may not be perfectly comparable.
Data collection context: Schools collected PAT data at different frequencies based on existing practices — some not at all, some once per year, others twice. Multiple PAT versions in use. The Janison system initially created one set of fields, then added EOY-prefixed fields. “Occasion 1” and “Occasion 2” refer to chronological order based on actual testing dates, not field names.
Teacher achievement ratings: 5-point ordinal scale (1=Well below expected, 5=Well above expected).
Strengths: High coverage (~98%); classroom context (multiple observations over time); holistic judgement beyond test performance.
Limitations: Ordinal scale (not interval); rater severity bias (ICC ≈ 0.20, ~20% of variance is school-level); subjective (within-class comparisons, not national norms).
The report uses three groups of outcome information:
- PAT records: PAT type, testing date, scaled score, and percentile rank.
- Teacher ratings: a 1-5 ordinal end-of-year achievement judgement.
- Student/school context: year level and school grouping, used to summarise coverage and account for clustering.
Coverage & Completeness
| source_flag | foundation | year1 | total |
|---|---|---|---|
| Both | 171 | 260 | 431 |
| PAT_only | 32 | 20 | 52 |
| Rating_only | 965 | 962 | 1927 |
NoteData Quality Issues & Cleaning Rules
| Issue | Details | Cleaning Rule |
|---|---|---|
| Placeholder scores | Scores of 0 or 1 (implausible for PAT ~50-150) | Convert to NA |
| PAT type discrepancy | Valid score but type blank/wrong | Override to “PAT type missing”, flag |
| Percentile formatting | Mixed: “43”, “24th”, “6th” | Strip non-numeric suffix |
| Date formatting | 5+ formats including timestamps and month-only | Multi-format parse via lubridate |
| Ambiguous dates | ~39% of dates have day and month ≤12 | Assume d/m/Y (Australian). 485 unambiguous dates support this. |
| Month-only (no year) | 29 records | Impute year from cohort modal (n≥3) |
| Month-only (with year) | No day | Impute day from cohort mean (n≥5, else 15th) |
| Suspect dates | 1900/2015 typos, future dates | Flag, set date = NA |
| Score/percentile mismatch | 189 records missing one | Flag |
Data processing via R/clean_outcome_data.R. Date imputation salvaged 18 of 29 month-only records.
Timing Uncertainty
We do not project growth from earlier PAT administrations. Instead, earlier tests carry more uncertainty about end-of-year attainment, implemented as a variance inflation term proportional to time distance.
The following sections look first at PAT evidence, then teacher-rating evidence, and then the overlap between the two sources.
2 Data Exploration
Each sub-section concludes with a practical implication for how the two outcome sources are interpreted and combined.
Outcome Distributions
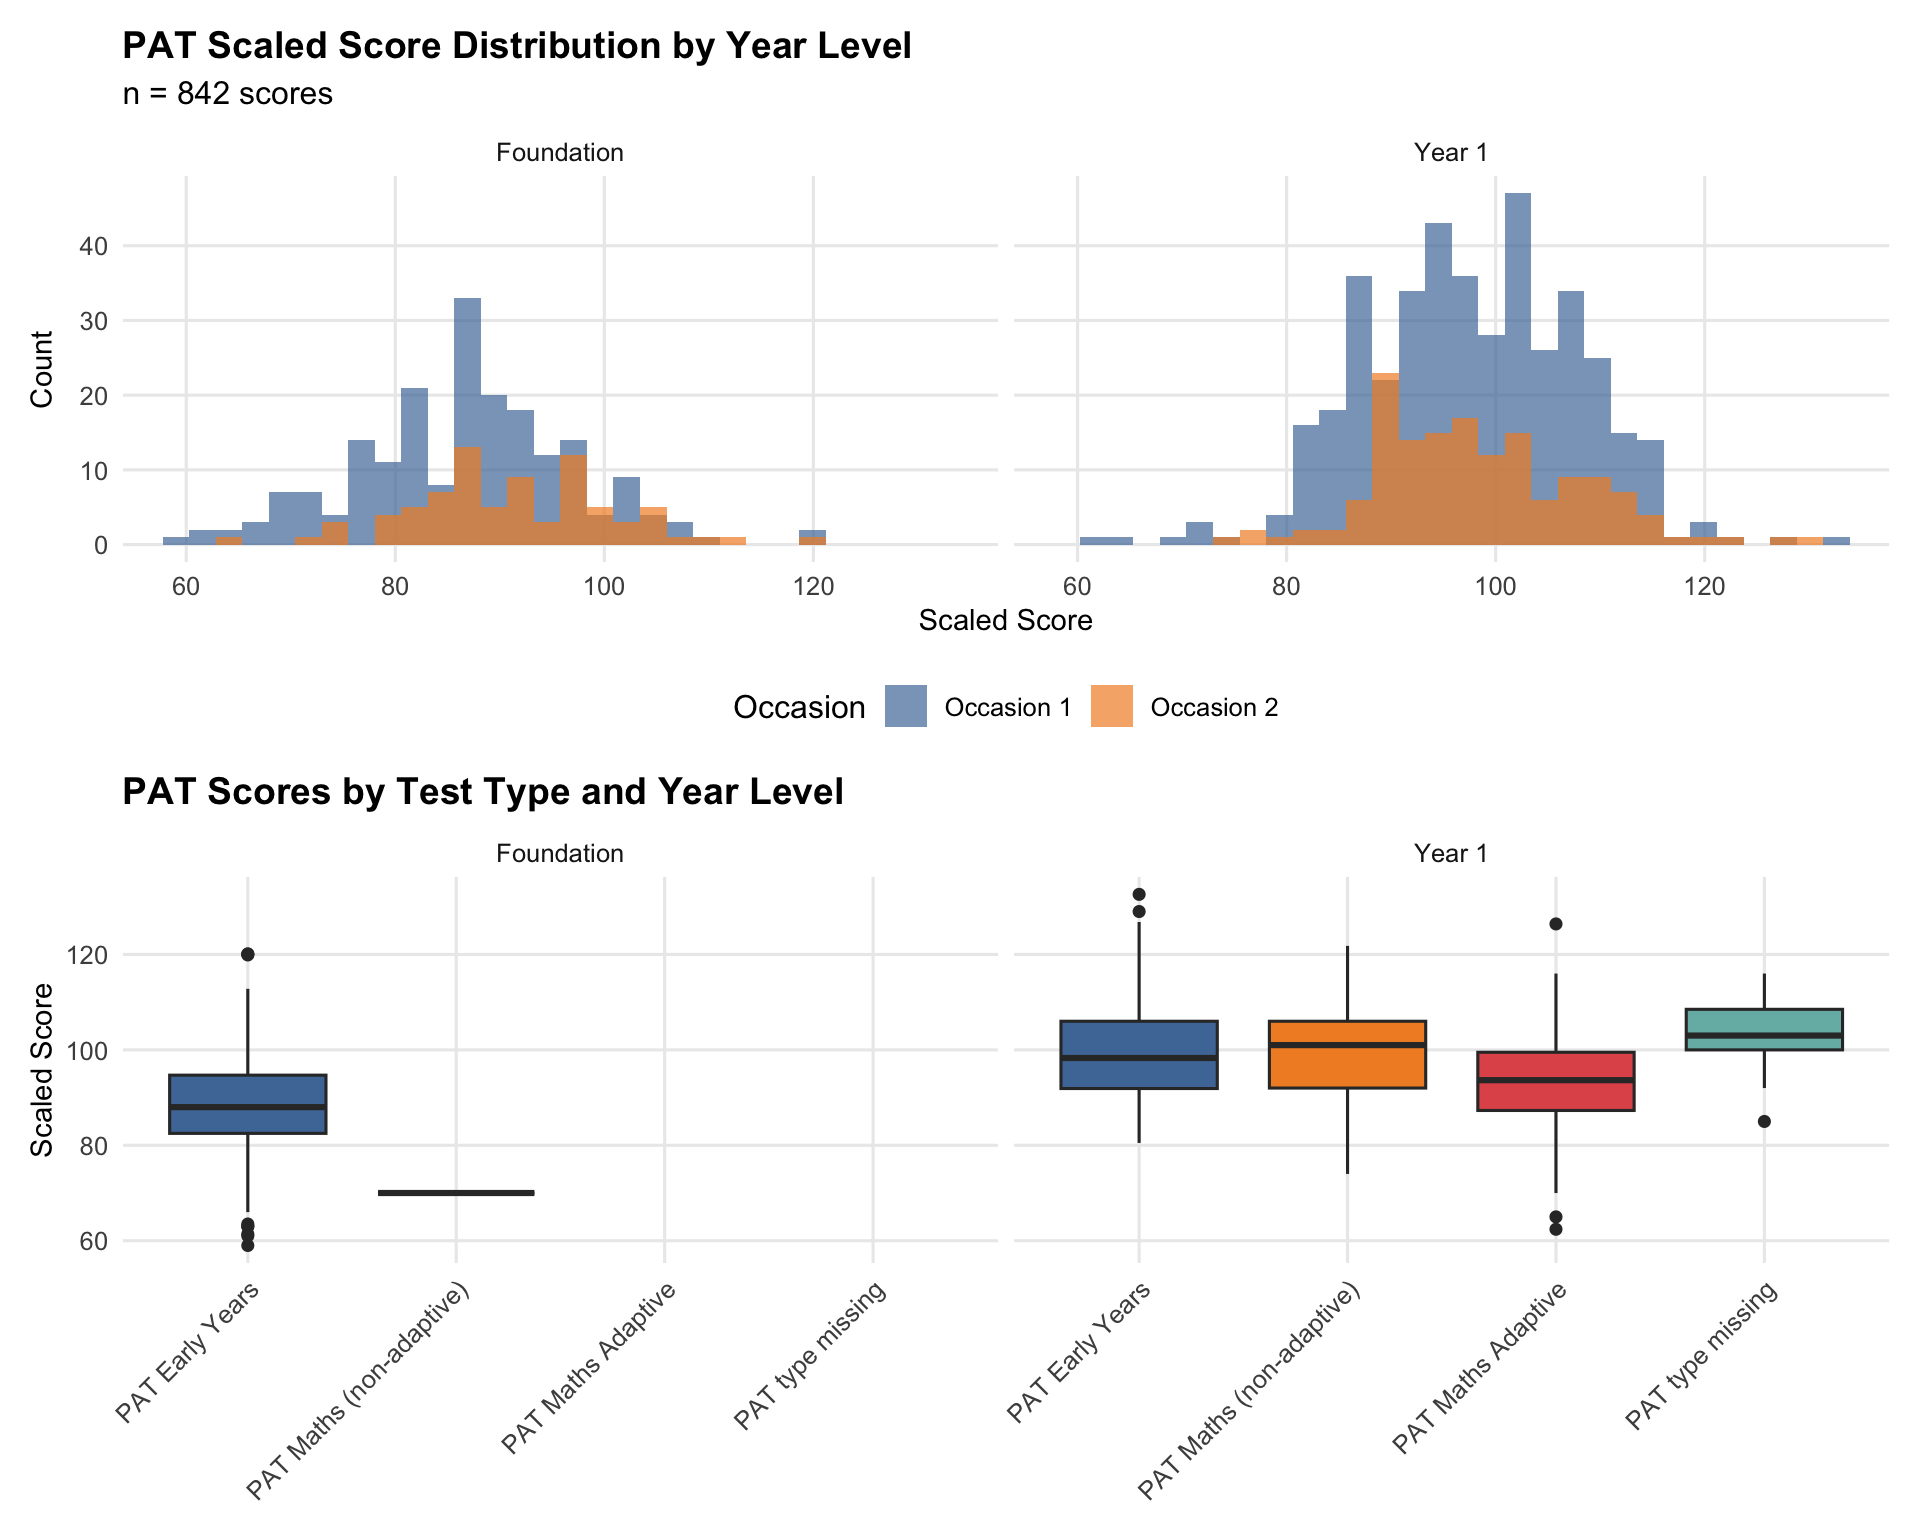
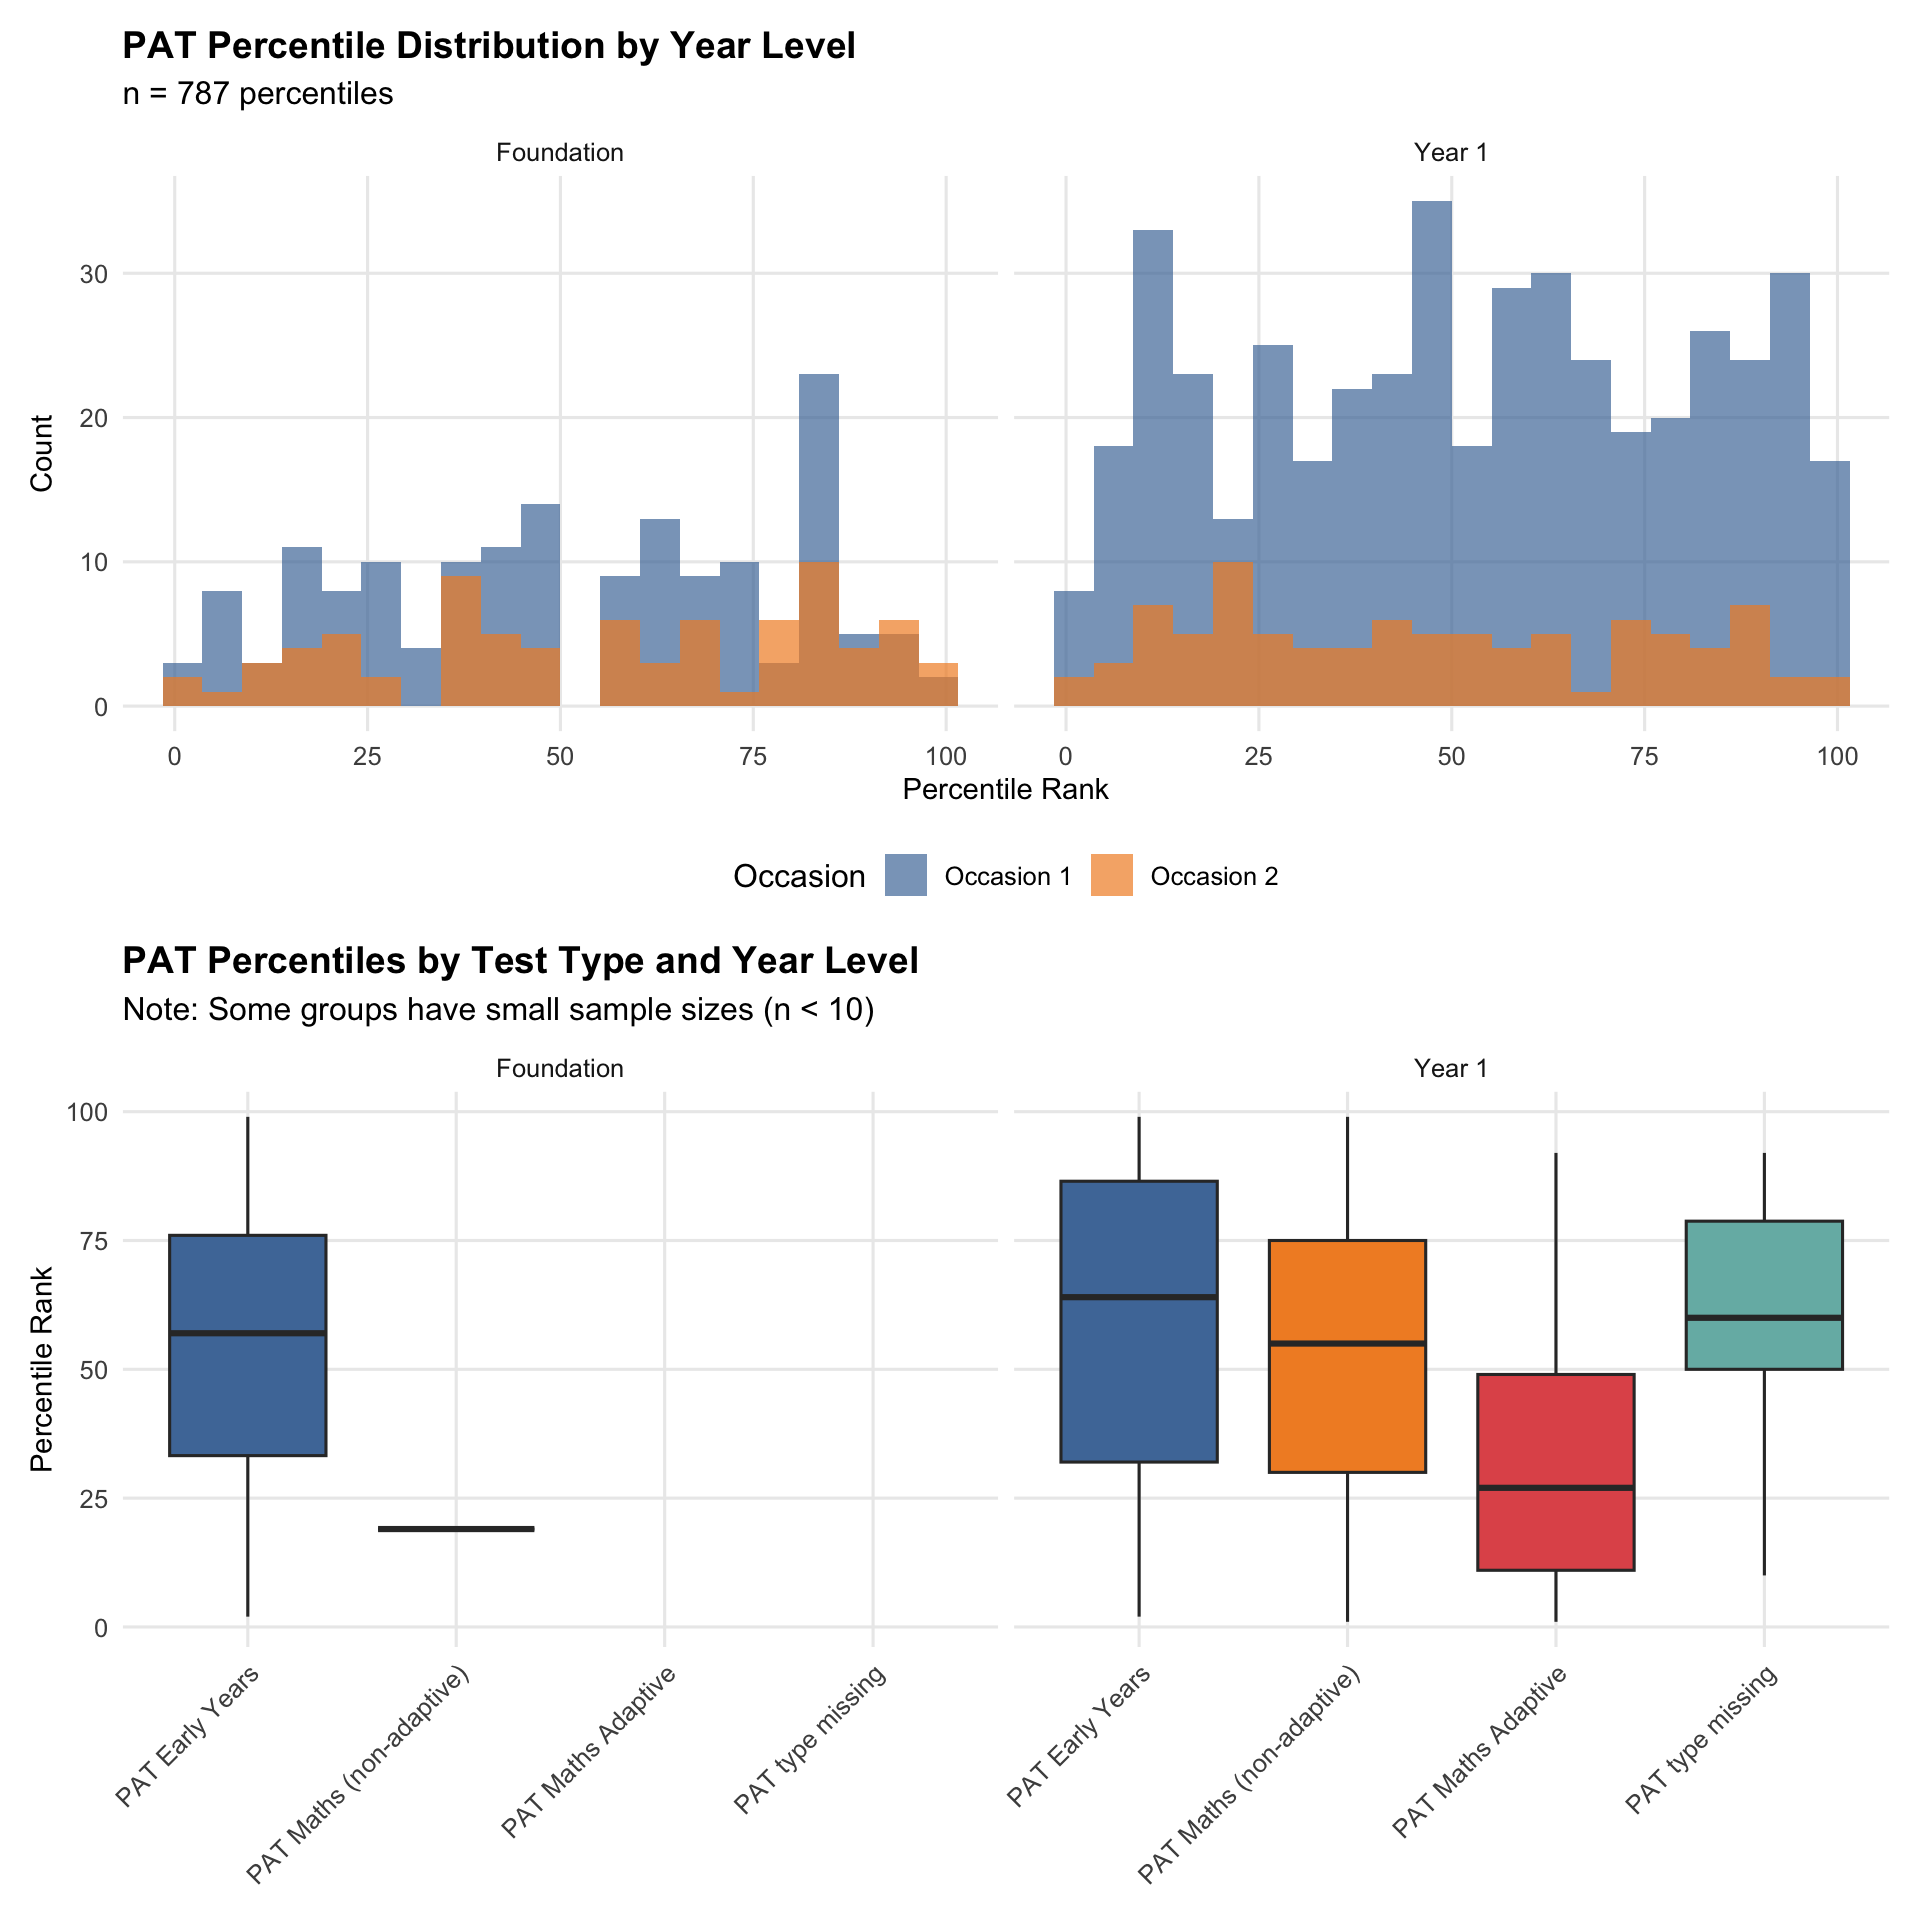
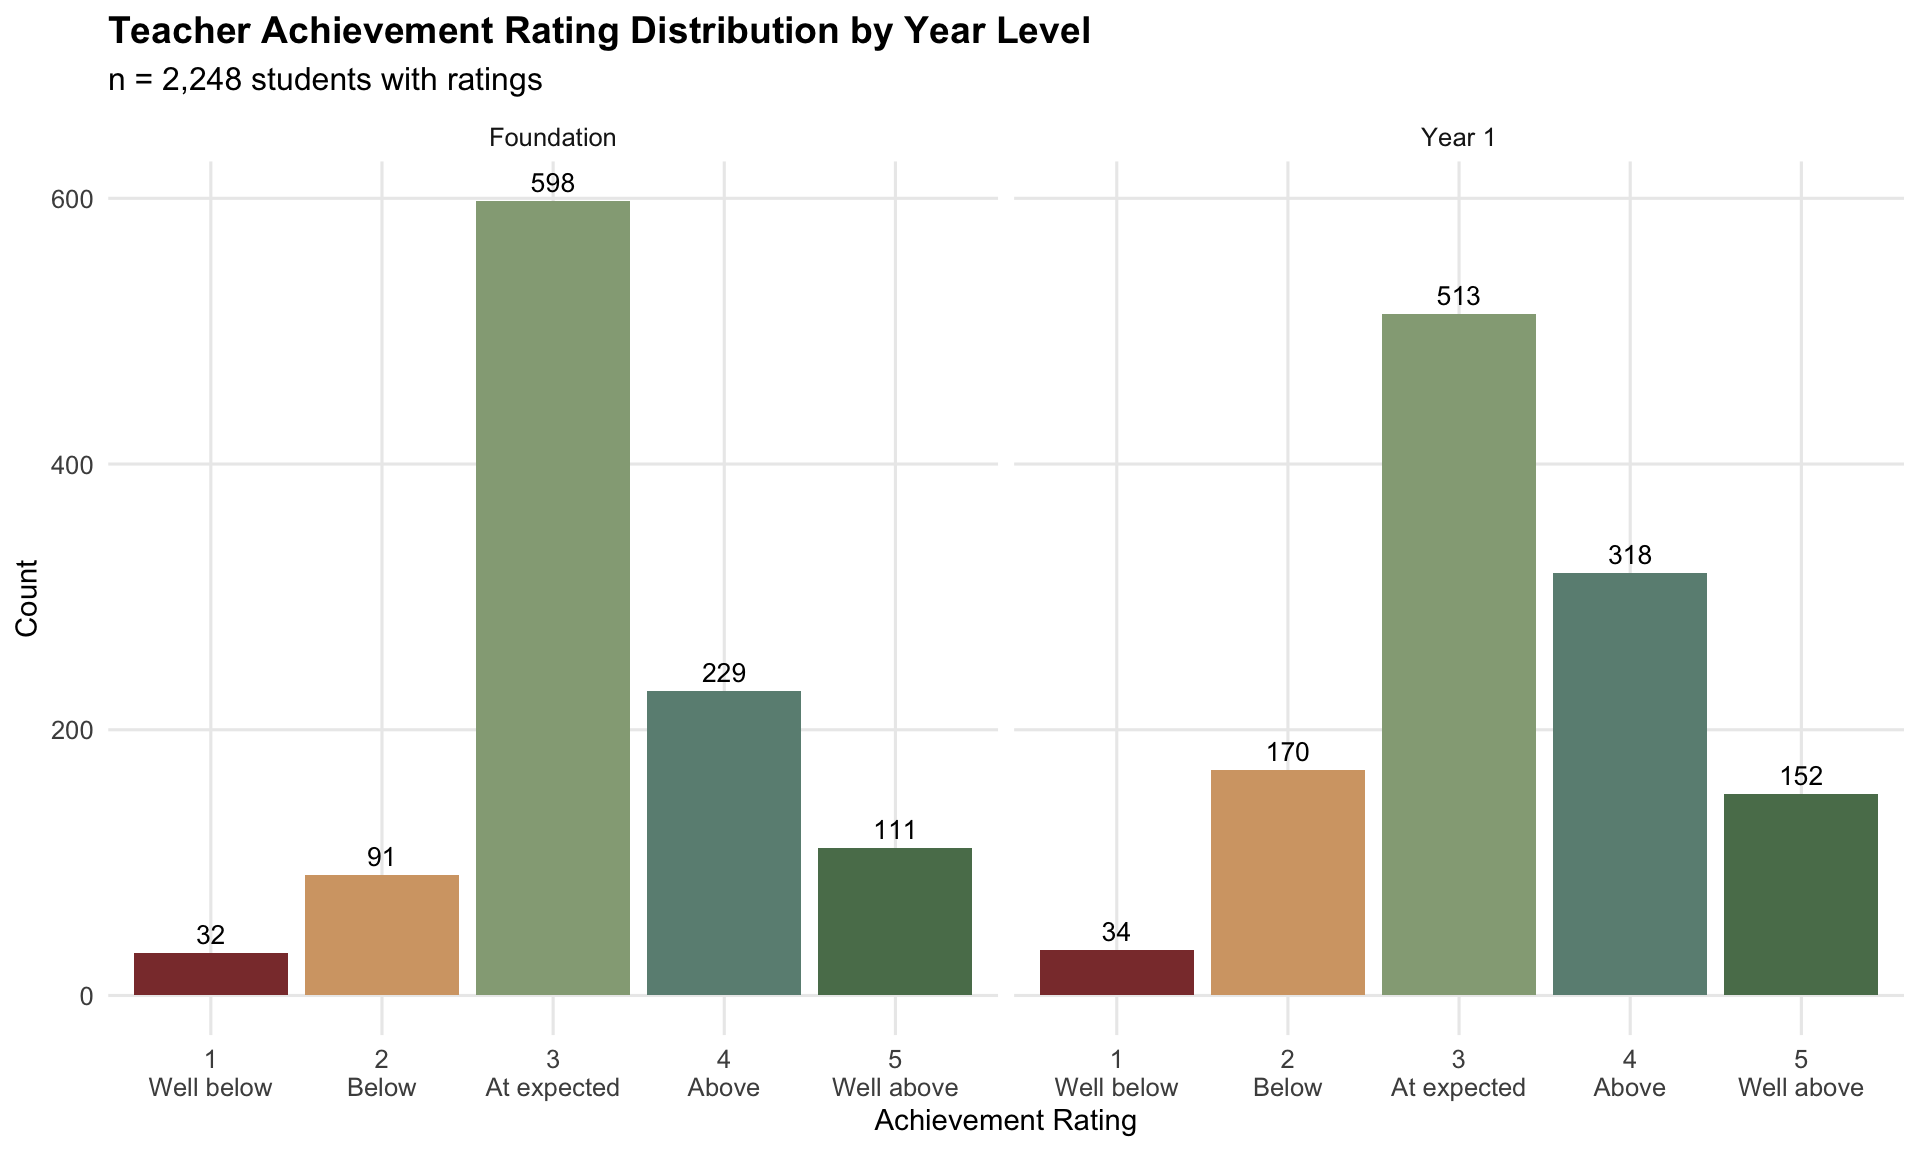
TipModelling Implication
PAT scaled scores are approximately normal within year level. Teacher ratings are ordinal and centred on “3 - At expected”. This supports treating PAT as the stronger standardised ruler, while using teacher ratings as a broad achievement signal that needs calibration.
School-Level Data Completeness
| outcome_type | Schools | Students |
|---|---|---|
| No outcome data | 89 | 4,625 |
| Teacher ratings only | 44 | 2,215 |
| Both PAT and teacher ratings | 15 | 969 |
| PAT only | 4 | 158 |
Warning: Removed 4 rows containing missing values or values outside the scale range
(`geom_bar()`).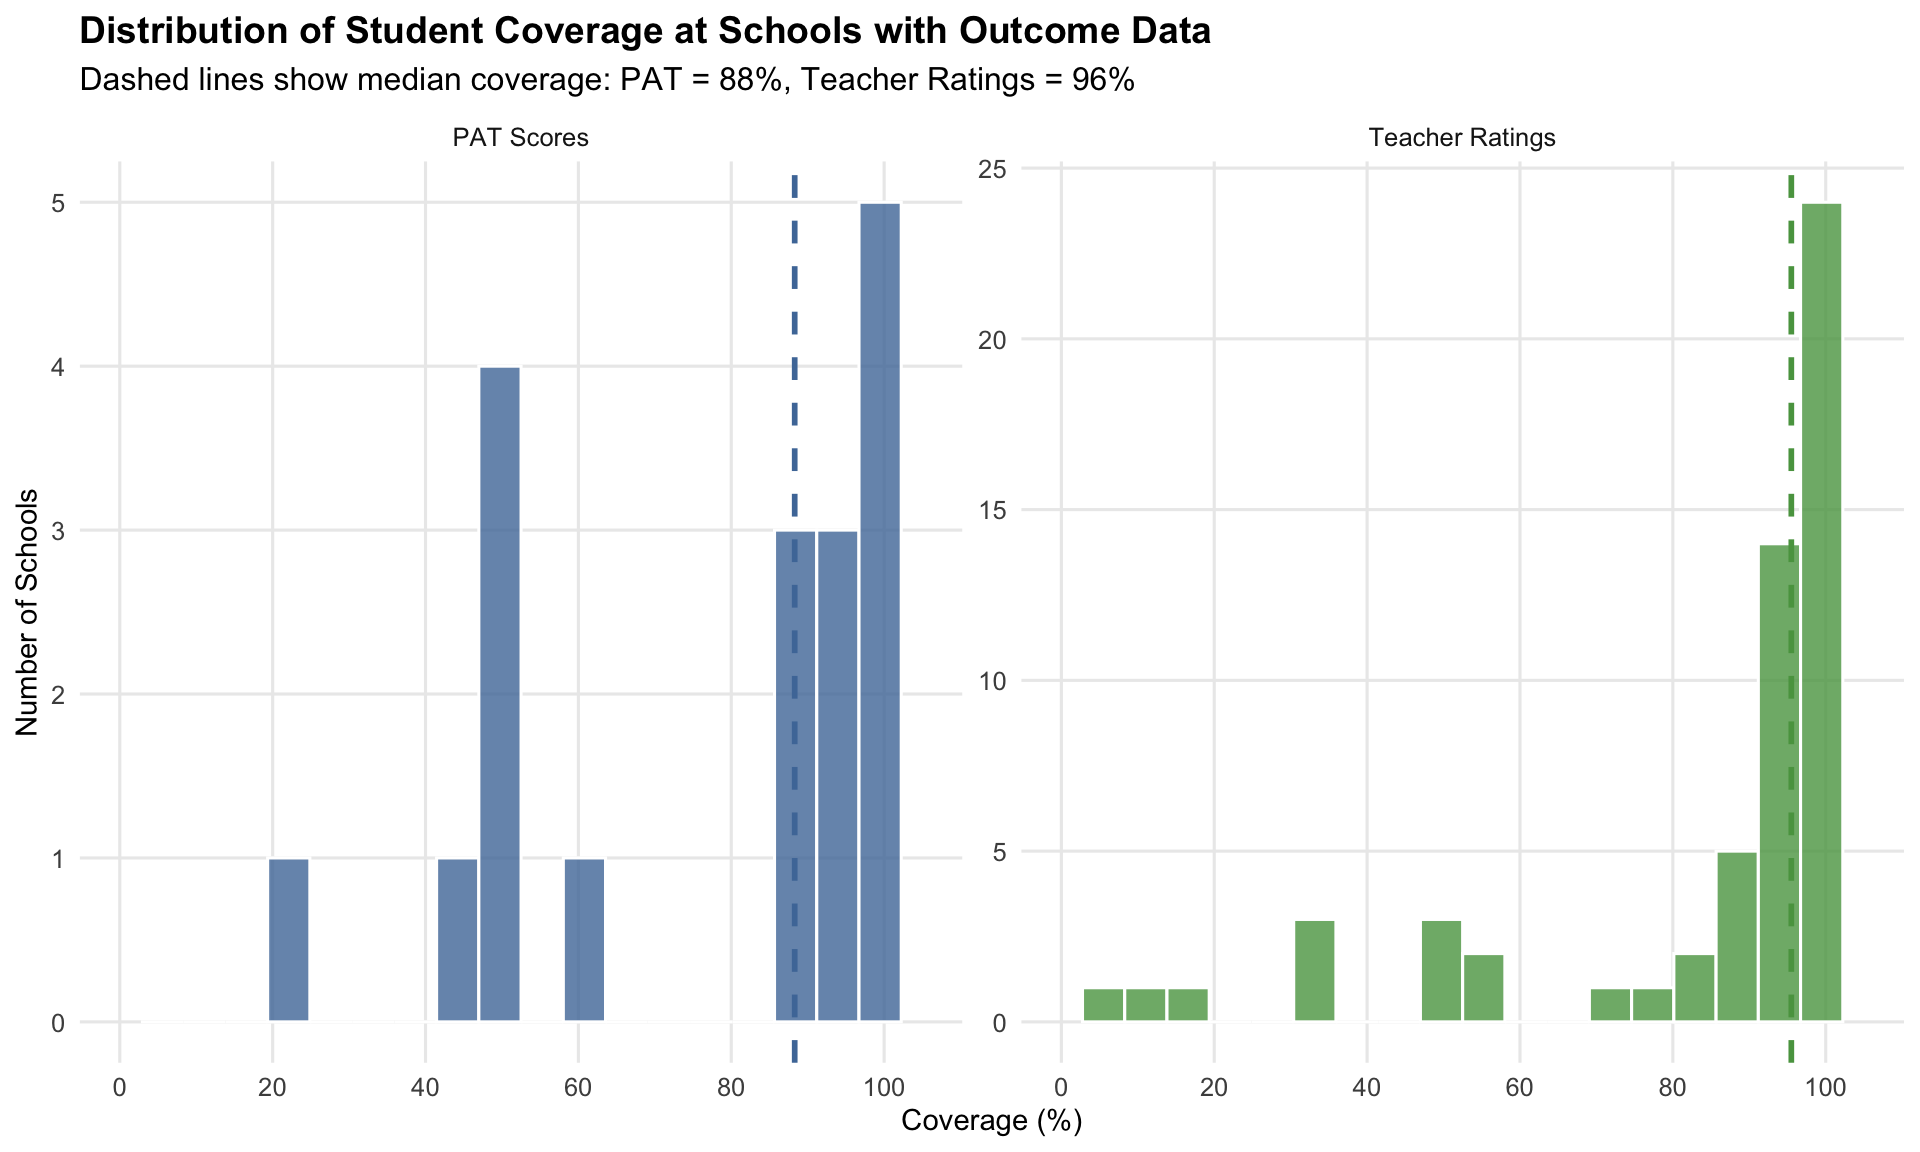
63 of 152 schools provided any outcome data. PAT data is sparse (19 schools); teacher ratings are more common (59 schools). Most schools that provide data do so comprehensively — median PAT coverage 88%, median teacher rating coverage 96%.
TipModelling Implication
PAT availability is largely school-driven: schools either administer PAT or they do not. This means the PAT sample should not be read as a simple random sample of all students.
Overlap Sample Profile
| Outcome Source | n Students | % of Total |
|---|---|---|
| PAT only | 194 | 2.4 |
| Teacher rating only | 1,771 | 22.2 |
| Both (overlap) | 587 | 7.4 |
| Total with any outcome | 2,552 | 32.0 |
| Rating | n | Mean PAT Score | SD | Mean Percentile |
|---|---|---|---|---|
| 1 | 22 | 82.6 | 10.7 | 21.6 |
| 2 | 60 | 90.6 | 9.6 | 33.1 |
| 3 | 298 | 94.3 | 10.1 | 51.1 |
| 4 | 175 | 97.4 | 11.1 | 61.3 |
| 5 | 32 | 109.6 | 9.0 | 81.1 |
| Year Level | n | Spearman ρ (Scale) | Pearson r (Scale) | Spearman ρ (Percentile) |
|---|---|---|---|---|
| Foundation | 169 | 0.277 | 0.311 | 0.309 |
| Year 1 | 413 | 0.407 | 0.412 | 0.445 |
Warning: Removed 67 rows containing non-finite outside the scale range
(`stat_boxplot()`).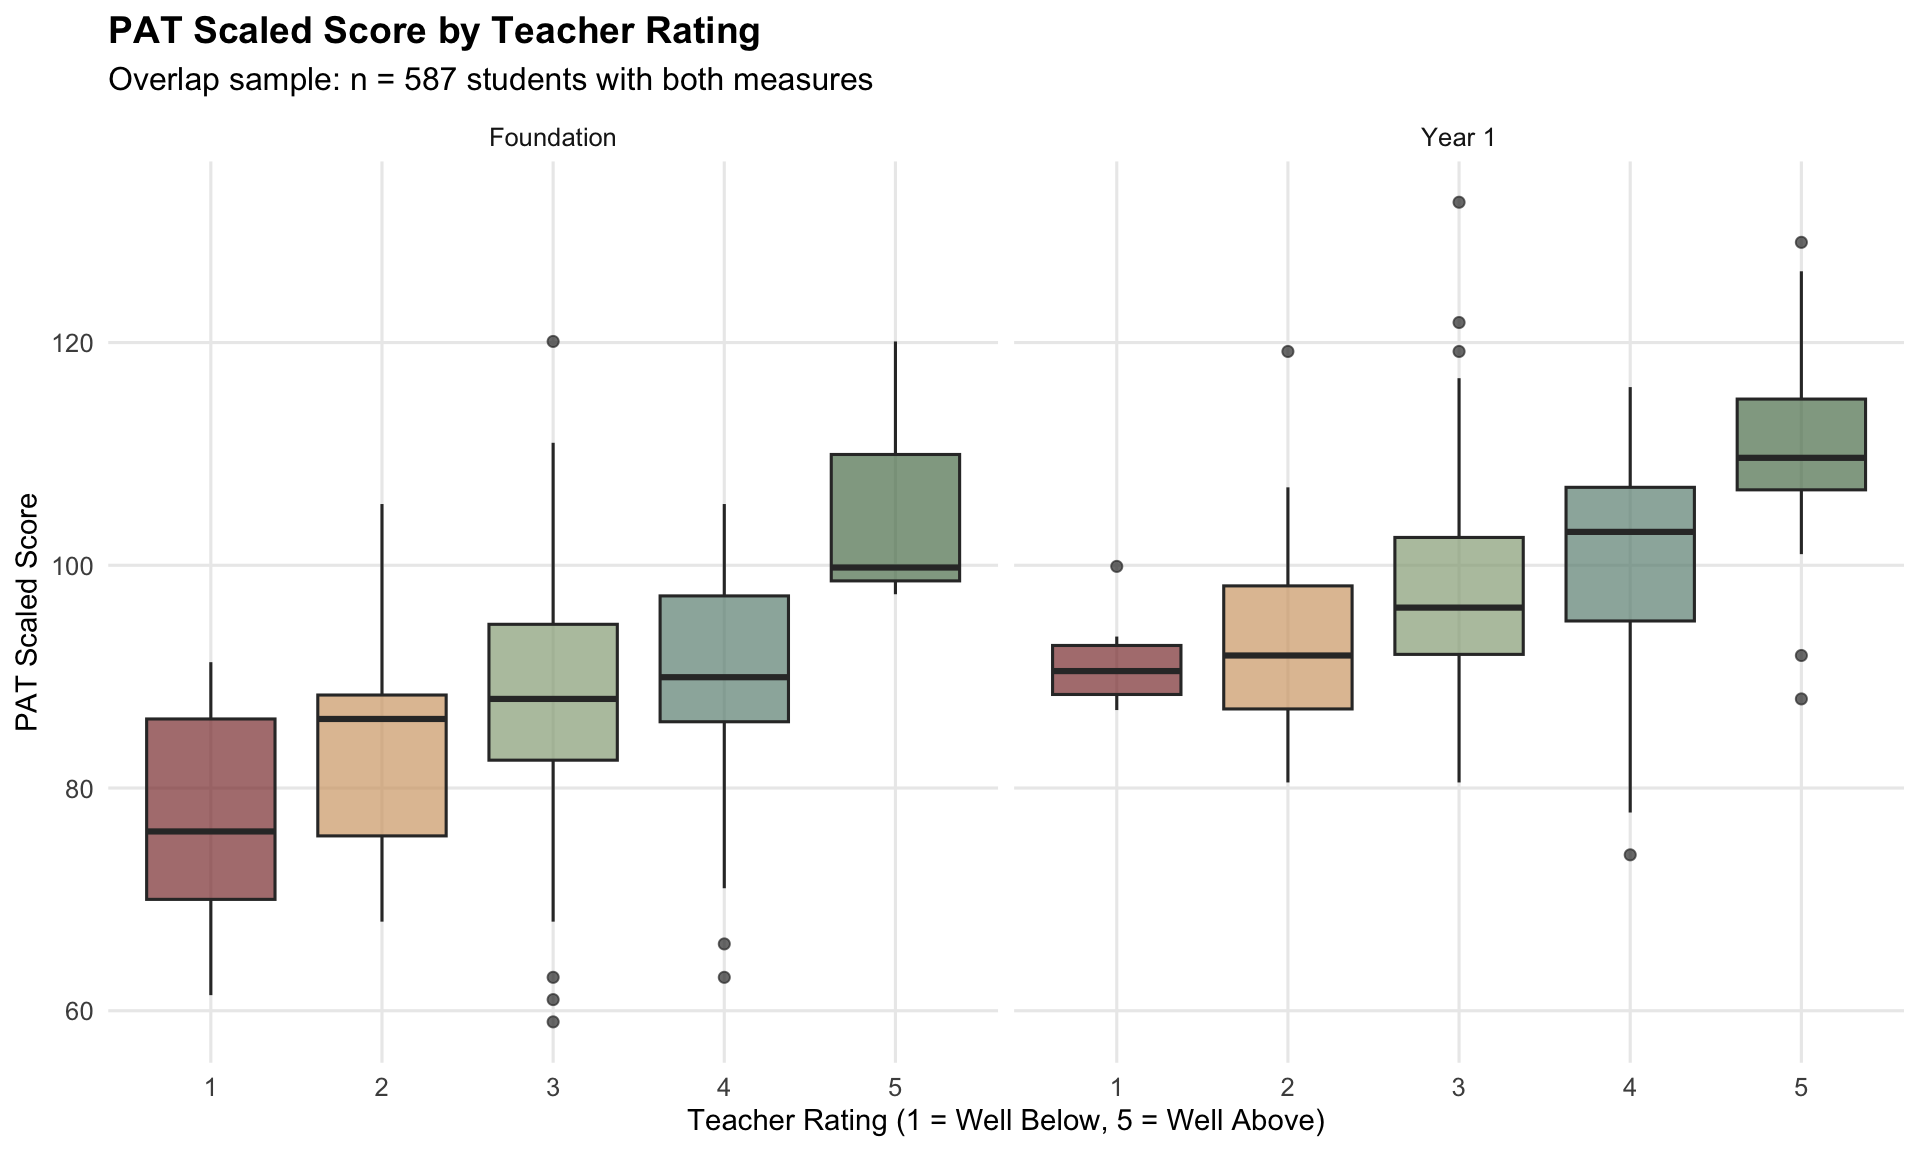
TipModelling Implication
The monotonic PAT-rating relationship confirms that teacher ratings carry information about the same outcome construct. The overlap sample (~520 students) is sufficient for calibration, but not large enough to treat every subgroup estimate as highly stable.
Missingness Mechanism Analysis
| Variable | SMD | n (with PAT) | n (without PAT) | Flag |
|---|---|---|---|---|
| Age (years) | 0.103 | 709 | 7044 | SMALL |
Interpretation: |SMD| < 0.1 = negligible, 0.1-0.2 = small, 0.2-0.5 = moderate, >0.5 = large imbalance.
NoteICC for PAT Availability
ICC = 0.985
Substantial school-level clustering in PAT availability. Missingness is NOT MCAR — school is a strong predictor of which students have PAT data.
| Year Level | Without PAT | With PAT | % with PAT |
|---|---|---|---|
| Foundation | 3,762 | 242 | 6.0 |
| Year 1 | 3,491 | 472 | 11.9 |
TipModelling Implication
PAT availability is not missing completely at random. It is mostly explained by school assessment practice, so school context needs to be considered when interpreting PAT coverage and teacher-rating calibration.
PAT Type Stratification
| PAT Type | n | Spearman ρ | Pearson r | Mean PAT | SD PAT |
|---|---|---|---|---|---|
| PAT Early Years | 269 | 0.214 | 0.245 | 91.7 | 12.1 |
| PAT Maths (non-adaptive) | 207 | 0.514 | 0.523 | 99.1 | 9.0 |
| PAT Maths Adaptive | 44 | 0.422 | 0.519 | 99.4 | 8.5 |
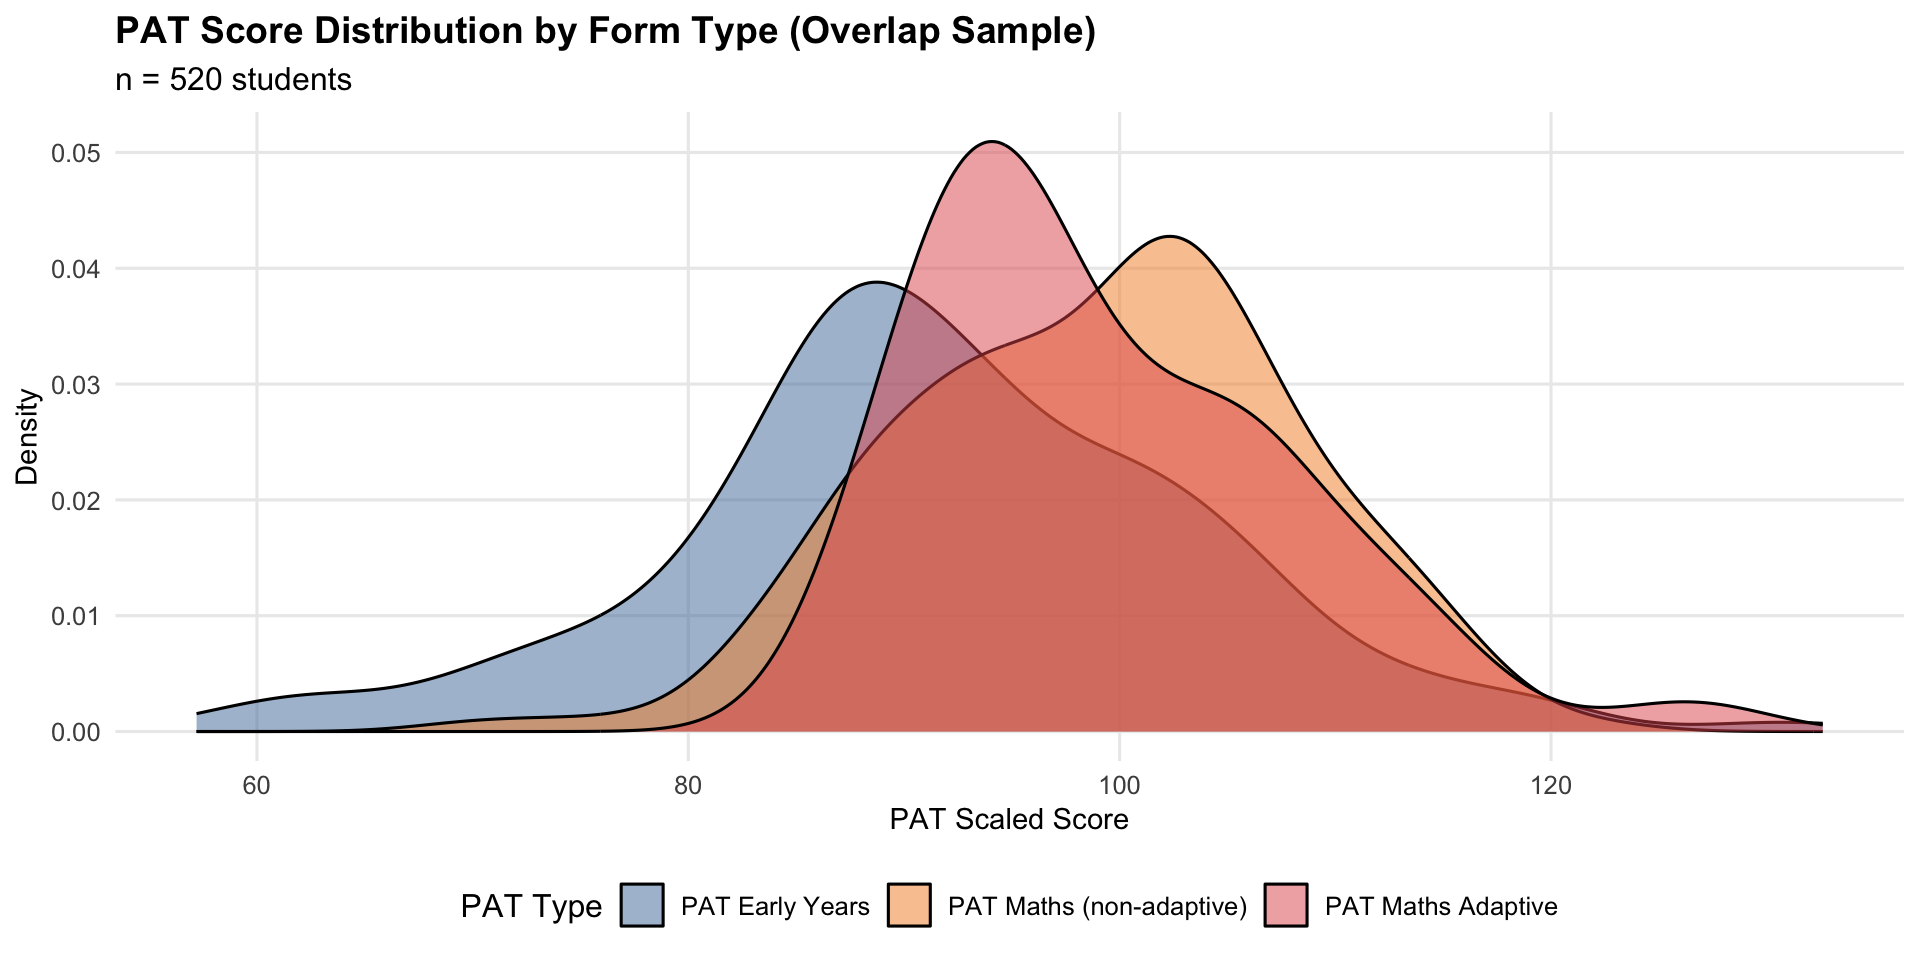
TipModelling Implication
Correlation strength and score distributions vary by PAT type. This is one reason PAT evidence is interpreted within year level and test-type context, rather than pooled naively.
School-Level Rater Effects
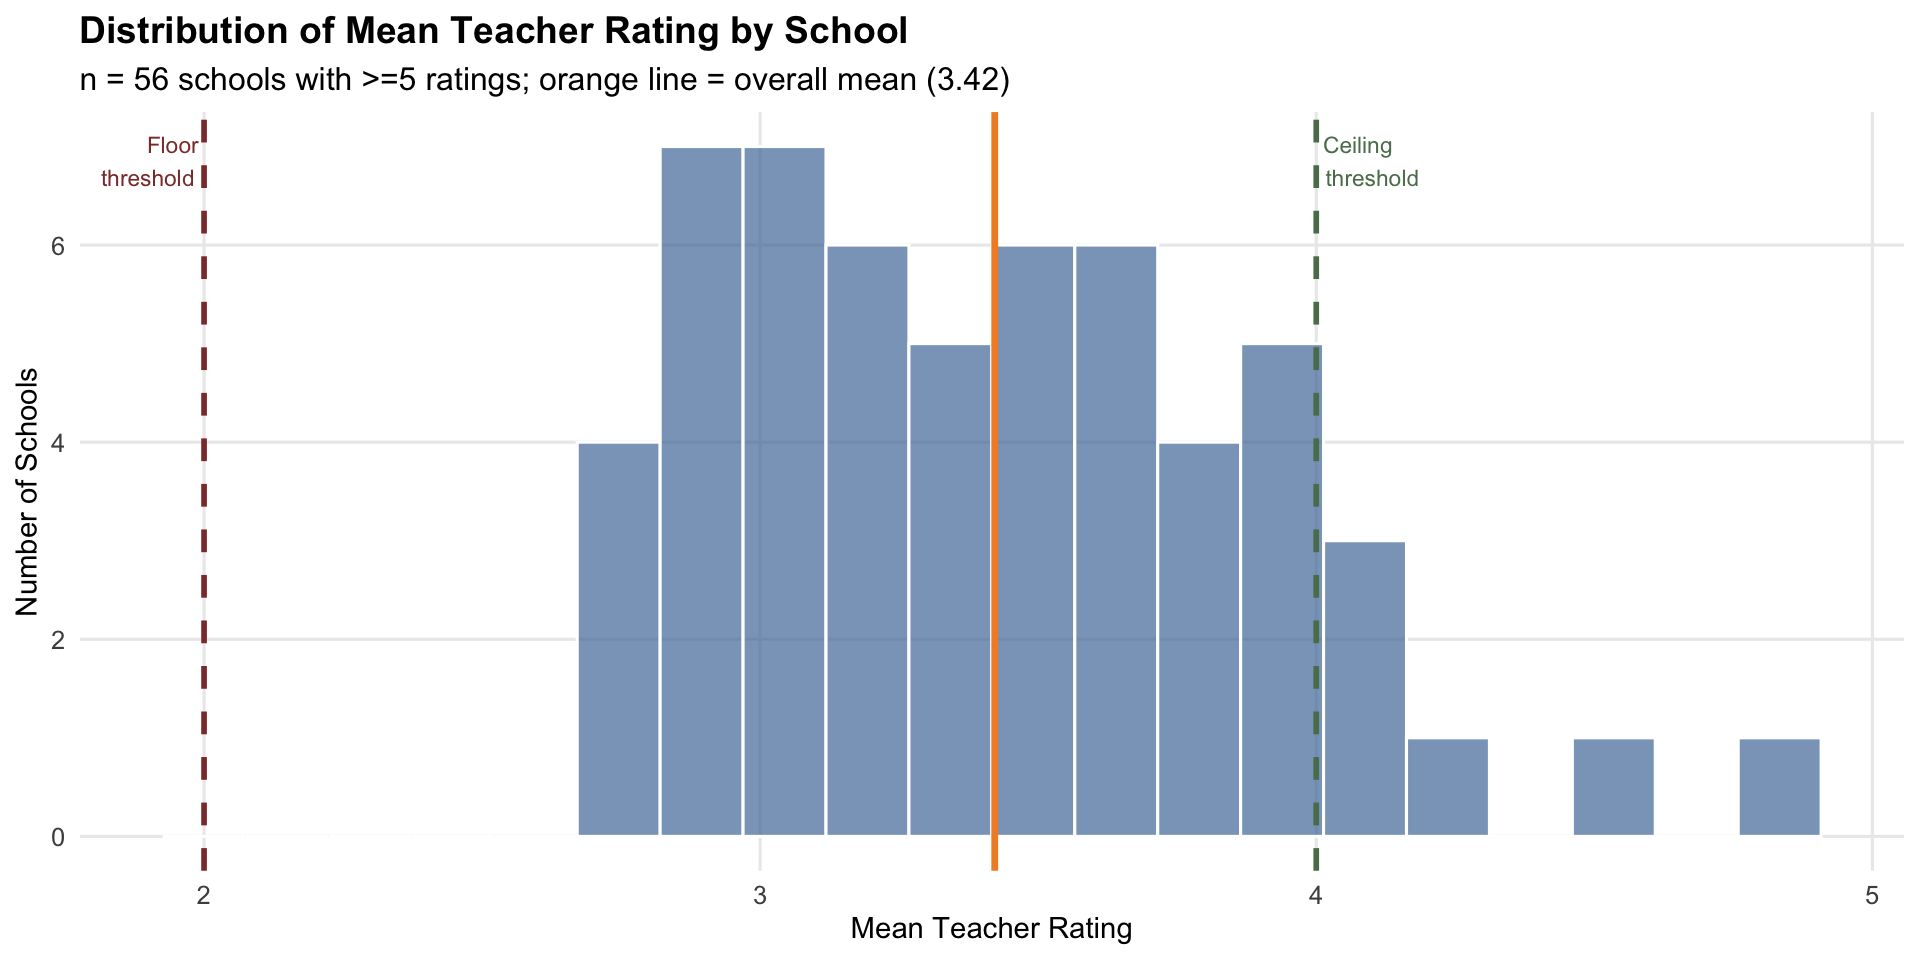
| Component | Variance | % of Total |
|---|---|---|
| School | 0.176 | 20.3 |
| Residual (within-school) | 0.690 | 79.7 |
| Total | 0.866 | 100.0 |
ICC for teacher ratings = 0.203: 20.3% of rating variance is between schools, indicating meaningful school-level rater effects.
| Issue | Schools | % of Schools |
|---|---|---|
| Floor effect (max rating <= 2) | 0 | 0.0 |
| Ceiling effect (min rating >= 4) | 1 | 1.8 |
| No variation (SD = 0) | 0 | 0.0 |
TipModelling Implication
School explains ~20% of teacher rating variance (ICC ≈ 0.20). This is substantial rater-context variation, so teacher ratings should be calibrated against PAT rather than treated as directly comparable across schools.
PAT Testing Timeline
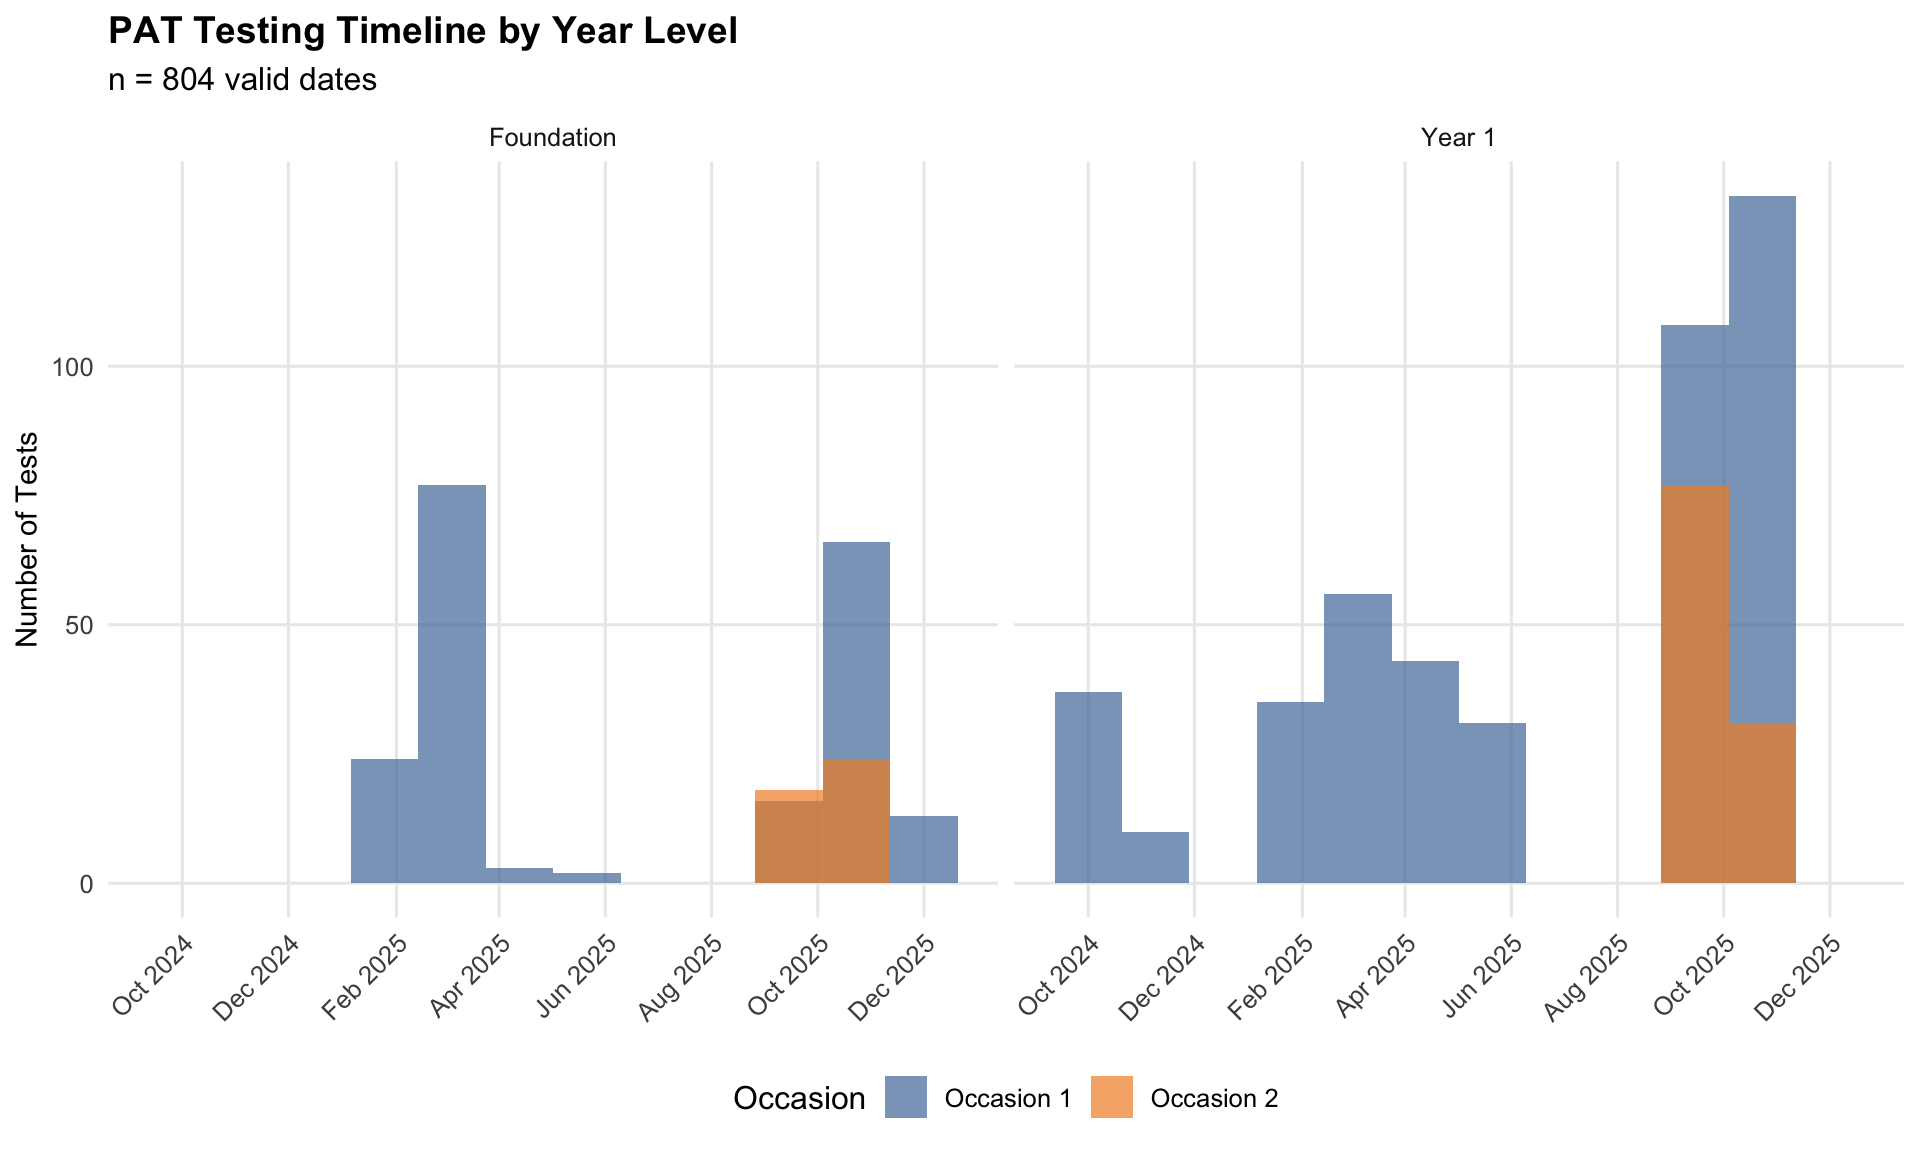
Key Observations:
- Occasion 1 (chronologically first) shows wide variance in timing (Oct 2024 - Dec 2025)
- Occasion 2 (chronologically second) tightly clustered in Oct-Nov 2025
- Schools administered first PAT at various points (BOY, MOY, or EOY) depending on schedule
TipModelling Implication
The 6+ month spread in PAT administration dates means earlier tests are less informative about end-of-year attainment. Timing uncertainty is therefore reflected in the confidence placed on each PAT result.
3 Model Specification
η is estimated by combining the two outcome sources in three steps:
Stage 1 — PAT evidence - PAT scores provide the strongest standardised ruler for end-of-year mathematics attainment. - Timing is accounted for because some PAT tests were administered months before the end-of-year reference point. - Year level, PAT type, and school context are considered when interpreting PAT scores.
Stage 2 — Teacher-rating calibration - Teacher ratings are mapped onto the PAT-like outcome scale using students who have both PAT and teacher-rating data. - School context is included because rating severity varies meaningfully by school. - Rating-only students receive outcome estimates from this calibrated rating relationship.
Stage 3 — Synthesis for students with both sources - Students with both PAT and teacher-rating evidence receive a combined estimate. - More precise evidence receives more weight. - The final estimate is the end-of-year outcome measure (η) used for risk classification.
Rating-Only Estimation
Rating-only students receive η estimates via conditional expectation from the ordinal rating model. For each teacher rating value, the model computes the expected η conditional on that rating and school-specific rater severity. This produces a “soft label” distribution accounting for ordinal-to-continuous transformation, school-level rater severity, and uncertainty in the calibration model.
The focus here is the practical interpretation; technical model details are kept out of the consultant-facing report.
4 Results
Classification Method
Risk classification uses the Single-η Framework: η is in PAT scale-score units, and risk z-scores are computed at scoring time using NORM_FRAME_EOY.
Risk-band thresholds: - High risk: below 15th percentile - Moderate risk: 15th-35th percentile - Low risk: above 35th percentile
Equivalent scale-score cuts by year level: - Foundation: High < 81.9, Moderate < 88.5 (using μ=92.4, σ=10.1) - Year 1: High < 87.7, Moderate < 95.1 (using μ=99.5, σ=11.4)
| Band | z Criterion | Percentile | Foundation η | Year 1 η |
|---|---|---|---|---|
| High Risk | z < -1.0364 | Below 15th | < 81.9 | < 87.7 |
| Moderate Risk | -1.0364 ≤ z < -0.3853 | 15th-35th | 81.9 - 88.5 | 87.7 - 95.1 |
| Low Risk | z ≥ -0.3853 | Above 35th | ≥ 88.5 | ≥ 95.1 |
WarningNorm-Referenced Cuts - External Validation Pending
The current risk cuts are purely norm-referenced based on ACER reference group distributions. They have not been validated against external criteria such as:
- Year 2 standardised test outcomes
- Teacher referrals for intervention
- Actual intervention receipt or effectiveness
- Growth trajectories over time
Implication: These cuts identify students at the bottom of the distribution (statistical risk), not students who are necessarily at educational risk (clinical significance). Until criterion validation is performed, interpret risk classifications as relative standing, not absolute educational need.
Cut validation data not available.
Risk Prevalence
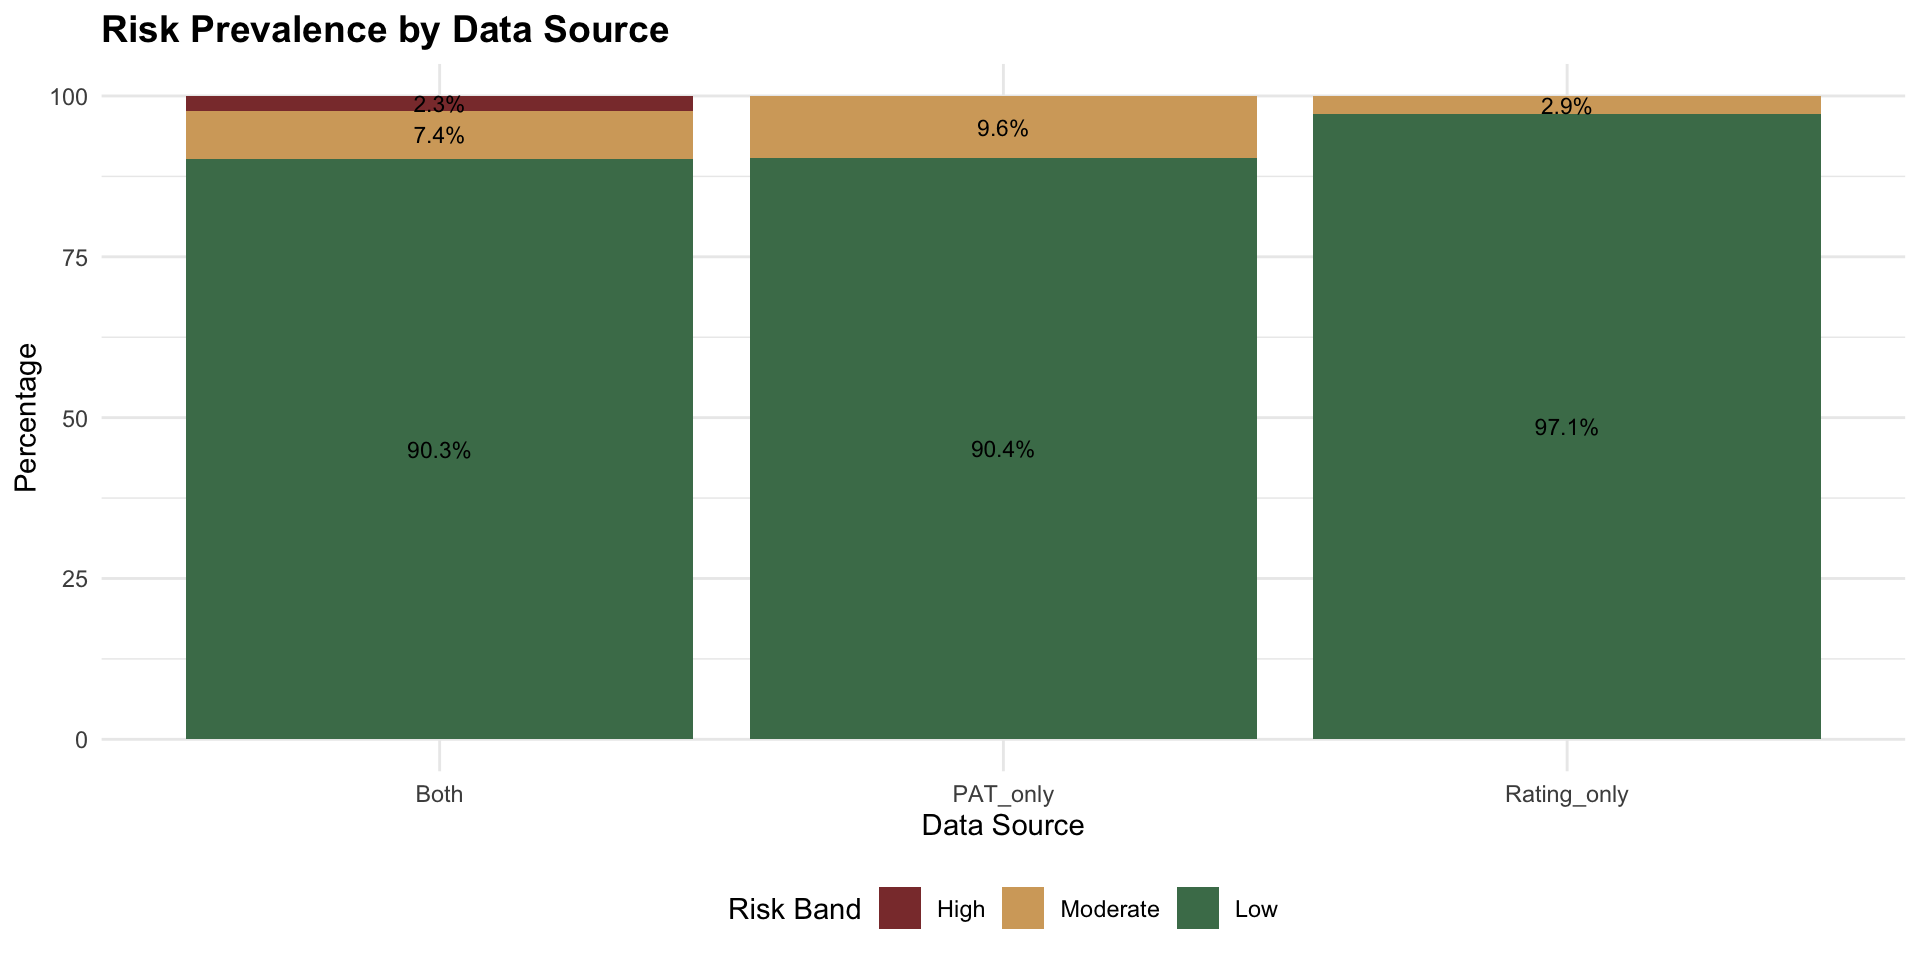
**Reference values** (from NORM_FRAME_EOY):
- Foundation: μ = 92.4, σ = 10.1
- Year 1: μ = 99.5, σ = 11.4
Benchmarks
This analysis presents risk classifications using two complementary benchmarks. ACER Norm-Referenced compares students to Australian national reference groups (2021-2022) using fixed cuts at the 15th and 35th percentiles. Cohort-Referenced identifies relative need within the current student population using within-cohort percentiles derived from conclusive students per year level, with inconclusive students excluded from quantile calculation.
| year_level | ACER High % | ACER Moderate+ % | Cohort High % | Cohort Moderate+ % | Inconclusive % |
|---|---|---|---|---|---|
| foundation | 0.5 | 4.0 | 3.2 | 15.2 | 5.6 |
| year1 | 0.3 | 4.4 | 4.5 | 19.2 | 3.8 |
**Overall agreement:** 82.2% (excluding inconclusive)

ACER bands identify students below national expectations (absolute deficit). Cohort bands identify students at the bottom of this cohort (relative need). A student can be "Low" risk by ACER standards but "High" risk within their cohort if the cohort overall performs below national norms.
Validity
Convergent Validity
For students with PAT scores, η is derived directly from the PAT scale score via the mixed model. The correlation with raw scale scores should be very high.
Known-Groups Validity
The traditional “known-groups” expectation that Year 1 η > Foundation η applies because η is in PAT scale-score units (not percentiles). Expected differences: Foundation median η ≈ 92.4, Year 1 median η ≈ 99.5, a difference of ≈ 7 scale points reflecting typical growth. Risk z-scores are year-level specific (computed using NORM_FRAME_EOY), so a Foundation student at z=0 is at the 50th percentile for Foundation, and a Year 1 student at z=0 is at the 50th percentile for Year 1.
Sensitivity Analysis
Sensitivity analyses were conducted across PAT inclusion rules (window_180d, year_2025, no_cap) and specification variants (prior type, IPW weighting, rater-level effects). Results were robust across all tested scenarios.
Sensitivity outputs not found. Run variants with LOS_RUN_TAG to populate this table.
Prior sensitivity (rating-only students):
| Risk Band | n | % | Prior |
|---|---|---|---|
| Moderate | 55 | 2.3 | acer |
| Low | 2303 | 97.7 | acer |
| High | 282 | 12.0 | pat_empirical |
| Moderate | 28 | 1.2 | pat_empirical |
| Low | 2048 | 86.9 | pat_empirical |
Note: Rating-only calibration now uses a pat-empirical prior (not ACER) and IPW is disabled by default. This shifts prevalence downward relative to the prior ACER-based calibration.
Probability Outputs
The analysis also produces probability-based indicators estimating the chance that a student is below a benchmark cut. These are useful for triage and for communicating uncertainty, but should not be treated as externally validated until future outcome data are available.
5 Diagnostics
WarningModerate Risk Band Has High Flip Rate
Classification reliability analysis reveals 24.5% overall flip rate when using bootstrap resampling. The moderate risk band is particularly unstable:
- Moderate risk flip rate: 77.8% (4 in 5 students would be reclassified with slightly different data)
- High risk flip rate: 12.3%
- Low risk flip rate: 8.7%
Implication: Students classified as “Moderate Risk” are borderline cases with high measurement uncertainty. Do not treat this band as definitively distinct from adjacent categories.
Recommended action: Flag students near decision boundaries (±0.25 SD from cuts) as “borderline” for follow-up assessment.
Classification Stability
Bootstrap analysis (500 replicates with school-clustered resampling) reveals substantial instability in risk band assignments, particularly for students near decision boundaries.
Bootstrap stability analysis not available.
Borderline Zone
Students within ±0.25 SD of a cut-point are flagged as “borderline” for follow-up assessment.
Rating-Only Uncertainty
Students with only teacher ratings (no PAT) have η estimated via a calibrated rating→PAT crosswalk. These estimates are usable but are the most sensitive to modelling assumptions. Treat rating-only bands as screening signals, not final placement decisions. Prefer follow-up assessment for High/Moderate rating-only students. School-level rater effects are material and are adjusted for in the main workflow.
Key uncertainty drivers: Rater severity (some schools use the 1-5 scale more leniently/harshly); ordinal granularity (rating=3 spans a wide middle range; extremes are more informative); weak signal (ratings explain limited variance in PAT outcomes; estimates rely heavily on calibration assumptions).
p20 Calibration
Calibration status: ok
- Intercept: -0.899
- Slope: 0.678
- Brier (raw): 0.0725
- Brier (calibrated): 0.072
- Mean p20 (raw): 0.102
- Mean p20 (calibrated): 0.081
- Event rate (y20): 0.081
Probability calibration is shown as a diagnostic only. It does not change η or the rank ordering of students.
The frequentist approach treats PAT-based η as “truth” in Stage 2, ignoring Stage 1 uncertainty. This leads to underestimated standard errors for rating-only students, overconfident risk classifications (too narrow confidence intervals), and potential miscalibration (calibration slope ≠ 1.0).
Known Limitations
Ambiguous Date Format: Approximately 39% of PAT dates (332 of 849 non-empty dates) have ambiguous day/month values (both ≤12). The pipeline assumes d/m/Y (Australian standard) based on: Australian education context, 485 unambiguous dates validating d/m/Y, and EOY clustering patterns (94% Oct-Nov with d/m/Y vs 72% with m/d/Y). This cannot be validated without external verification.
Rating-Only Uncertainty (78% of Sample): Students with only teacher ratings have η estimated via soft probability labels derived from ordinal calibration. These estimates use frequentist approximation (normal distribution assumed), are influenced by rater severity bias (ICC_rater ≈ 24%), have higher standard errors than PAT-derived estimates, and may exhibit overconfidence (calibration slope ≠ 1.0).
Reference Group Caveats: PAT Maths 4th Edition (Year 1) uses 2022 Australian national norms (μ=99.5, σ=11.4). PAT Early Years (Foundation) uses ACER reference groups that are self-selecting and not nationally representative (per ACER documentation, June 2021). Percentile interpretations differ between these populations.
PAT Timing Assumptions: η is defined as an end-of-year (EOY) attainment construct. Earlier PAT observations are less informative about EOY attainment. Time-decay variance increases with distance from reference date. Risk z-scores use NORM_FRAME_EOY (year-level specific).
Known Implementation Issues:
| Issue | Status | Impact |
|---|---|---|
| Anchor selection | ⚠️ Uses latest-date logic | May not select record closest to EOY |
| Type gate validation | ⚠️ Tests product-standardised z | May not detect measurement differences |
| PAT Adaptive | ⚠️ Excluded | No ACER conversion tables available |
6 Discussion & Operational Roadmap
Design Choices
This run estimates η for N/A students. The following design decisions are locked in:
- Construct: η targets end-of-year attainment (no growth projection; timing affects uncertainty only).
- Model: Hierarchical two-stage calibration with school-level random intercepts for rater severity.
- Rating-only prior: pat-empirical prior (estimated from PAT distribution in overlap calibration), not ACER. IPW disabled in mainline.
- Probabilities: p20 available as
p20_rawandp20_calibrated; not used to assign ACER risk bands.
These choices mostly affect rating-only students (the majority of the cohort). PAT-based students are much less sensitive.
Open Decisions
This report supports several downstream product decisions. These are not “statistical knobs”; they change how outputs should be communicated and used.
- Benchmark default: Should the primary view be ACER norms (
risk_band_acer) or cohort norms (risk_band_cohort)? - Teacher-facing outputs: Do we show a numeric η, only risk bands, or risk bands plus
p20_calibrated? - Operational criterion: Is “below 15th percentile” the right working definition of high risk, and is the 15th-35th percentile range the right review band? (This remains provisional pending external validation.)
- Borderline policy: How should Moderate be framed—as middle severity (15th-35th) or as a “needs review” band?
- Governance for rating-only: Do we treat rating-only students as eligible for the same actions as PAT-confirmed students, or require follow-up assessment?
Validation Roadmap
Priority 1: External Criterion Validation
- Future outcomes: Collect Term 1 2026 PAT scores for longitudinal validation
- Growth trajectories: Analyse whether high-risk students show different growth patterns
- Teacher referral agreement: Compare risk classifications to independent teacher referrals
Priority 2: Calibration & Fairness
- Intervention response: Track which students benefit from intervention
- Demographic fairness: Check for systematic bias in risk classification by ATSI, LBOTE, SES
- Rater bias mitigation: Develop procedures to reduce school-level severity effects
Priority 3: Operational Refinement
- Borderline protocols: Establish clear procedures for students near cut-points
- Probability calibration: Validate p20 probabilities against actual outcomes
- Threshold adjustment: Recalibrate cuts based on external validation data
- Screening-outcome linkage: Analyse relationship between screening probe performance and outcome measures
- Growth analysis: Compare Occasion 1 vs Occasion 2 PAT trajectories by risk band
Lessons Learnt
Key methodological takeaways from the η estimation process:
- Sparse anchor data demands careful calibration: With only ~520 overlap students, the rating-to-PAT crosswalk is the critical bottleneck. Small changes to this sample (e.g., excluding a school) can shift risk prevalence materially.
- School-level effects are pervasive: School explains ~20% of rating variance and nearly 100% of PAT availability. Any model ignoring school structure will produce biased estimates.
- The Moderate band is inherently unstable: Bootstrap analysis shows a high flip rate around the cut-points. This is expected for students near decision thresholds, not necessarily a model failure. Consider whether three bands are appropriate or whether continuous probabilities better serve decision-making.
- Frequentist two-stage is pragmatic but imperfect: Treating Stage 1 η as known in Stage 2 underestimates uncertainty for rating-only students. A joint model would be theoretically superior but was computationally infeasible with current data sparsity.
- Date quality materially affects timing adjustments: The 39% ambiguous-date problem and wide administration windows mean σ_time estimates carry substantial uncertainty themselves.