| Response type | Raw evidence | Model treatment in this section |
|---|---|---|
| Binary probes | 0/1 correctness | Rasch binary item model |
| Number-line probes | Continuous accuracy from 0 to 1 | Ordered PCM/GPCM category after binning |
| Response time | Seconds / rounded seconds | Not part of the accuracy likelihood; handled in RT models |
Number-Line PCM Policy
How continuous number-line accuracy is converted into ordered model categories
1 Executive summary
Number-line responses are different from most other screener items. Instead of a simple correct/incorrect outcome, each response receives a continuous accuracy score from 0 to 1. For the accuracy-structure models, those continuous scores are converted into ordered categories and fitted with a partial-credit / generalised partial-credit model (PCM/GPCM).
The current structure-comparison run uses a three-category policy:
- 0:
raw_score < 0.85 - 1:
0.85 <= raw_score < 0.95 - 2:
raw_score >= 0.95
These are model categories, not teacher-facing bands. They should not be read as “wrong / nearly right / right” labels for students. Their purpose is to preserve graded number-line evidence while avoiding unstable, overly fine categories.
Earlier hierarchy-comparison code supported alternative policies, including a looser three-category policy and a five-category policy. The current headline structure conclusion — one broad accuracy-based numeracy score with probe/testlet effects — should be interpreted as conditional on the selected three-category policy, with alternative binning treated as sensitivity evidence.
2 Why number-line items need different treatment
Most screener items are binary: the response is scored as correct or incorrect. Number-line items are graded: a click close to the target contains more evidence than a click far away, even if neither is exactly correct.
The PCM/GPCM approach is a compromise. It avoids discarding graded evidence, but it also avoids treating the continuous score as if it were directly comparable to binary correctness inside the same MML structure-comparison model.
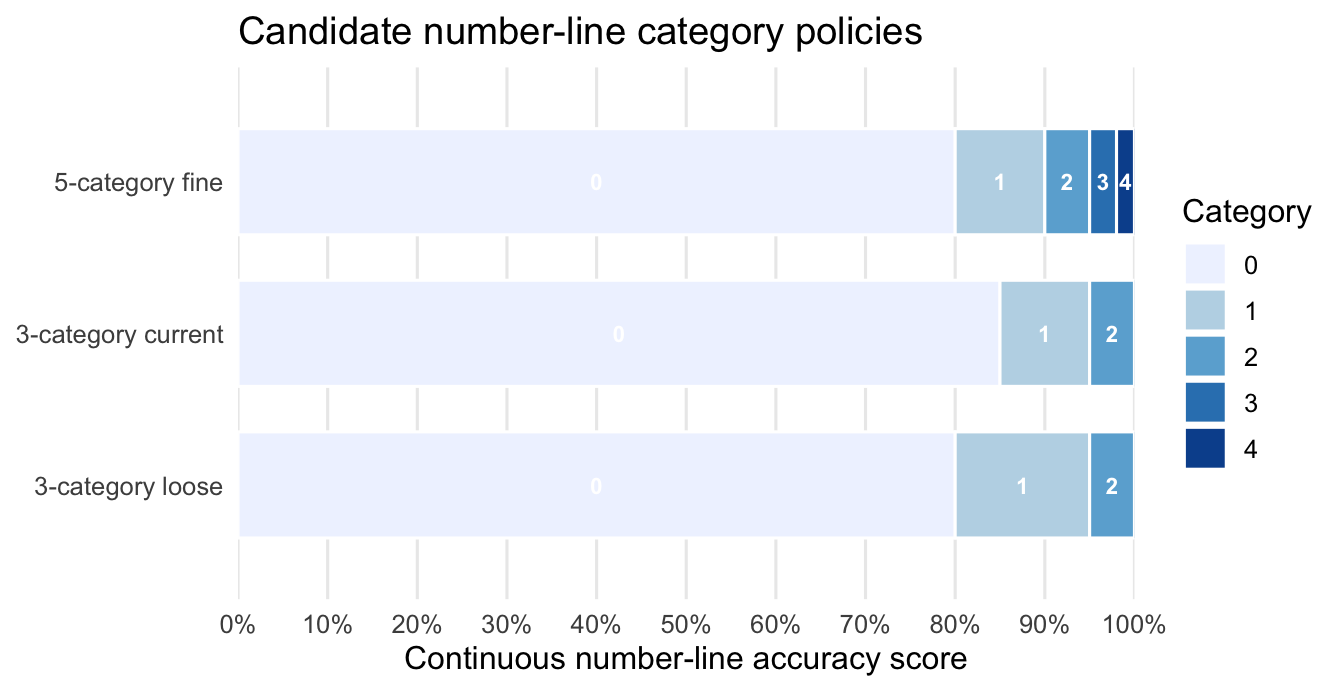
3 Candidate binning policies
The repo contains three relevant number-line binning policies.
| Policy | Category cutpoints | Source | Current role |
|---|---|---|---|
| 3-category loose | 0: <0.80; 1: 0.80–<0.95; 2: >=0.95 | Earlier hierarchy-comparison module default (HIER_NL_SCHEME=3cat_B) |
Sensitivity / historical |
| 3-category current | 0: <0.85; 1: 0.85–<0.95; 2: >=0.95 | Current structure_model_comparison_v4 configuration |
Main policy for current Accuracy Modelling page |
| 5-category fine | 0: <0.80; 1: 0.80–<0.90; 2: 0.90–<0.95; 3: 0.95–<0.98; 4: >=0.98 | Earlier hierarchy-comparison coded sensitivity option | Sensitivity / coded option |
The current page reports the 3-category current policy because that is the policy used in the full-N robustness run supporting the Accuracy Modelling page.
4 Model specification
For a number-line item \(j\), the cleaned pipeline produces a continuous score \(s_{ij} \in [0, 1]\) for student/person-administration \(i\).
Under the current policy:
\[ y_{ij} = \begin{cases} 0 & s_{ij} < 0.85 \\ 1 & 0.85 \le s_{ij} < 0.95 \\ 2 & s_{ij} \ge 0.95 \end{cases} \]
The resulting ordered category \(y_{ij}\) is fitted with a GPCM-style item response function:
\[ P(Y_{ij}=k) \propto \exp\left(\sum_{c=1}^{k} a_j(\theta_i - b_j - d_{jc})\right) \]
where:
- \(\theta_i\) is the broad accuracy-based numeracy trait;
- \(a_j\) is the estimated number-line discrimination parameter;
- \(b_j\) is item location;
- \(d_{jc}\) are ordered step thresholds.
Binary non-number-line items use a Rasch model in the structure-comparison analysis. The number-line GPCM is therefore the main place where item discrimination is estimated within the current accuracy-structure page.
5 How the current policy was judged
The cutpoints are a modelling policy. The relevant question is not whether a threshold is intuitively perfect, but whether the policy produces useful, stable, interpretable measurement evidence.
| Check | Question | Current status |
|---|---|---|
| Category occupancy | Are there enough responses in each category to estimate thresholds? | Pending public table |
| Category ordering | Do higher categories correspond to higher overall achievement? | Pending public table |
| Model stability | Do fitted models converge and produce sensible parameters? | Partial: current full-N structure run completed |
| Structure robustness | Does the winning structure change under plausible binning policies? | Partial: current run documented; older policy options exist |
| Interpretability | Can the categories be explained without turning them into teacher-facing labels? | Established for internal modelling use |
The current strongest evidence is indirect: the structure-comparison conclusion is stable and strong under the current policy, with M1-struct (one broad trait plus probe/testlet effects) preferred over separate sub-skill factors in the full-N robustness run. The remaining public-reporting gap is to show category occupancy and model-conclusion sensitivity side-by-side across candidate policies.
6 Cutpoint comparison graphic
The figure below shows how the candidate policies partition the 0–1 number-line accuracy scale. It is a policy schematic, not an empirical distribution.
7 Past runs and what they tell us
There has been number-line PCM/GPCM work already. The current gap is not that no number-line models have been tried; it is that the cutpoint evidence has not yet been distilled into a compact public-facing summary with category occupancy, diagnostics, and conclusion stability side by side.
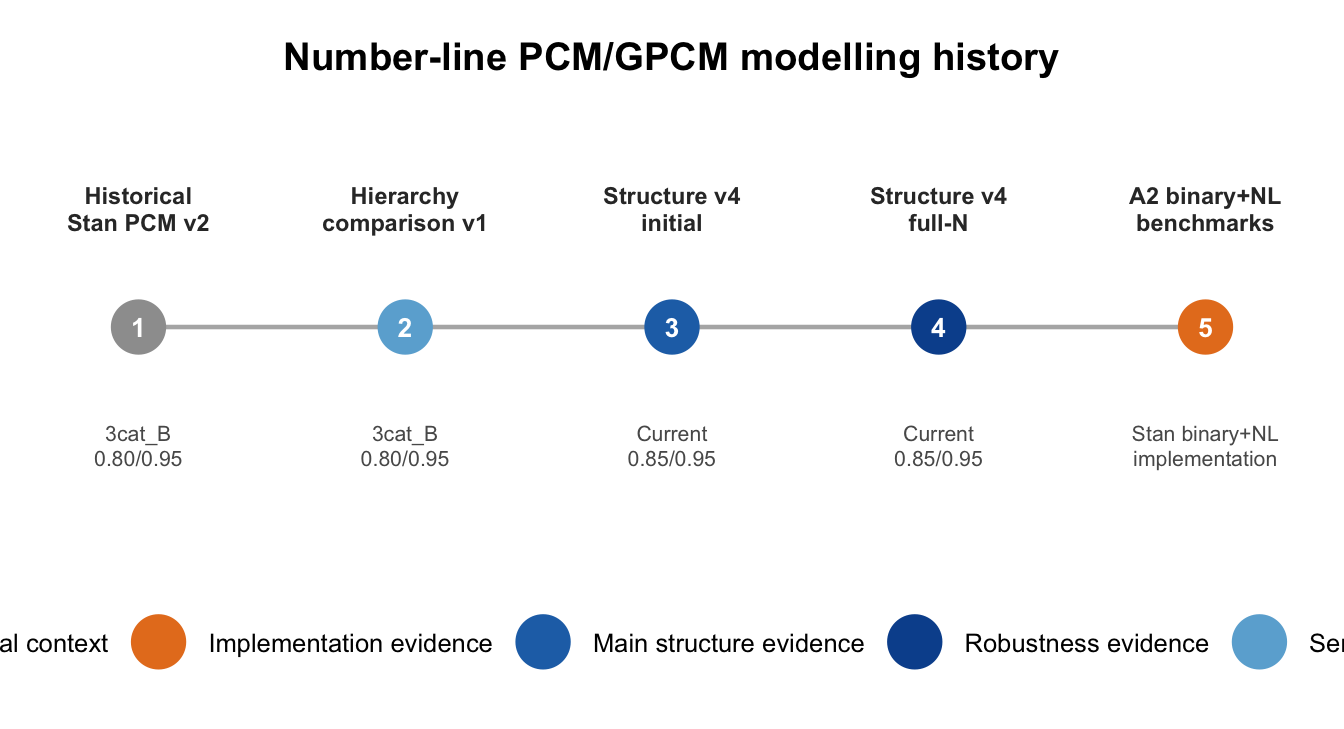
7.1 Historical joint Stan PCM v2
The earliest joint Stan PCM runs include 2026_preflight_3catB, 2026_pilot_3catB, and 2026_full_3catB_2core. These used the looser 3cat_B number-line policy: <0.80, 0.80–<0.95, and >=0.95.
These runs are useful historical evidence that number-line responses were already being treated as ordered partial-credit evidence rather than forced into binary correctness. They are not a clean cutpoint-selection study: the provenance was backfilled later and the runs were part of broader joint-model development rather than a targeted comparison of cutpoint policies.
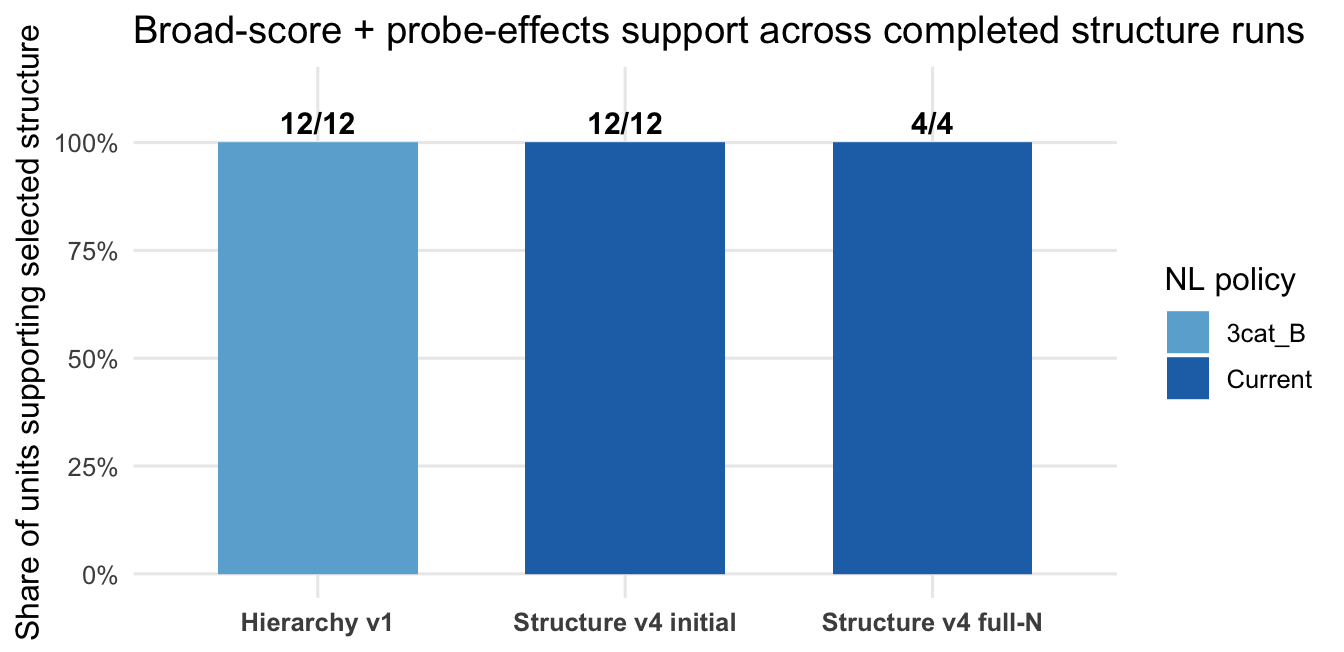
7.2 Hierarchy comparison v1
The hierarchy-comparison v1 run (1b0dc6f) also used the looser 3cat_B policy. It compared broad accuracy structures across Term 1 and Term 4, operational and stable panels, with binary items fitted as Rasch and number-line items fitted as GPCM.
The key result was structural rather than cutpoint-specific: the one-dimensional model with testlet/probe effects won by BIC in 12 out of 12 slice × year comparisons. This matters because it shows that under the older looser number-line policy, the broad-score-plus-probe-effects conclusion was already supported.
7.3 Structure comparison v4 initial run
The current Accuracy Modelling page is based on structure_model_comparison_v4, which moved to the current three-category policy: <0.85, 0.85–<0.95, and >=0.95.
The initial run (foundation_parallel_20260206) fitted the structure-comparison ladder across 12 Foundation units: single trait, single trait plus probe/testlet effects, and multidimensional sub-skill structures. M1-struct — the single trait plus probe/testlet effects model — won by BIC in 12 out of 12 completed units.
7.4 Structure comparison v4 full-N robustness run
The full-N robustness run (foundation_fulln_boot4_prod_20260209) used the same current number-line policy and focused on the four main pooled units. It completed the M1-struct vs M3-struct comparison and added school-level bootstrap stability checks.
Again, M1-struct won by BIC in 4 out of 4 main pooled units, and the bootstrap deltas all supported the same direction. This is the current strongest evidence that, under the selected number-line policy, the achievement structure is better represented as one broad score with probe/testlet effects than as separate latent sub-skill scores.
7.5 Later A2 binary+number-line Stan benchmarks
The later A2 work includes binary-plus-number-line Stan implementation benchmarks (m3bench-a2binnl*, Foundation). These runs checked that the later A2 implementation could represent the binary and number-line likelihoods efficiently and consistently in Stan.
These are useful implementation and compute checks. They should not be over-read as evidence that one cutpoint policy is psychometrically best. Their role here is to show that number-line PCM/GPCM handling continued into the later A2 implementation pathway rather than being only an older mirt-era choice.
7.6 Compact run summary
| Run family | NL policy | Main question | Result | Role |
|---|---|---|---|---|
| Historical Stan PCM v2 | 3cat_B (0.80/0.95) | Can NL enter a PCM-style joint model? | Completed historical runs; partial/backfilled provenance | Context |
| Hierarchy v1 | 3cat_B (0.80/0.95) | Does broad score + testlets hold under older NL policy? | 12/12 comparisons support 1D + testlets | Sensitivity evidence |
| Structure v4 initial | Current (0.85/0.95) | Does broad score + testlets hold under current NL policy? | 12/12 completed units support M1-struct |
Main evidence |
| Structure v4 full-N | Current (0.85/0.95) | Does the current-policy result replicate at full N? | 4/4 pooled units support M1-struct; bootstrap direction stable |
Strongest robustness evidence |
| A2 binary+NL benchmarks | Binary+NL Stan variants | Can the later Stan A2 implementation carry the NL likelihood? | Completed implementation/compute checks | Implementation evidence |
The main conclusion is stronger than “we have not reported this yet”:
- Historical
3cat_Bruns used the looser<0.80 / 0.80–<0.95 / >=0.95policy and already supported a broad-score-plus-probe-effects structure. - Current structure-comparison runs use
<0.85 / 0.85–<0.95 / >=0.95and again supportM1-structconsistently. - Later Stan/A2 benchmark work confirms the implementation pathway for binary plus number-line likelihoods.
- New number-line-specific checks now support the current three-category policy as the operational-compatible baseline, while keeping continuous and signed-error models as challengers.
8 Model ladder and updated evidence
The current conclusion is not “PCM is psychometrically true”. It is: use the current three-category PCM/GPCM as the operational-compatible baseline, then test whether richer models earn their added complexity.
| Code | Plain-English label | Current evidence | Decision |
|---|---|---|---|
NL0 |
Mean PAE/raw-score benchmark | Recovered student and family summaries. Simple, transparent, but no IRT uncertainty and loses signed error. | Keep as comparison benchmark. |
NL1 |
Current .85/.95 3-category GPCM |
Number-line-only and embedded whole-battery GPCM fits both converged. Embedded full-battery fit used 397 Foundation items and 479 Year 1 items. | Main operational-compatible baseline. |
NL2 |
Current .85/.95 with testlet/method structure |
Embedded current-policy structure evidence favours broad score + probe/testlet effects over separate sub-skill dimensions. Student-level NL2 scores were not separately extracted in the latest pass. |
Preferred ordinal upgrade path, not a new live score. |
NL3 |
Ordinal sensitivity policies | Legacy 3-cat, coded 5-cat, consultant 4/5 PAE bands, and binary >=.95 all fitted as sensitivity checks; consultant PAE bands are sparse at item level. |
Sensitivity only. |
NL4 |
Continuous absolute-error challenger | Embedded continuous prototype is highly correlated with the raw-score benchmark, especially in Year 1, but external validation did not beat NL1. |
Research challenger, not promoted yet. |
NL5 |
Signed-error / click-location model | Signed-error checks show target-dependent bias and method/family patterns, especially BNL compression. | Response-process validation model. |
8.1 Threshold evidence
For the current Term 3/4 modelling scope, the category policy comparison is:
| Policy | Foundation category shares | Year 1 category shares | Read |
|---|---|---|---|
Current 3-cat .85/.95 |
34.2 / 32.9 / 32.9% | 30.4 / 36.9 / 32.7% | Best operational-compatible balance. |
Legacy 3-cat .80/.95 |
25.4 / 41.8 / 32.9% | 20.1 / 47.2 / 32.7% | More middle-heavy. |
| Existing coded 5-cat | 25.4 / 22.0 / 19.8 / 18.2 / 14.6% | 20.1 / 25.5 / 21.7 / 18.1 / 14.6% | Feasible sensitivity policy. |
| Consultant 4 PAE bands | 13.3 / 12.1 / 22.0 / 52.7% | 8.2 / 11.9 / 25.5 / 54.4% | Top-heavy; item-level sparsity. |
| Consultant 5 PAE bands | 13.3 / 12.1 / 22.0 / 19.9 / 32.8% | 8.2 / 11.9 / 25.5 / 21.7 / 32.7% | Interpretable but sparse at item level. |
The item-level sparsity check is the stronger reason not to start operationally with the consultant 4/5 PAE bands:
| Policy | Foundation cells <5% | Year 1 cells <5% | Empty item-categories |
|---|---|---|---|
Current 3-cat .85/.95 |
5 | 11 | 0 |
Legacy 3-cat .80/.95 |
6 | 13 | 0 |
| Existing coded 5-cat | 16 | 25 | 0 |
| Consultant 4 PAE bands | 32 | 53 | 1 |
| Consultant 5 PAE bands | 32 | 54 | 1 |
8.2 Response-process evidence
Number-line items have useful signal: median continuous item-rest correlations are about .40–.46 across BNL/UNL families. But the response process is not just ordinal accuracy. Signed-error slopes show systematic target-dependent bias. For example, Year 1 BNL signed-error slopes are around -.38 to -.44, consistent with compression/target-location effects.
This is why continuous and signed-error models remain formal challengers even though the current three-category policy is the baseline.
8.3 Embedded whole-battery comparison
The latest embedded comparison fitted the current .85/.95 ordinal model (NL1) inside the wider scored battery. This was not a Bayesian run; it was a marginal maximum-likelihood mirt fit with binary items and number-line GPCM items.
| Year level | Person-administrations | Items | Number-line ordinal items | Converged | Median SE |
|---|---|---|---|---|---|
| Foundation | 5,065 | 397 | 80 | Yes | 0.407 |
| Year 1 | 5,015 | 479 | 134 | Yes | 0.360 |
Agreement with the raw-score benchmark (NL0) was high but not perfect. NL1 correlated .93–.94 with NL0 in Foundation and .84–.89 in Year 1 across terms. The continuous embedded prototype (NL4) correlated .89–.93 with NL0 in Foundation and .94–.95 in Year 1. This means the continuous prototype is coherent, but mostly tracks the raw-score ordering rather than clearly improving on the ordinal model.
External validation also favoured retaining NL1 for now:
| Anchor | Foundation NL0 |
Foundation NL1 |
Foundation NL4 |
Year 1 NL0 |
Year 1 NL1 |
Year 1 NL4 |
|---|---|---|---|---|---|---|
| PAT scaled score | .430 | .455 | .343 | .395 | .449 | .379 |
| Teacher rating | .508 | .508 | .487 | .496 | .544 | .473 |
These are converging anchors, not gold standards. But they do not support replacing the ordinal baseline with the continuous prototype at this stage.
9 Remaining evidence gates
The embedded comparison resolves the immediate question: the continuous prototype does not yet displace the current .85/.95 ordinal baseline. The remaining gates are now narrower:
- extract student-level scores from the
NL2testlet/method structure, rather than relying only on recovered structure-comparison evidence; - fit a full mixed-response continuous model if we want to keep testing
NL4as more than a z-score prototype; - develop
NL5signed-error/click-location as a response-process validity model, not a direct score replacement; - continue fairness/form/chair checks, especially BNL vs UNLC vs UNLNC and Year 1 Term 1 repeated targets;
- evaluate uncertainty near any future operational cut-points.
External anchors are converging evidence, not gold standards. PAT Maths cells below n = 50 should be suppressed or marked descriptive-only; cells from 50 to 99 should be treated as exploratory.
10 Final lock-in comparison
A final lock-in pass compared the serious number-line variants under one common protocol: raw-score benchmark (NL0), simple ordinal GPCM (NL1), the default ability + probe/testlet ordinal model (NL2), the continuous prototype (NL4), and signed-error diagnostics (NL5).
The operational target is now NL2: the current .85/.95 number-line categories inside the default ability + probe/testlet model. This is the model challengers must beat.
| Model | Year level | Person-administrations | Items | NL ordinal items | Testlets | Converged | Median SE |
|---|---|---|---|---|---|---|---|
NL1 |
Foundation | 5,065 | 397 | 80 | — | Yes | .407 |
NL1 |
Year 1 | 5,015 | 479 | 134 | — | Yes | .360 |
NL2 |
Foundation | 5,065 | 397 | 80 | 18 | Yes | .500 |
NL2 |
Year 1 | 5,015 | 479 | 134 | 18 | Yes | .469 |
The higher NL2 standard errors are expected because the model absorbs probe/testlet dependence rather than treating every item response as fully independent evidence.
External validation remains broadly supportive of the ordinal path:
| Anchor | Foundation NL0 |
Foundation NL1 |
Foundation NL2 |
Foundation NL4 |
Year 1 NL0 |
Year 1 NL1 |
Year 1 NL2 |
Year 1 NL4 |
|---|---|---|---|---|---|---|---|---|
| PAT scaled score | .430 | .455 | .440 | .343 | .395 | .449 | .460 | .379 |
| Teacher rating | .508 | .508 | .500 | .487 | .496 | .544 | .534 | .473 |
Screening checks at approximately 80% specificity also support keeping the ordinal path. In Year 1 PAT-risk validation, NL2 had the strongest AUC among compared models (.743) and the highest sensitivity at fixed specificity. Foundation results were closer, but the continuous result is not enough to promote NL4 because it remains a prototype rather than a full continuous IRT model.
11 Decision statement
Lock the selected three-category policy (<0.85, 0.85–<0.95, >=0.95) inside the default ability + probe/testlet model as the operational-compatible number-line treatment for the next scoring version (NL2). It preserves graded number-line evidence, avoids the sparsity seen in finer PAE bands, and handles local dependence better than the simple ordinal baseline (NL1). It is not a teacher-facing achievement band or a claim that 0.85 and 0.95 are operational cut scores.
Do not declare PCM/GPCM the final psychometric answer for all time. Number-line responses are continuous spatial-estimation responses, and signed-error evidence shows meaningful response-process structure. Continuous and signed-error models should remain formal challengers. However, the current lock-in evidence does not justify replacing the default ordinal testlet model (NL2) with the continuous prototype or signed-error diagnostic model.