Scoring timed subtests: how should unreached items count?
Last updated 13 June 2026, 05:59 PM Sydney time
What we are investigating
ENSSA needs a fluency-based measure that helps identify students who may need extra support. For timed subtests, that means the score should reflect not only whether students answer correctly, but also how far they progress through the intended item set within the time limit.
Normally omitted responses are treated as missing, but for this timed-performance purpose we need to test whether trailing unreached items — items after a student’s last response when time runs out — should instead count as zero credit.
The key distinction is between accuracy on only the items a student reached and performance over the full timed item set.
Accuracy on reached items can look high for a student who answered most reached items correctly but reached very few items.
Timed score, by contrast, should distinguish that pattern from a student who answered the same number correctly while progressing further through the subtest.
What the response patterns show
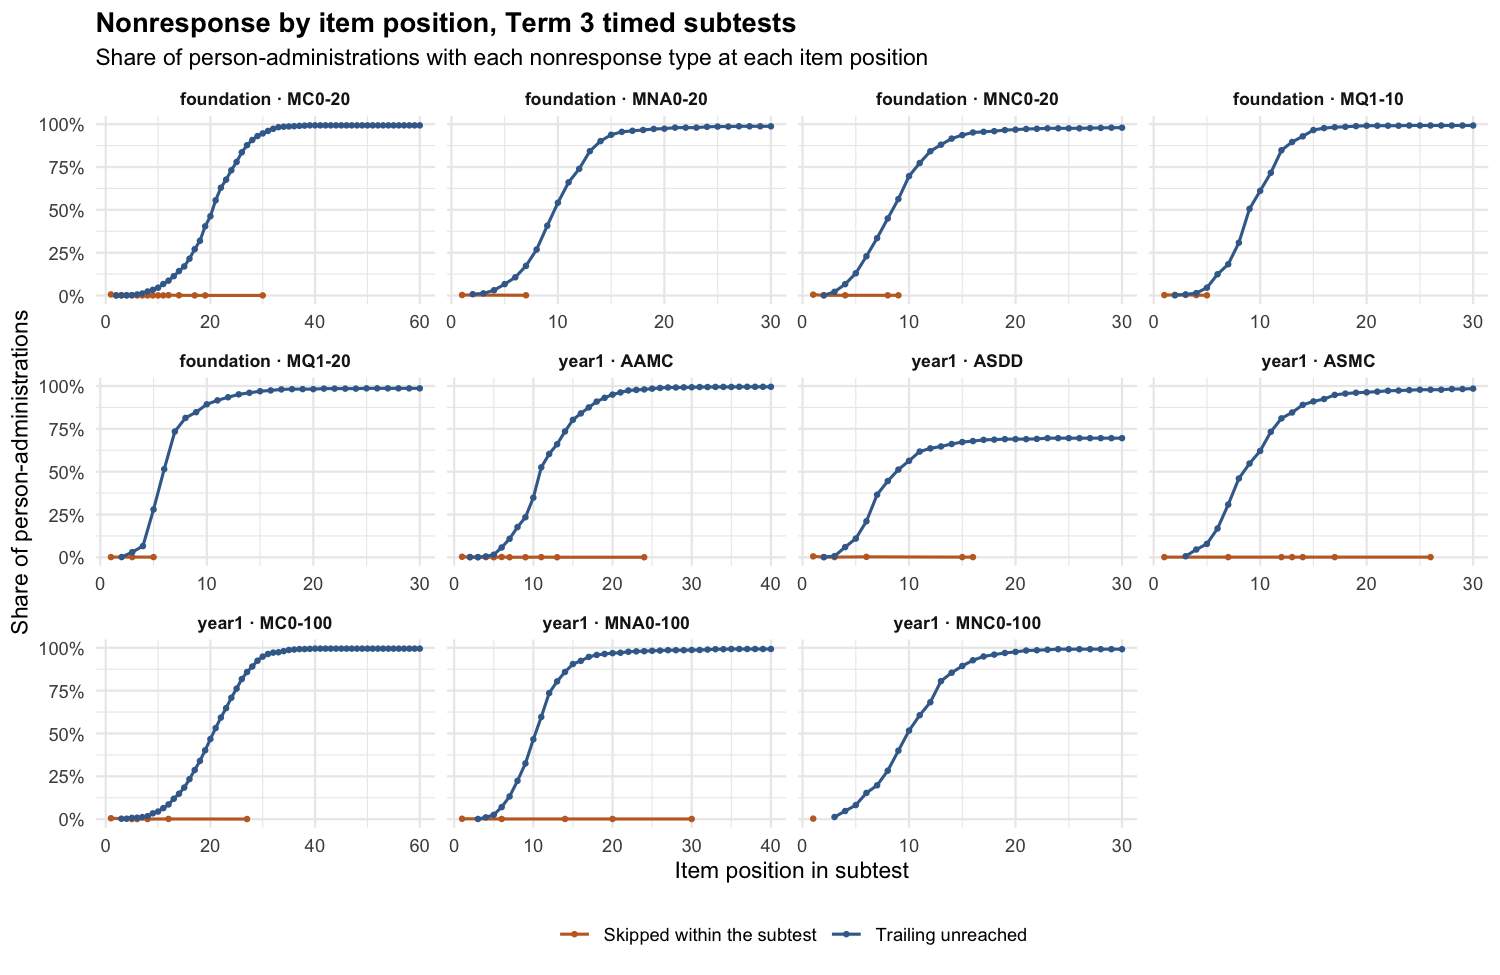
Most students stop well before the end of timed subtests. The median student completes between 10% and 32% of items depending on the subtest. Skipped items inside the subtest are negligible: the skipped-within-subtest rate stays below 1% at every item position in every plotted subtest.
The table below shows why reached-item accuracy is not a timed-performance score: students are highly accurate on the items they reach, but they reach only a small share of the intended item set. The final column treats the full timed subtest as the denominator, so unreached trailing items add no correct responses.
Year
Subtest
N students
Median completion rate
Mean accuracy on reached items
Mean score: correct / total items
Foundation
MC0-20
1443
0.317
0.916
0.295
Foundation
MNA0-20
648
0.267
0.859
0.239
Foundation
MNC0-20
785
0.233
0.848
0.192
Foundation
MQ1-10
789
0.267
0.930
0.244
Foundation
MQ1-20
655
0.167
0.828
0.133
Year 1
AAMC
1495
0.225
0.910
0.231
Year 1
ASDD
703
0.100
0.768
0.098
Year 1
ASMC
789
0.233
0.767
0.199
Year 1
MC0-100
1503
0.317
0.909
0.295
Year 1
MNA0-100
867
0.225
0.898
0.200
Year 1
MNC0-100
633
0.267
0.929
0.265
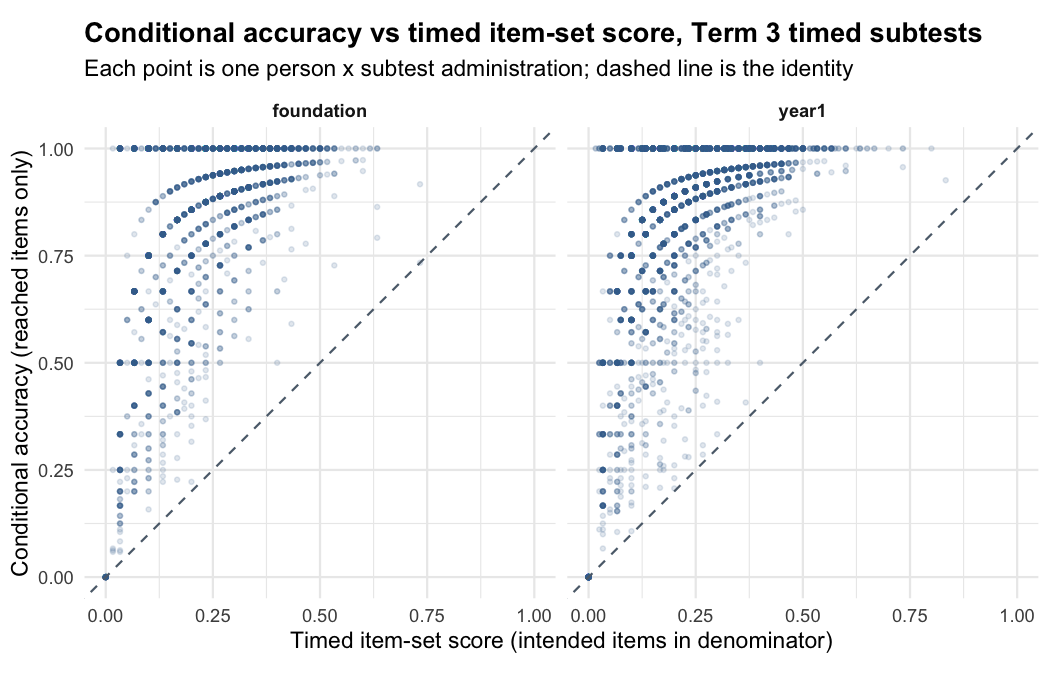
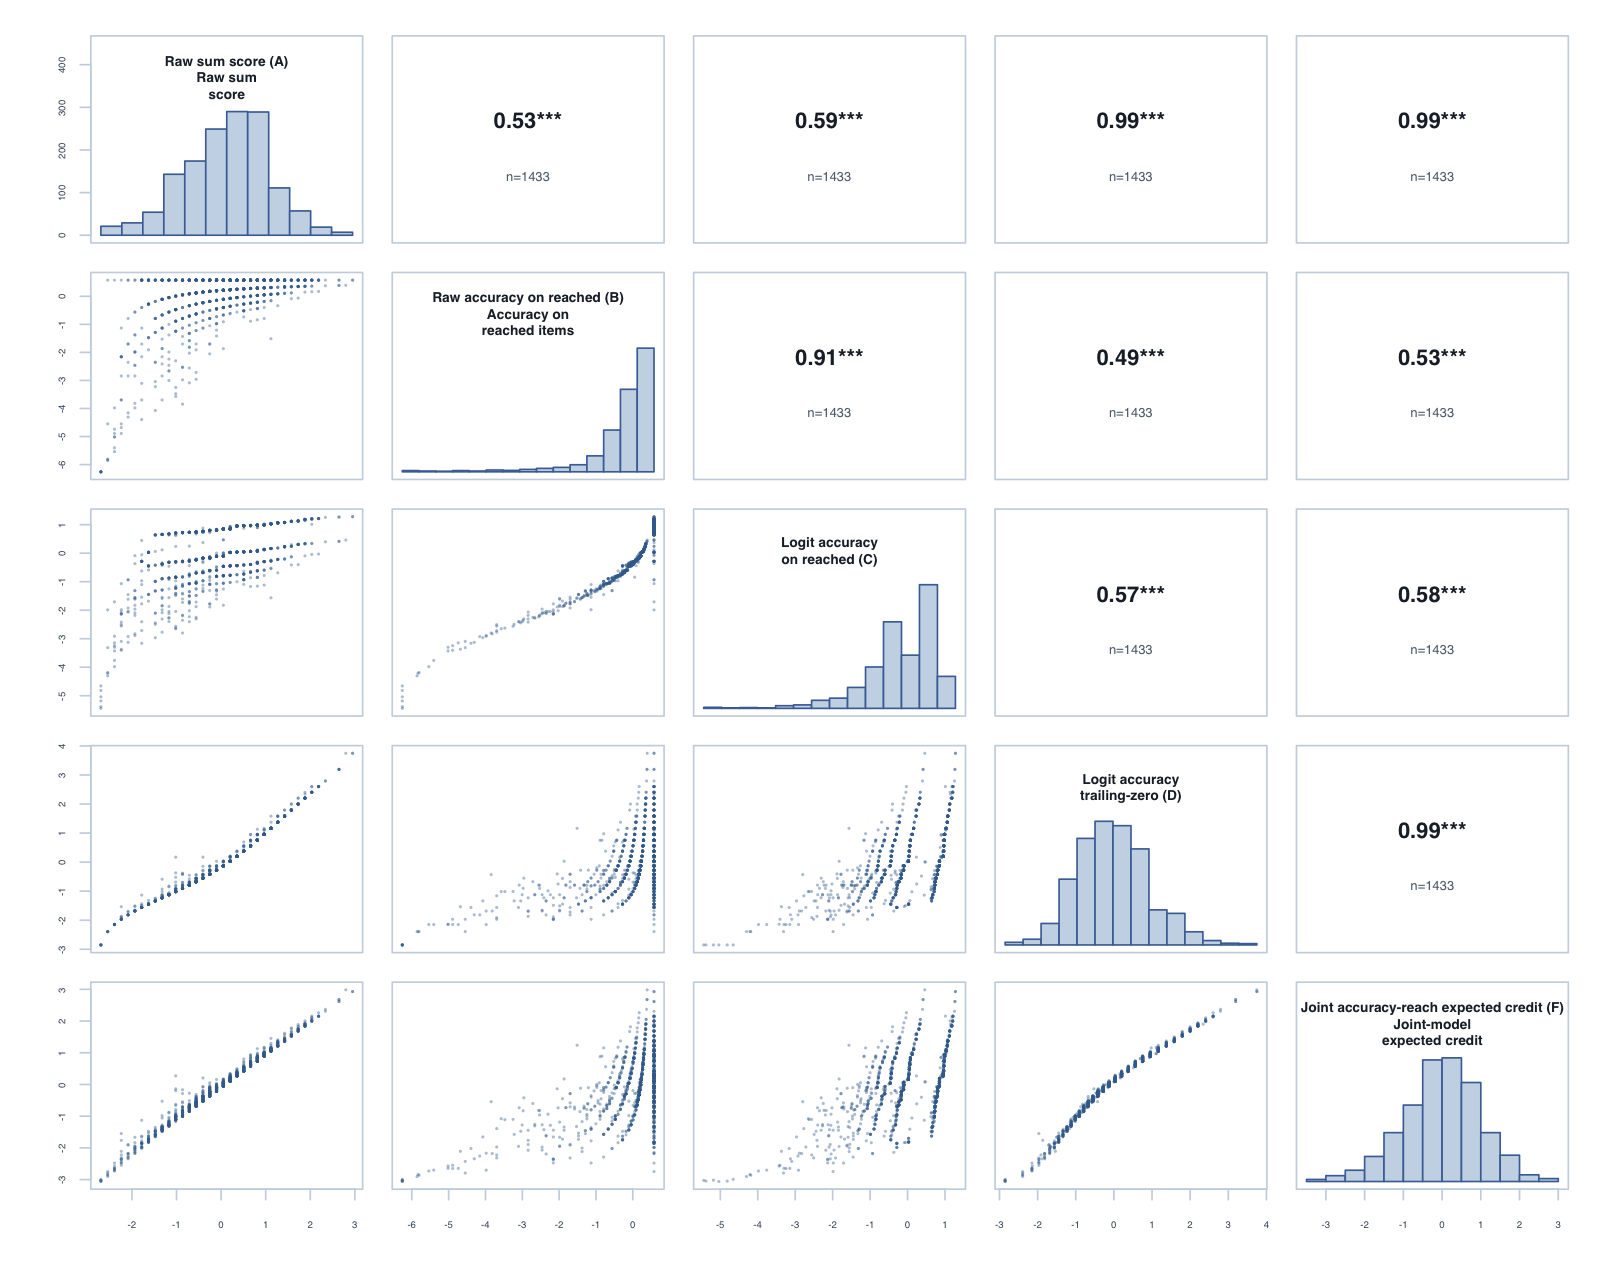
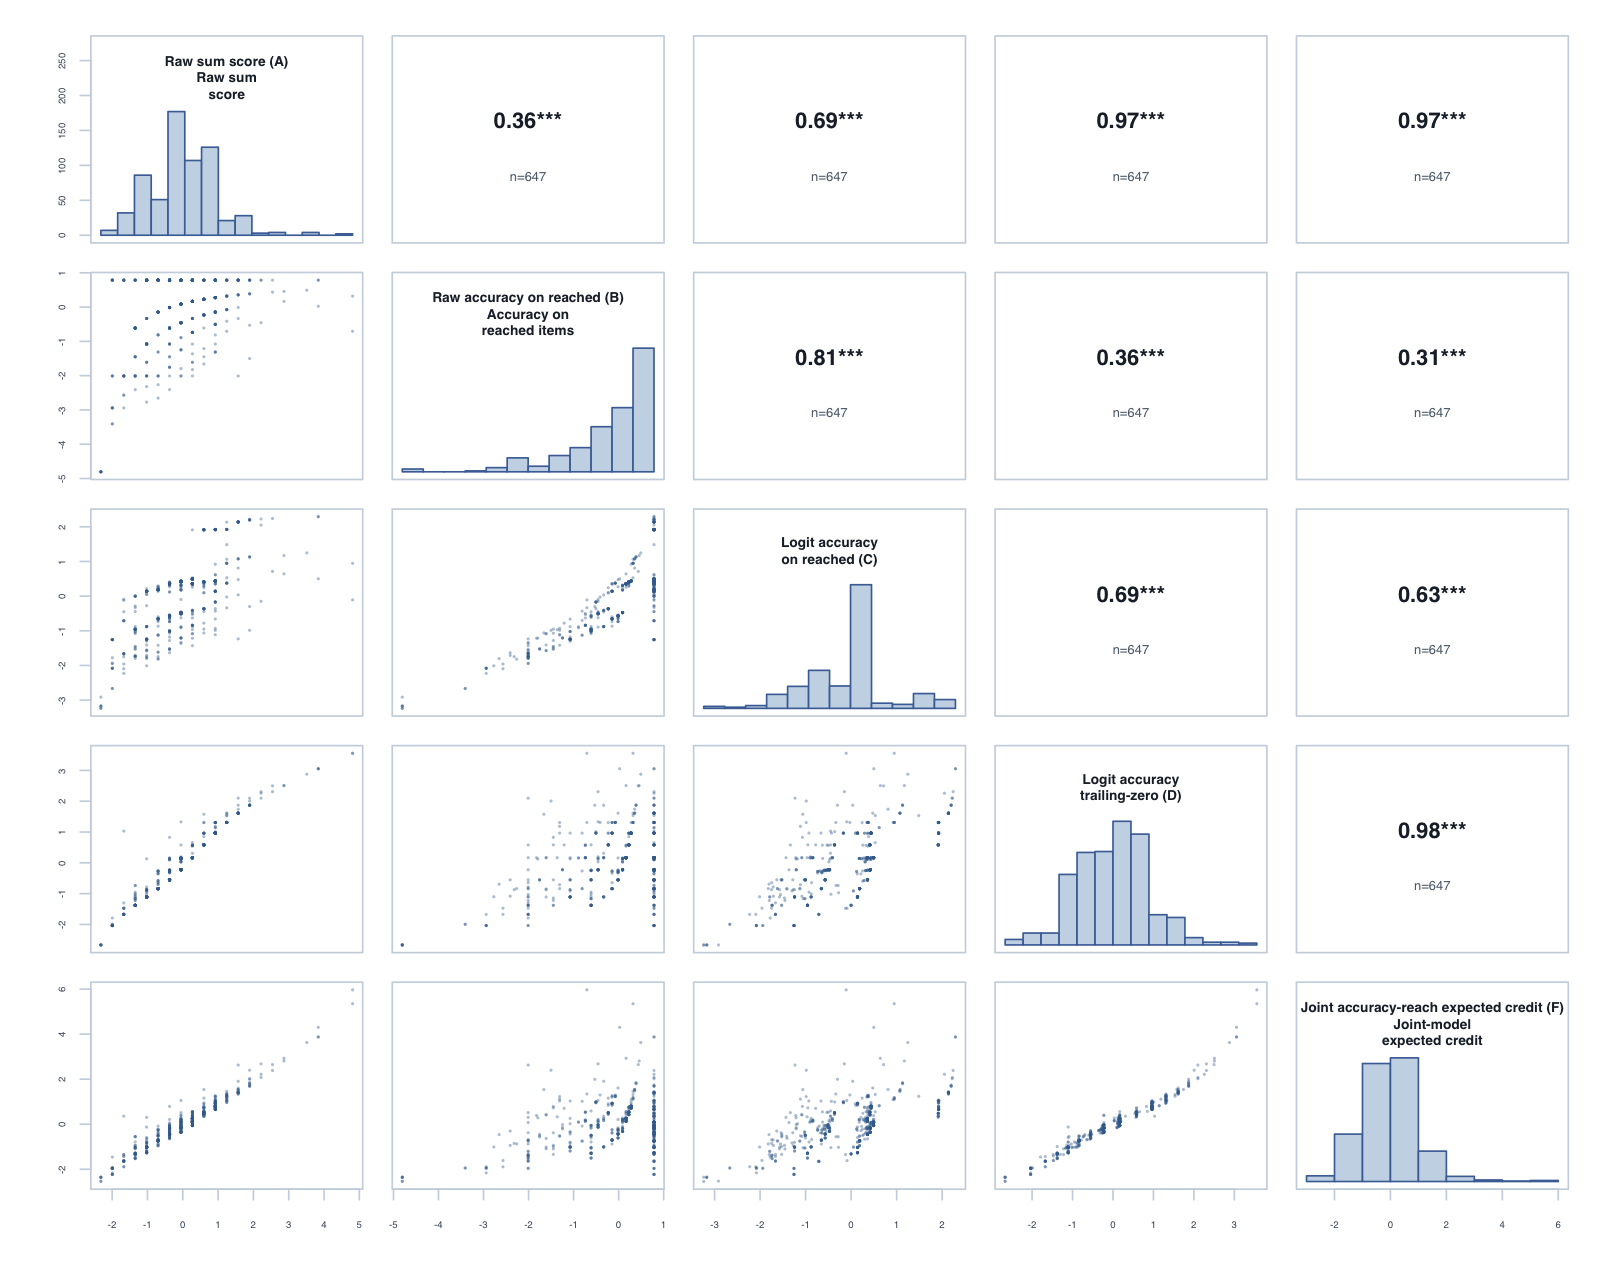
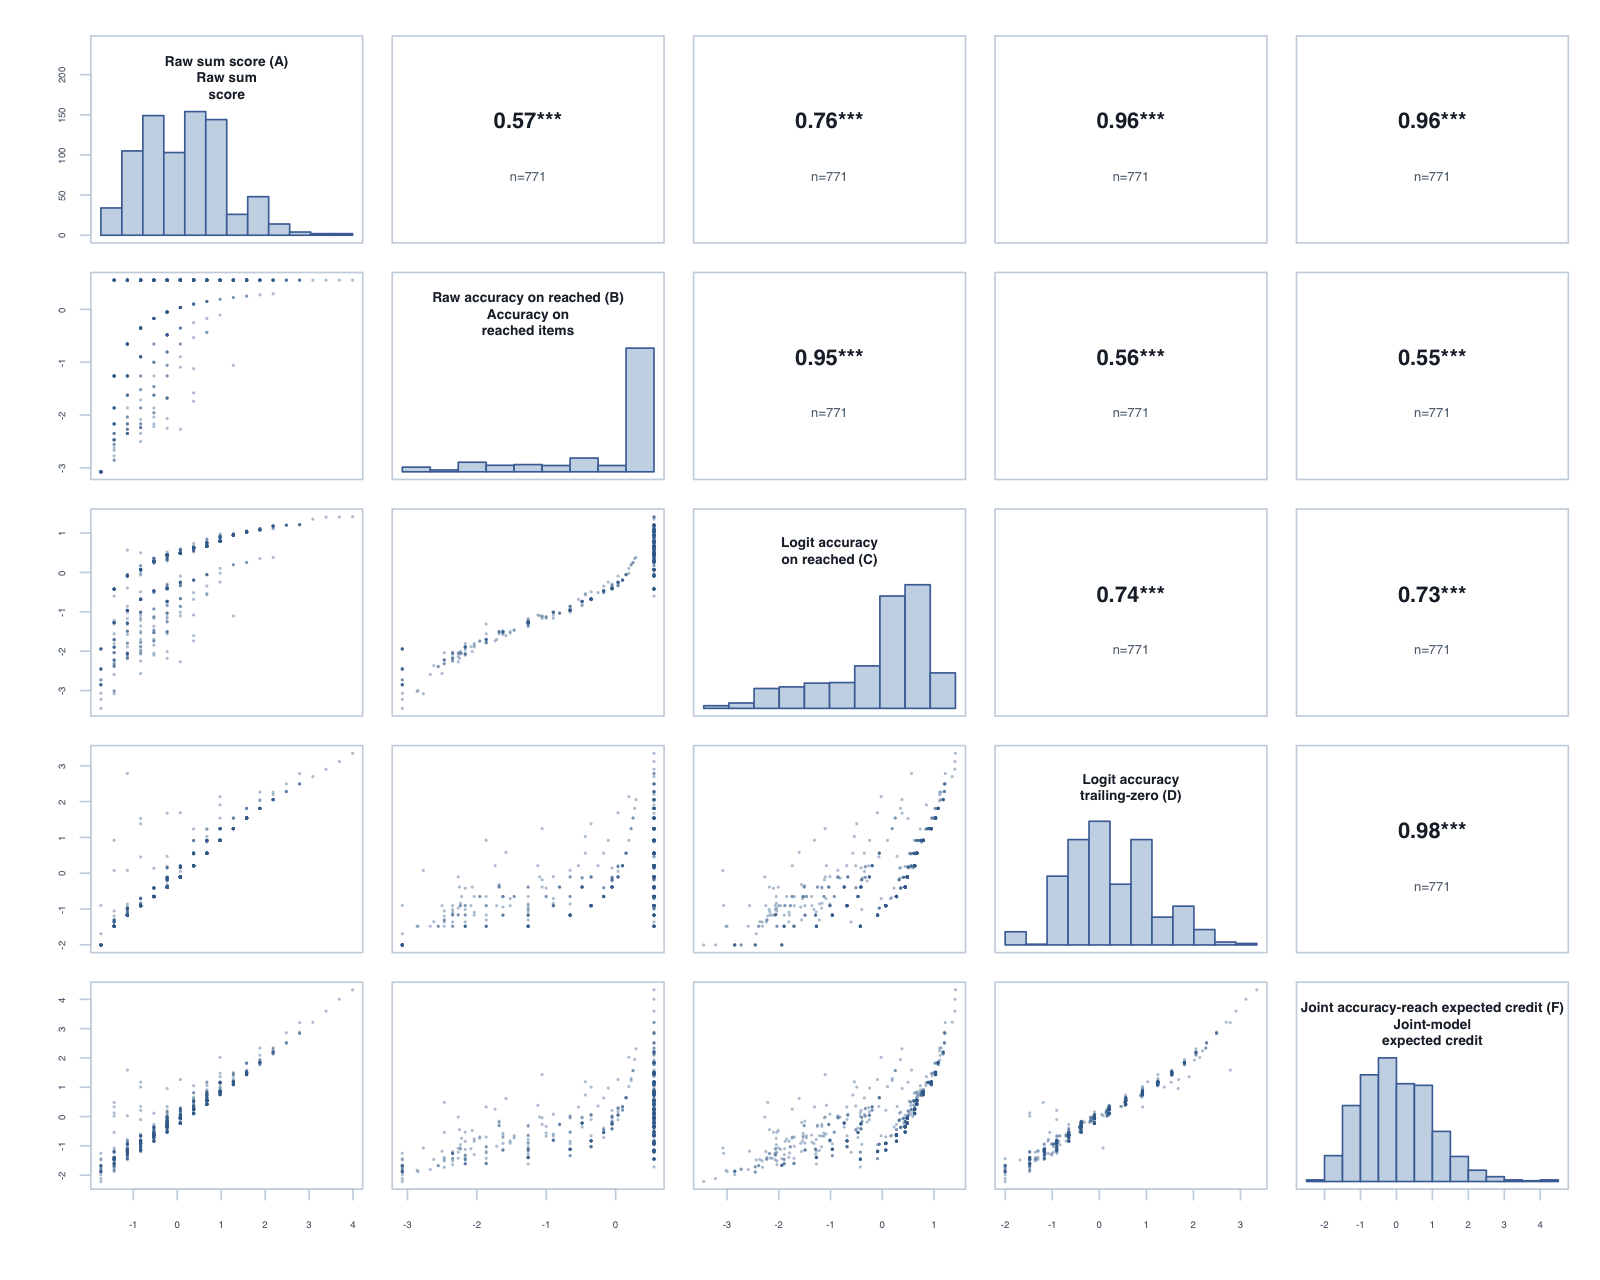
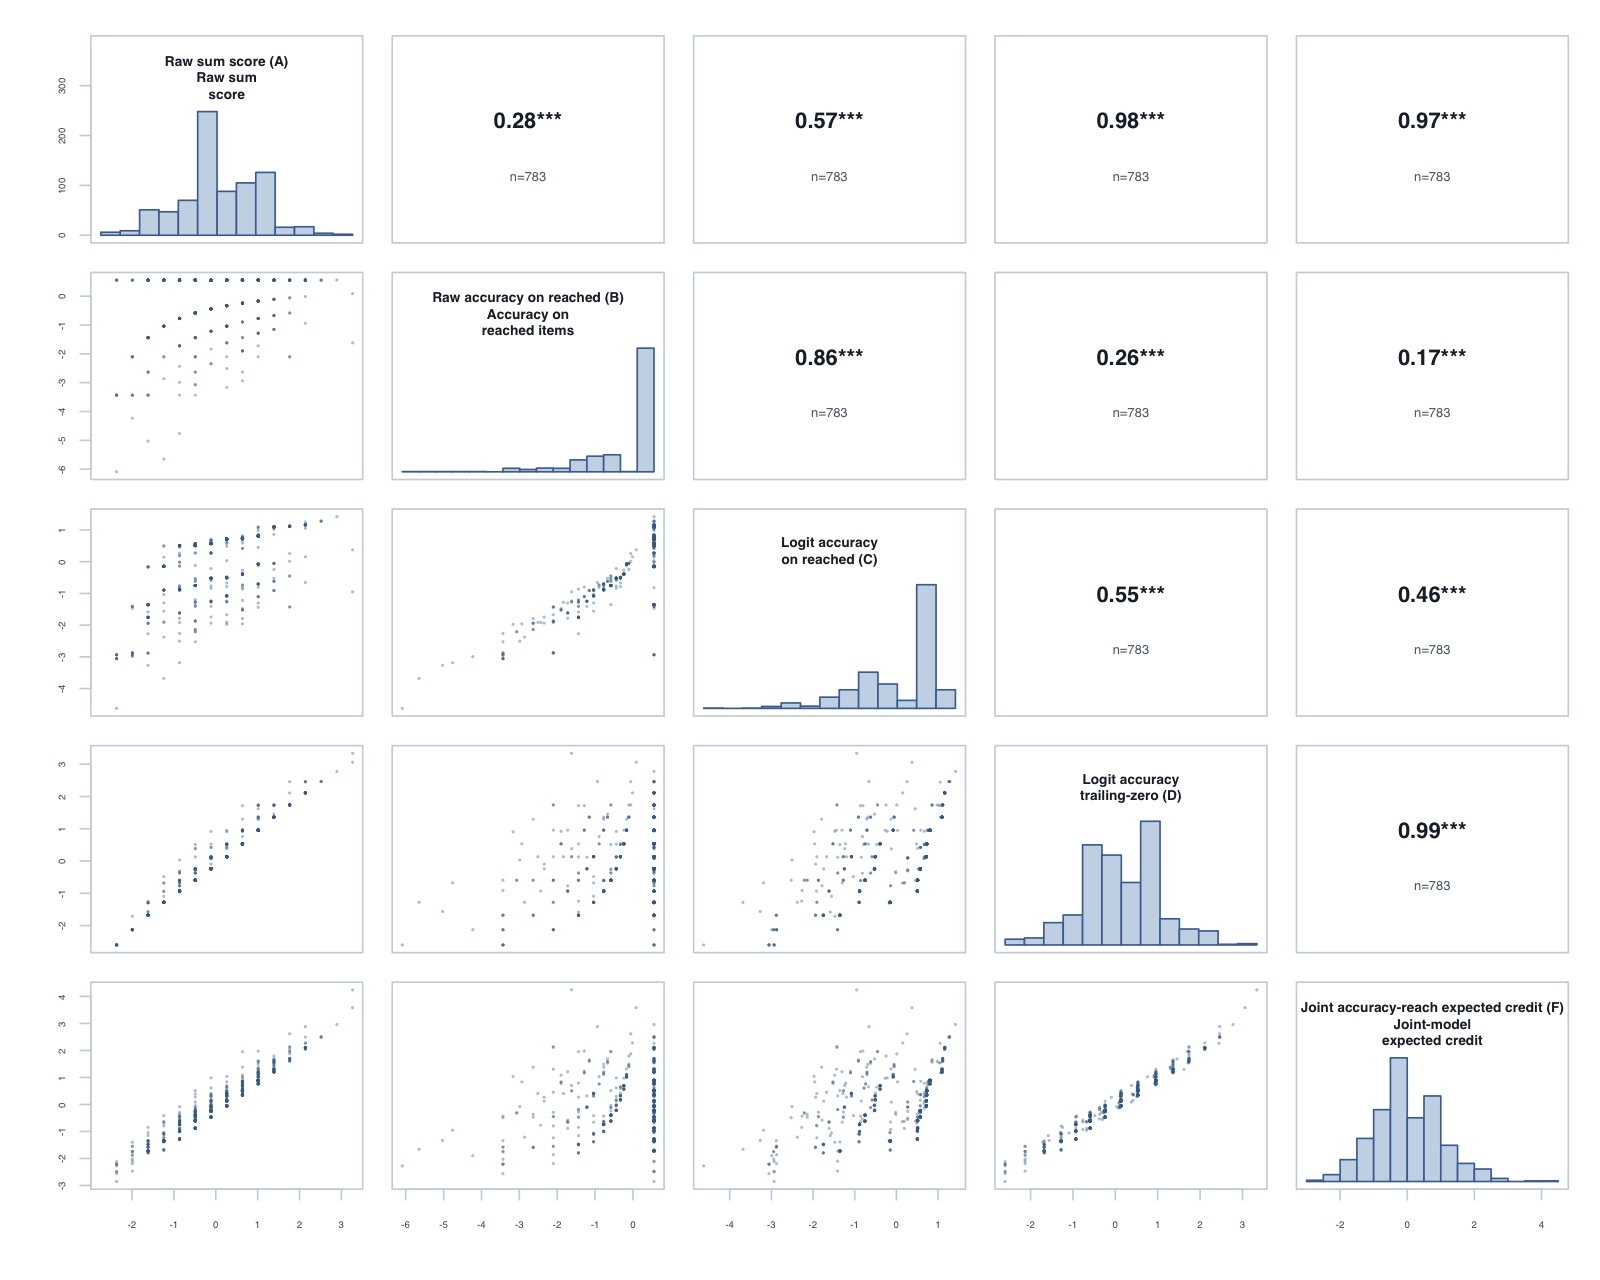
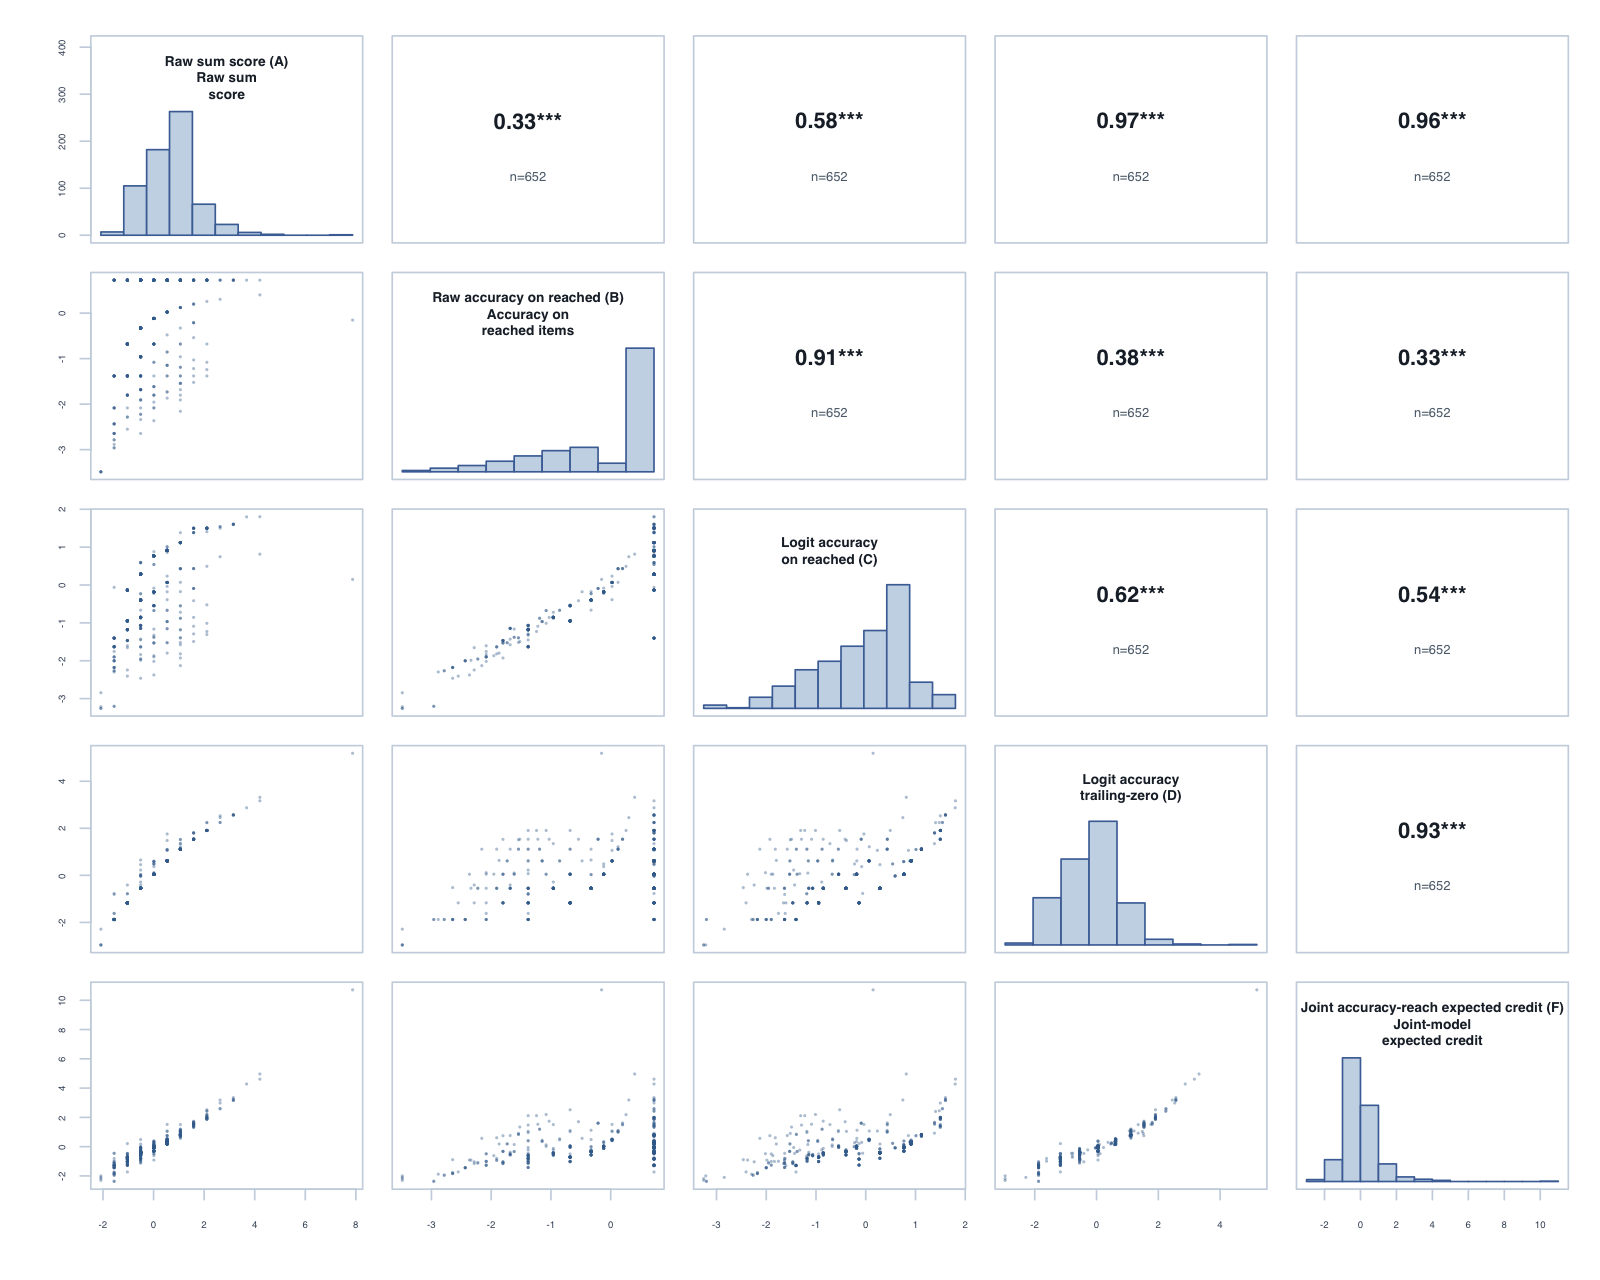
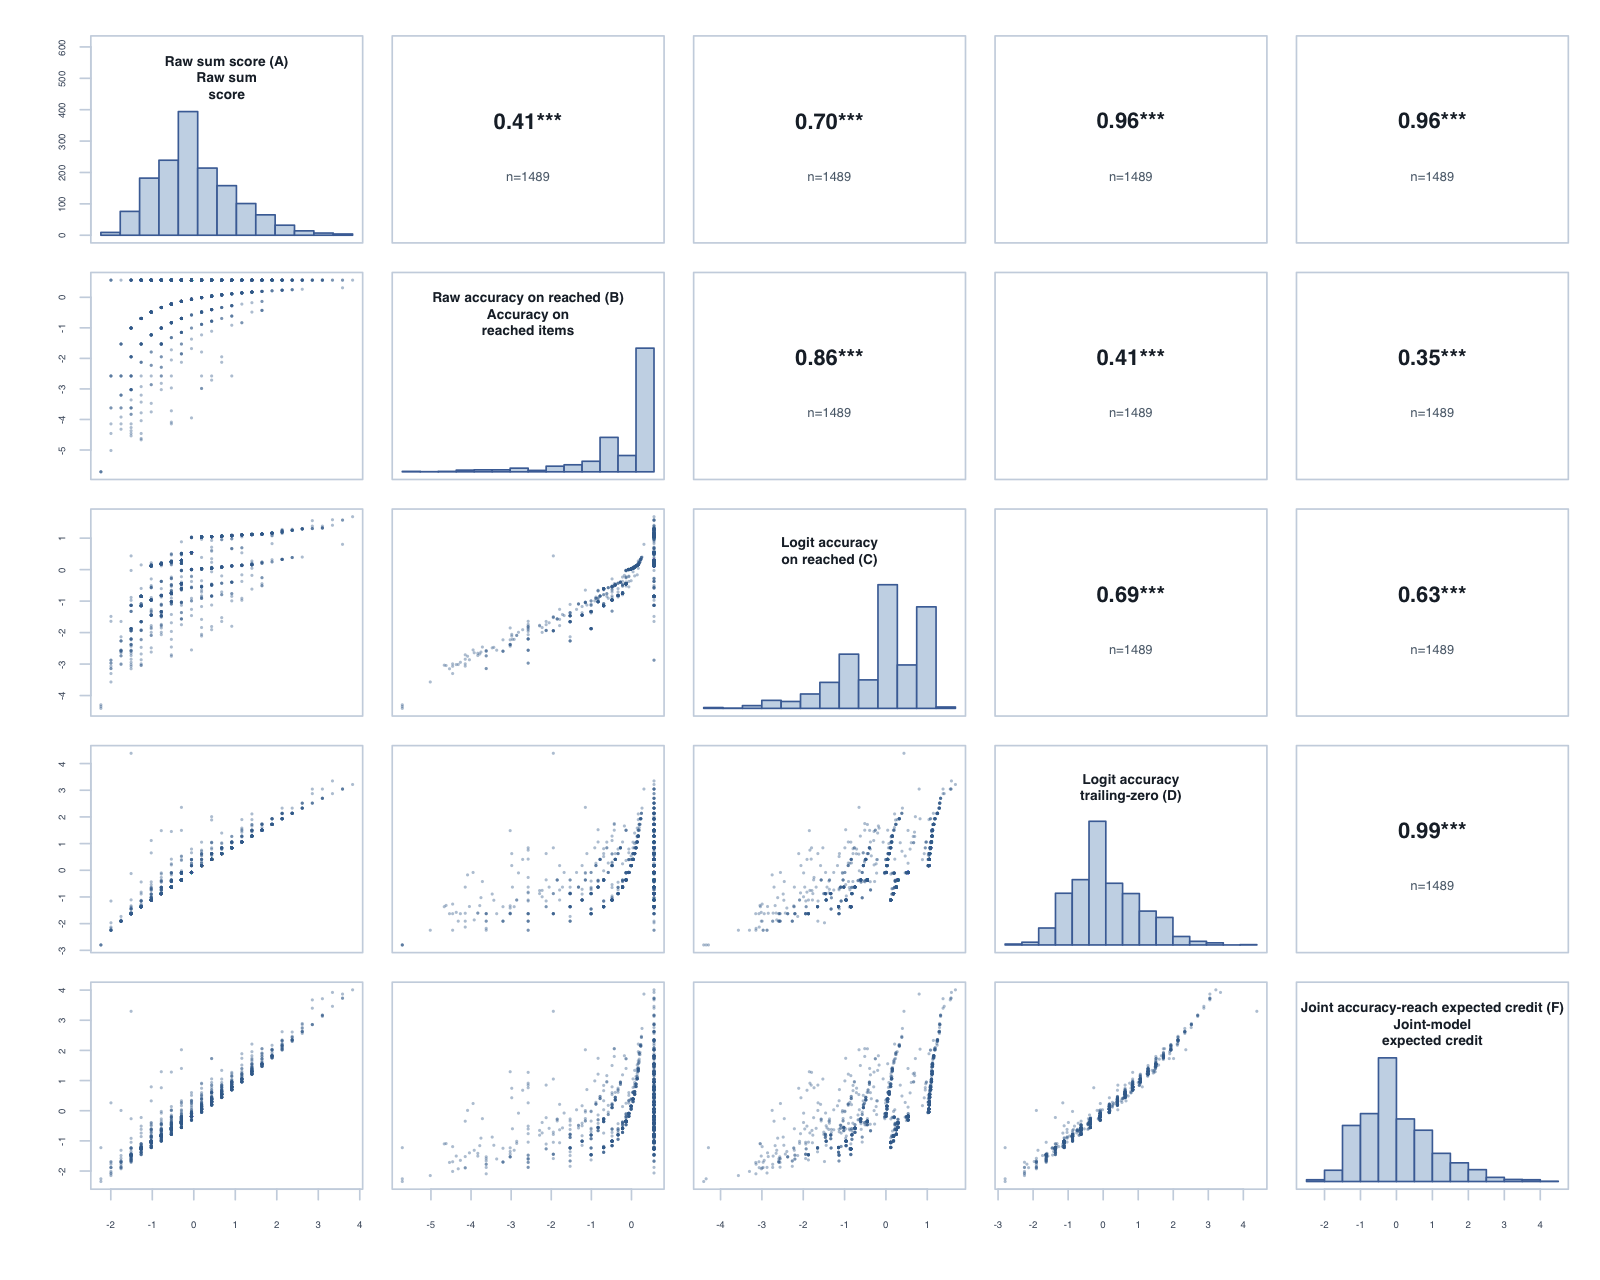
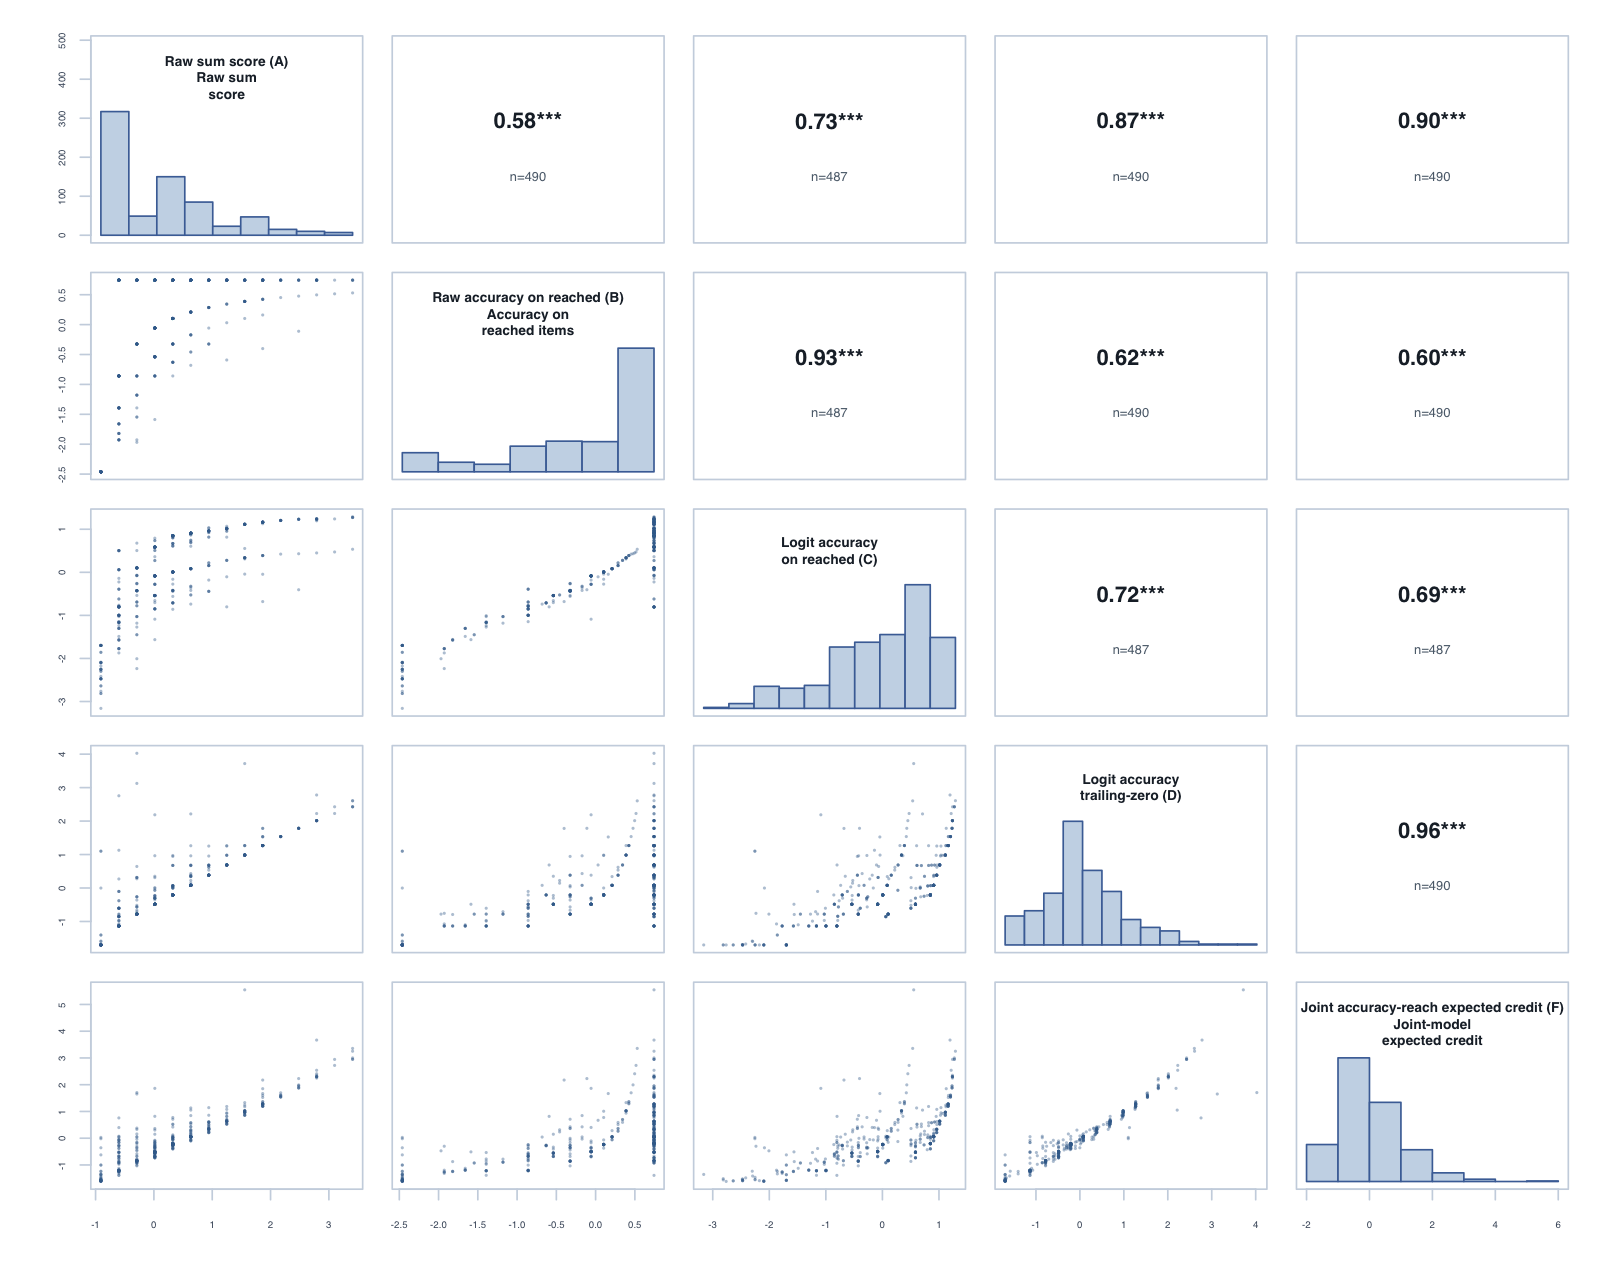
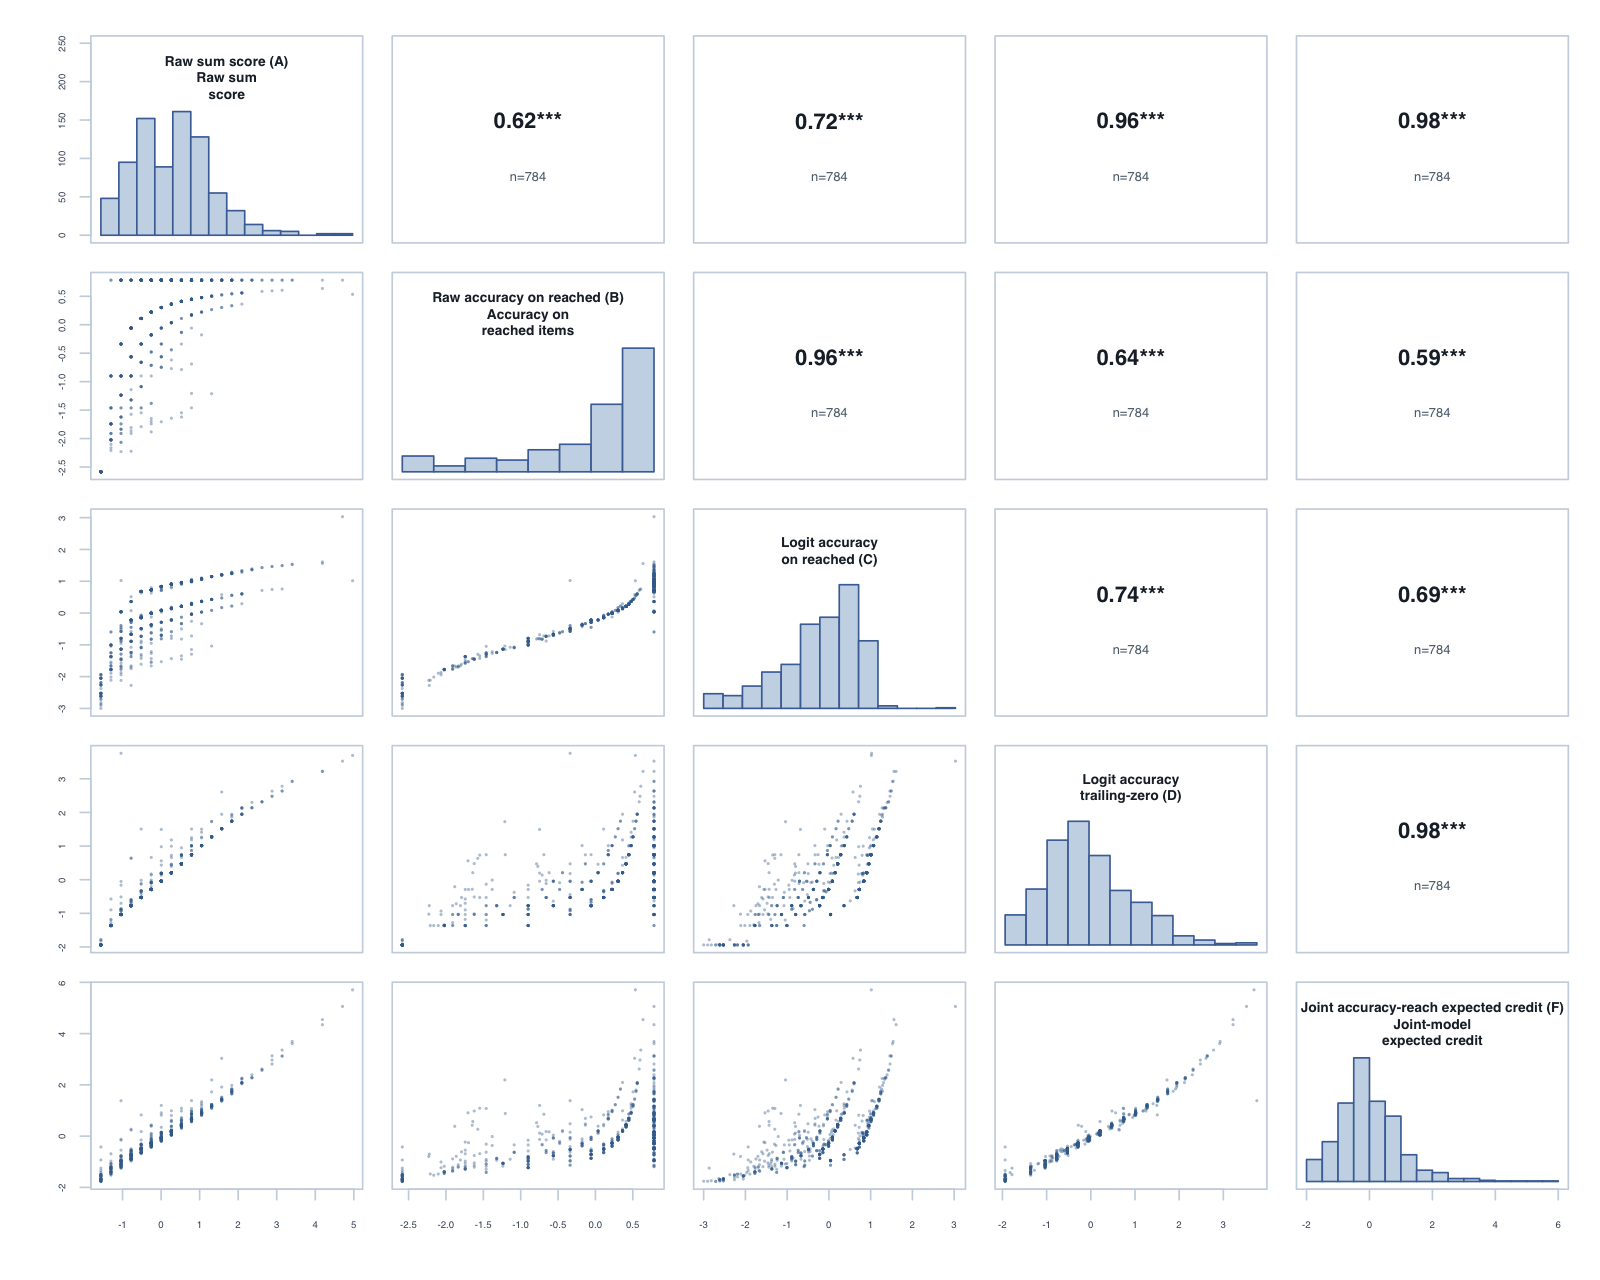
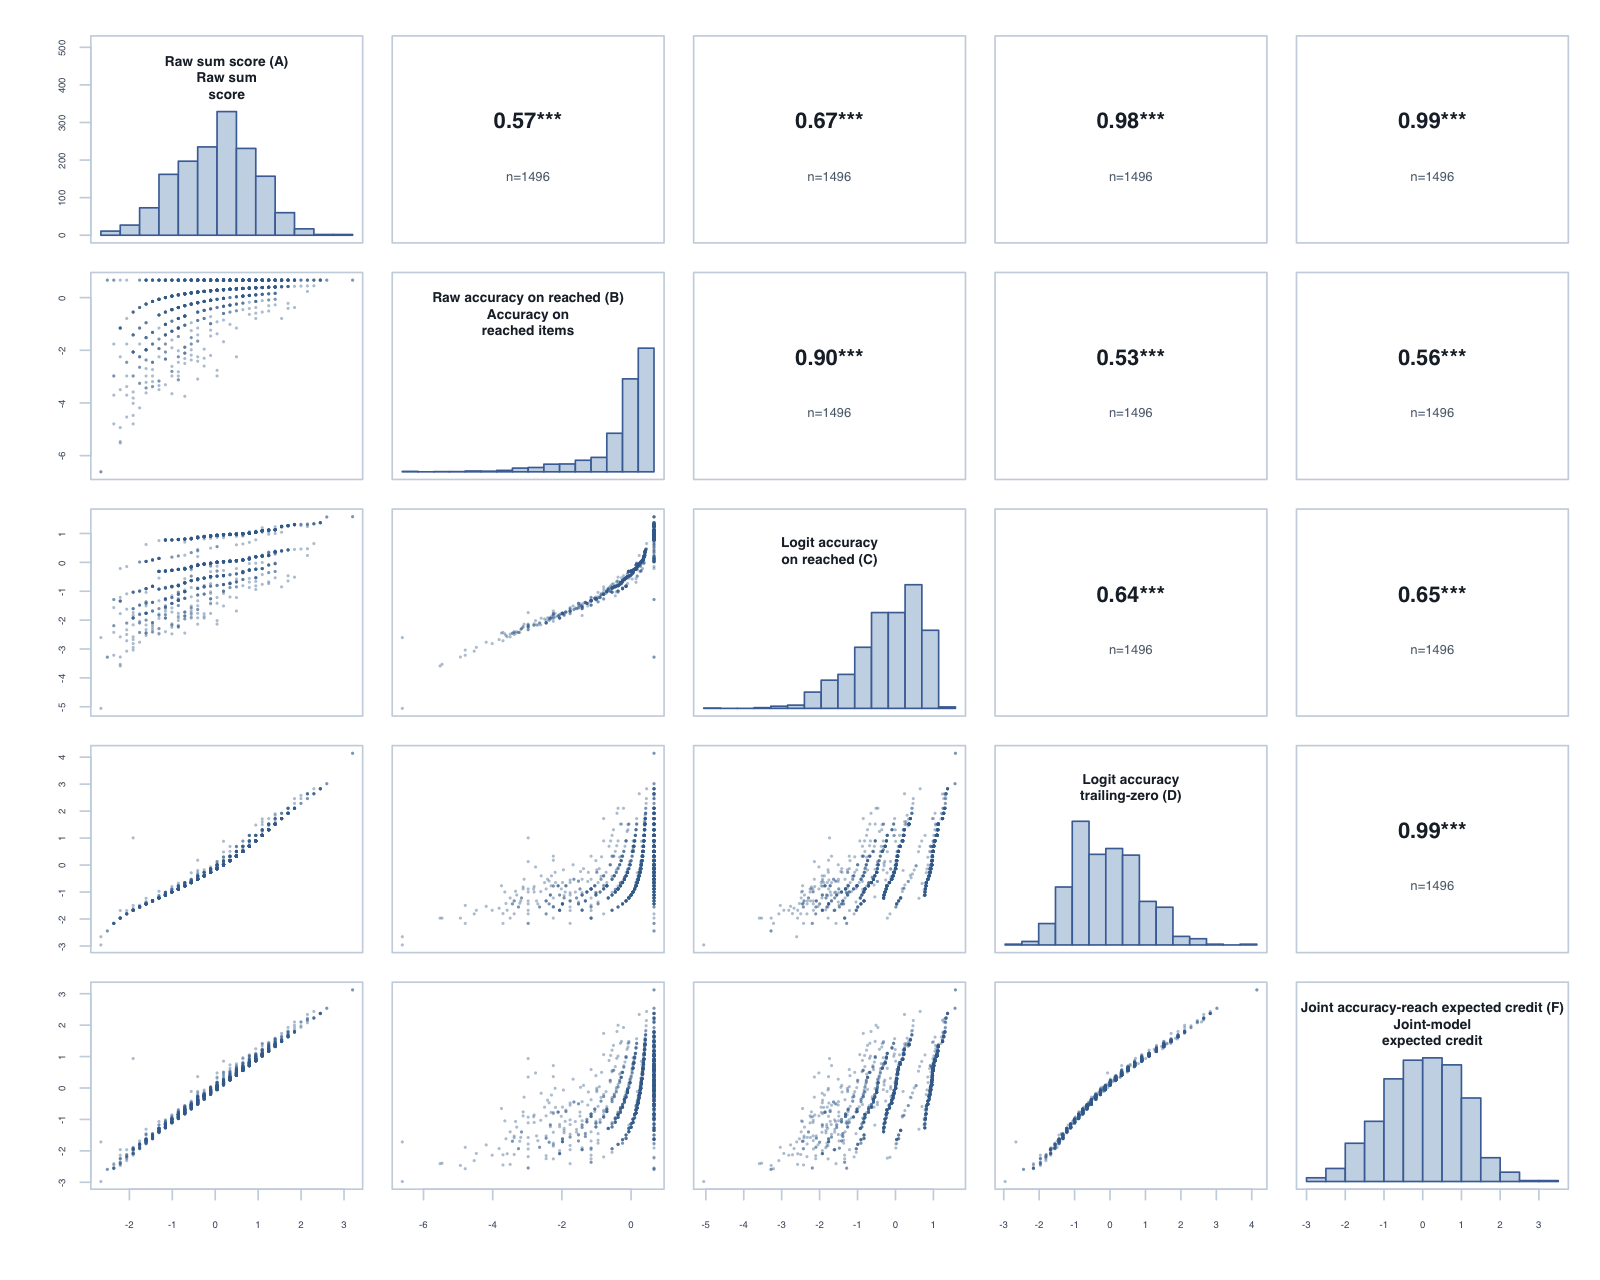
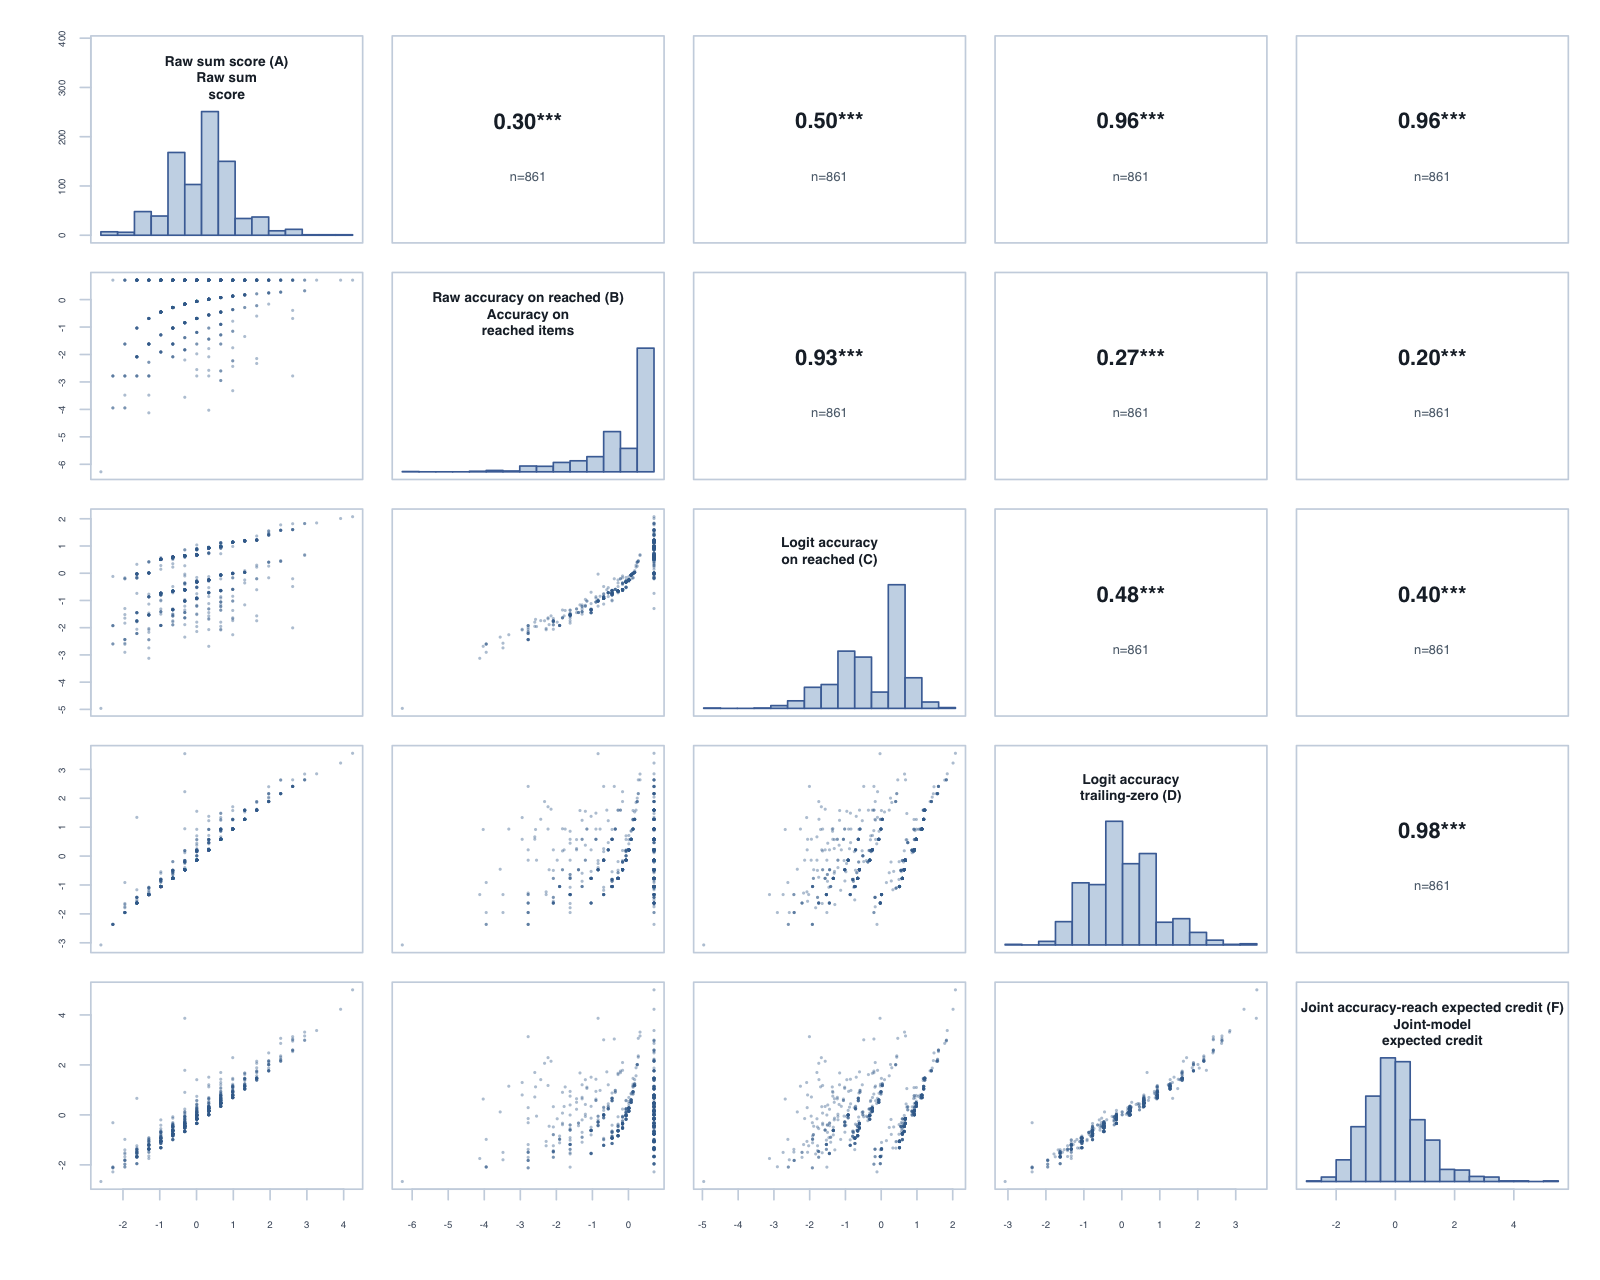
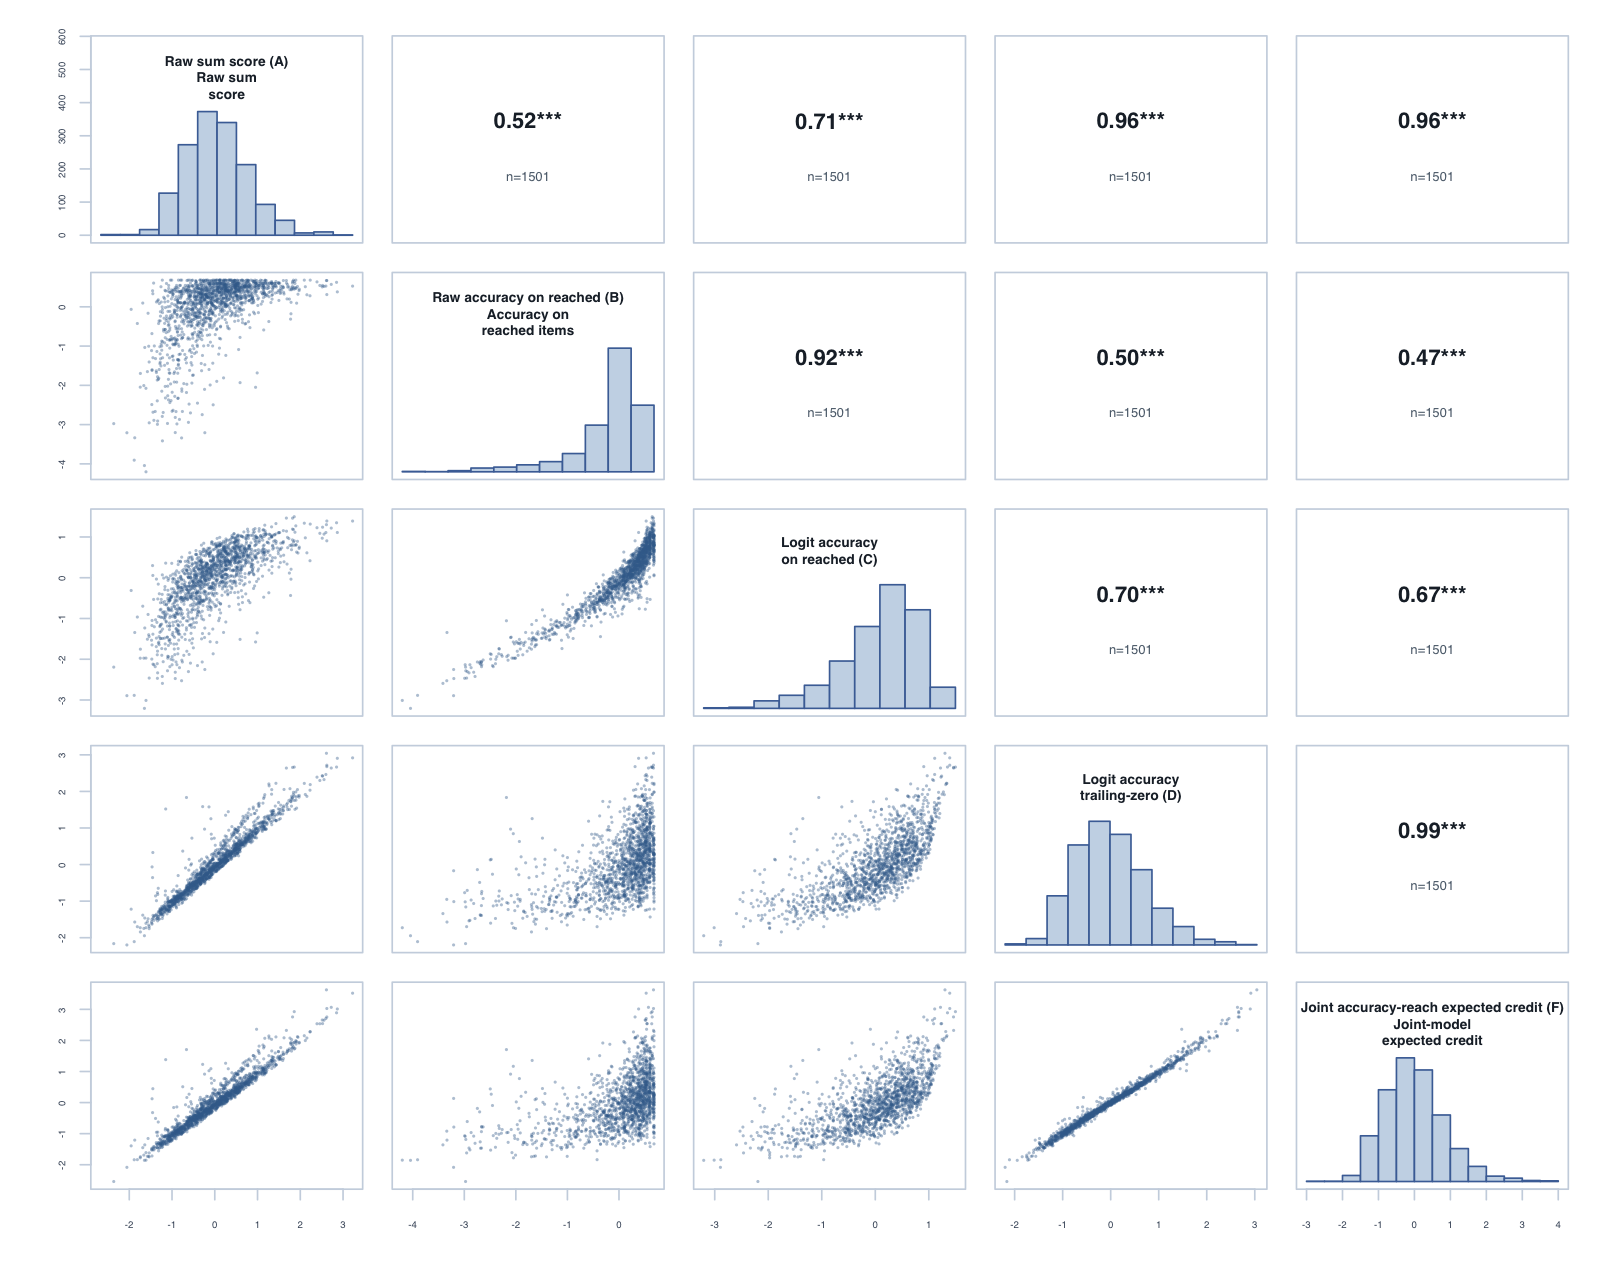
In the scatterplot below, points far above the diagonal are students whose reached items were mostly correct but who reached relatively few items — exactly the cases where reached-item accuracy and the full timed score disagree.
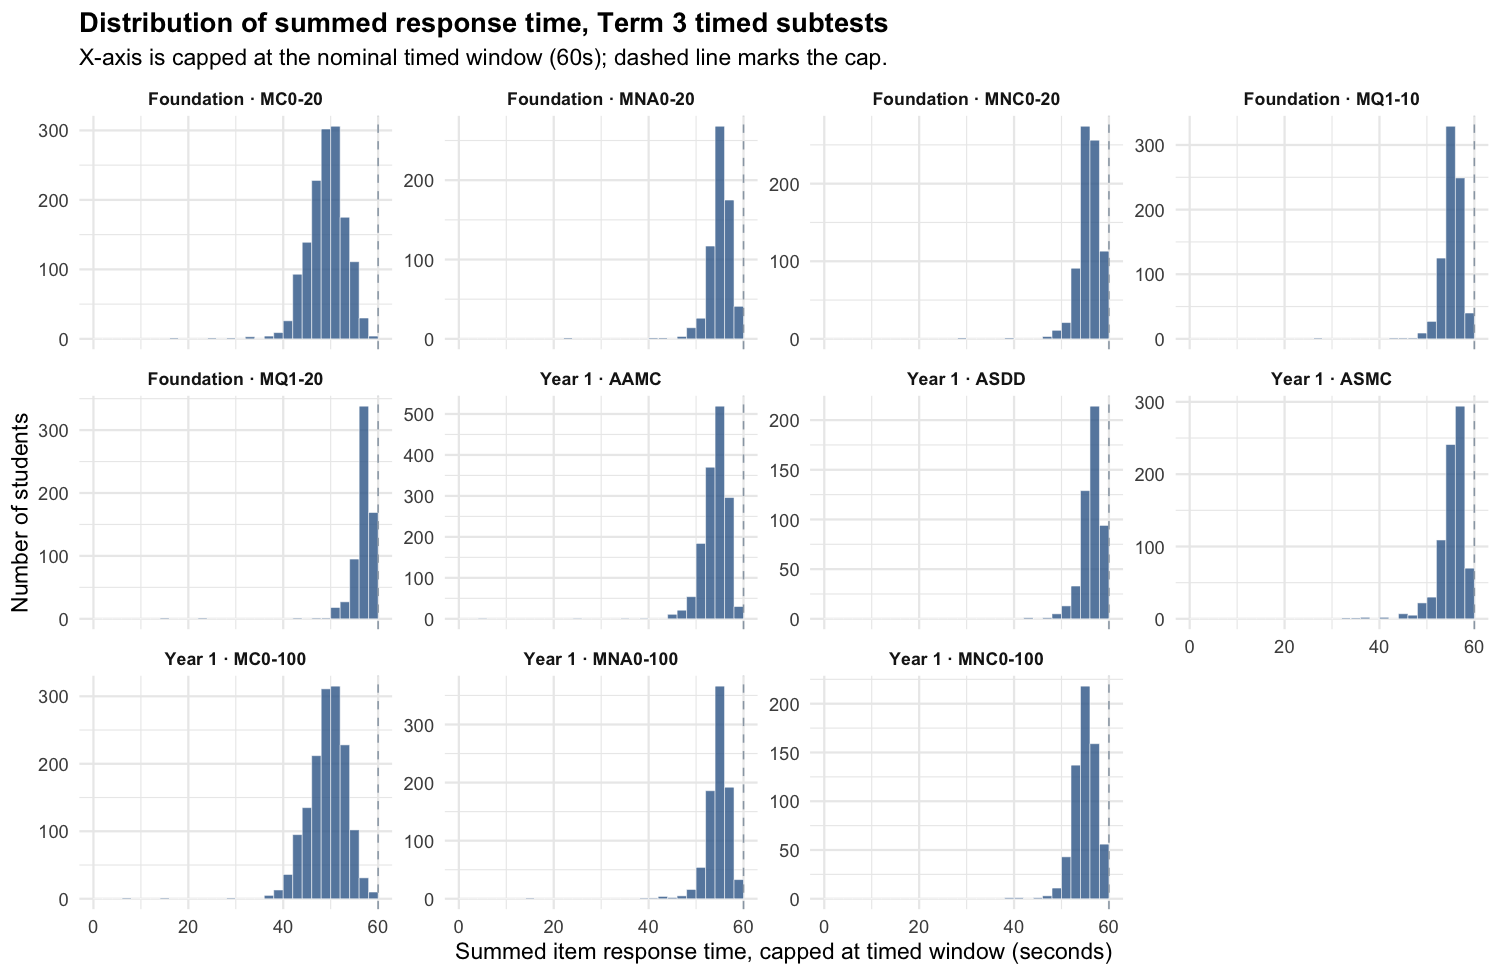
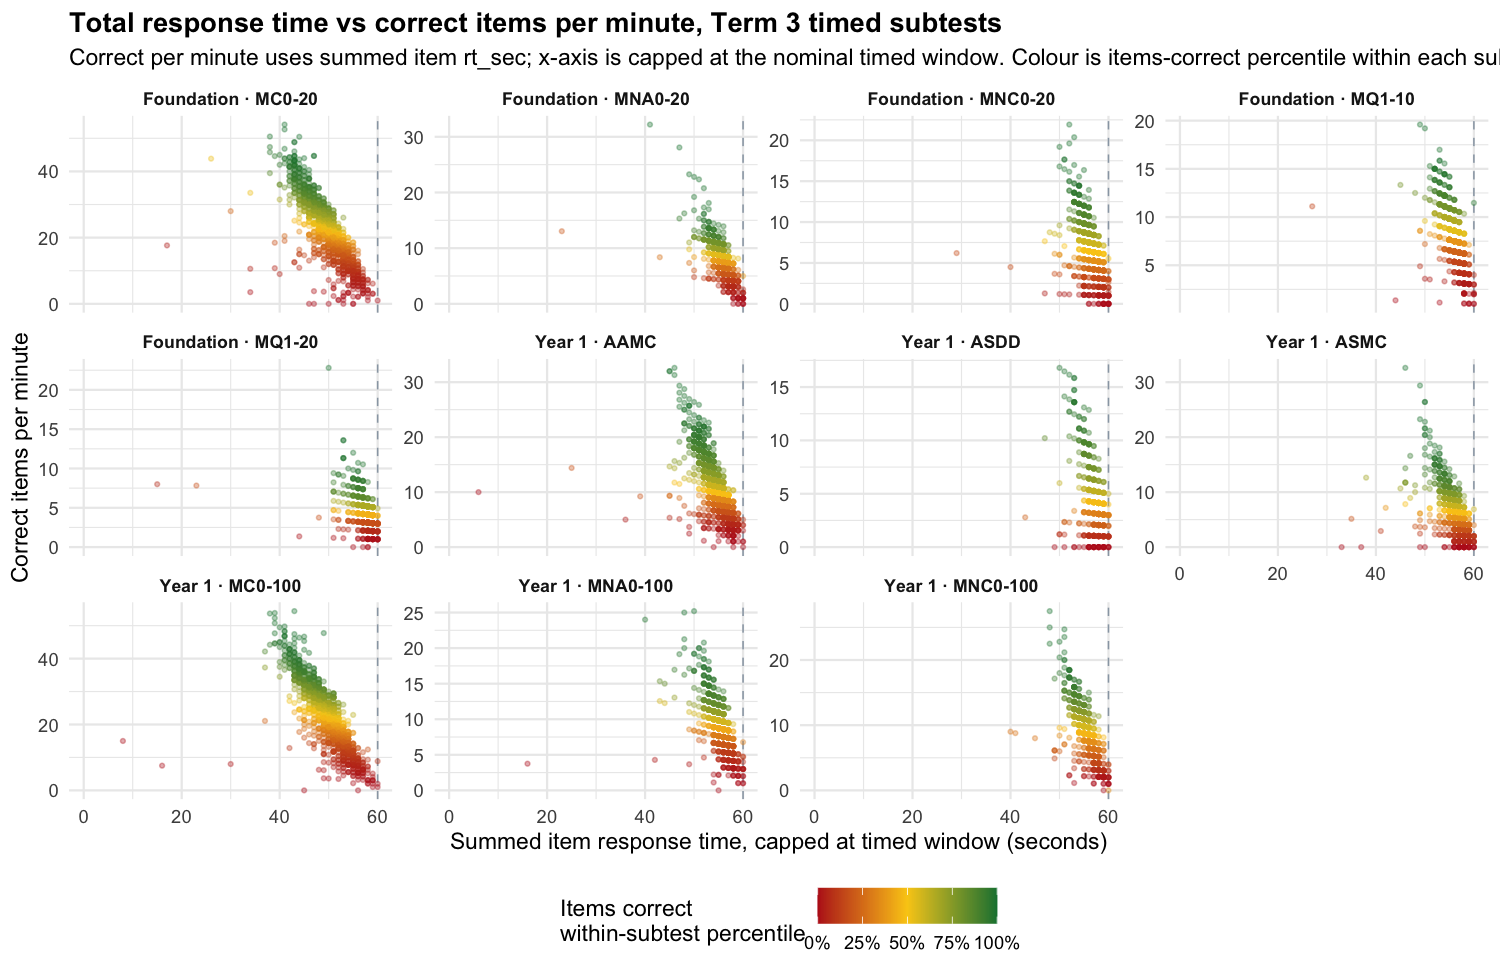
Many students have summed response time below the timed limit even though they did not finish all items. That matters mainly for correct-per-minute: raw sum score is not affected because it does not use response time as a denominator. In these data, there are very few cases where students with few correct items get unusually high correct-per-minute scores. The main point is simpler: correct-per-minute from summed rt_sec is harder to interpret than the raw number correct.
Scoring methodology
We computed scores five different ways to separate two questions: how accurate students were on the items they reached, and how much credit they earned over the full timed item set.
Raw sum score (A)correct items
Total credit earned across the intended timed item set. The denominator is a scoring convention, not a claim that every item was displayed on screen.
Raw accuracy on reached (B)correct / reached
Correct responses divided by reached items. Useful diagnostic context, but not a timed-performance score.
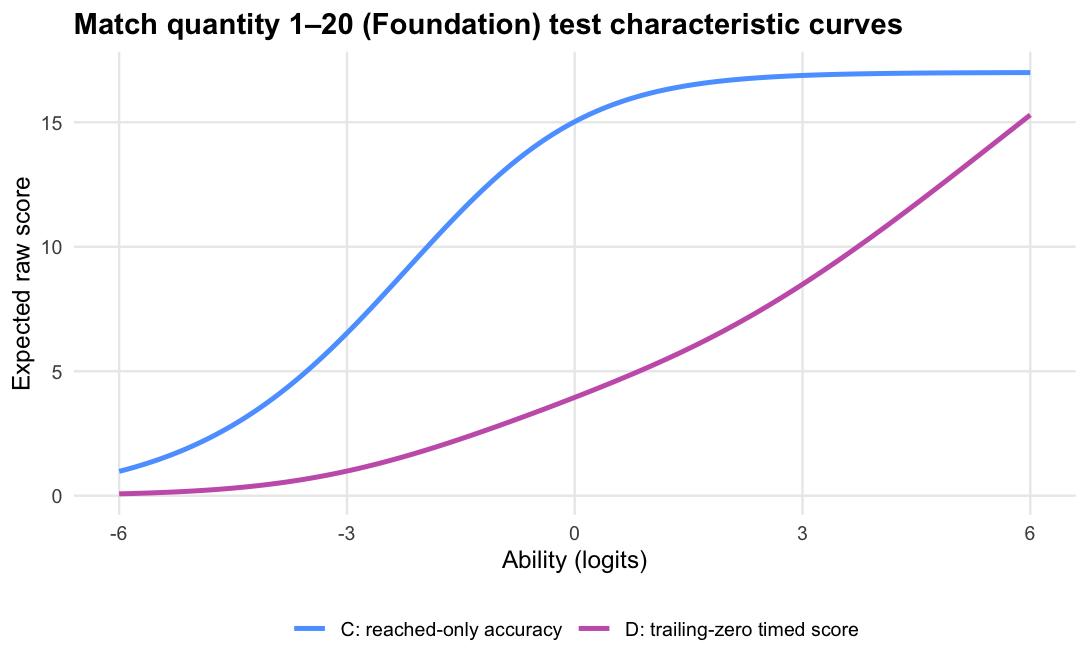
Logit accuracy on reached (C)IRT over reached items
A logit-scale item-response score using reached items only; unreached items are treated as missing.
Logit accuracy trailing-zero (D)IRT with unreached = 0
A logit-scale item-response score where trailing unreached items are scored zero; skipped and leading gaps remain missing. This is the policy candidate.
A Bayesian joint model of item reach and correctness if reached. It reports expected credit over the intended timed item set.
There are two main kinds of missing data. Trailing unreached items are items after the student’s last valid response; for timed-performance scoring, these count as zero credit. Skipped, leading, or invalid rows do not show how far the student progressed, so they are treated as missing.
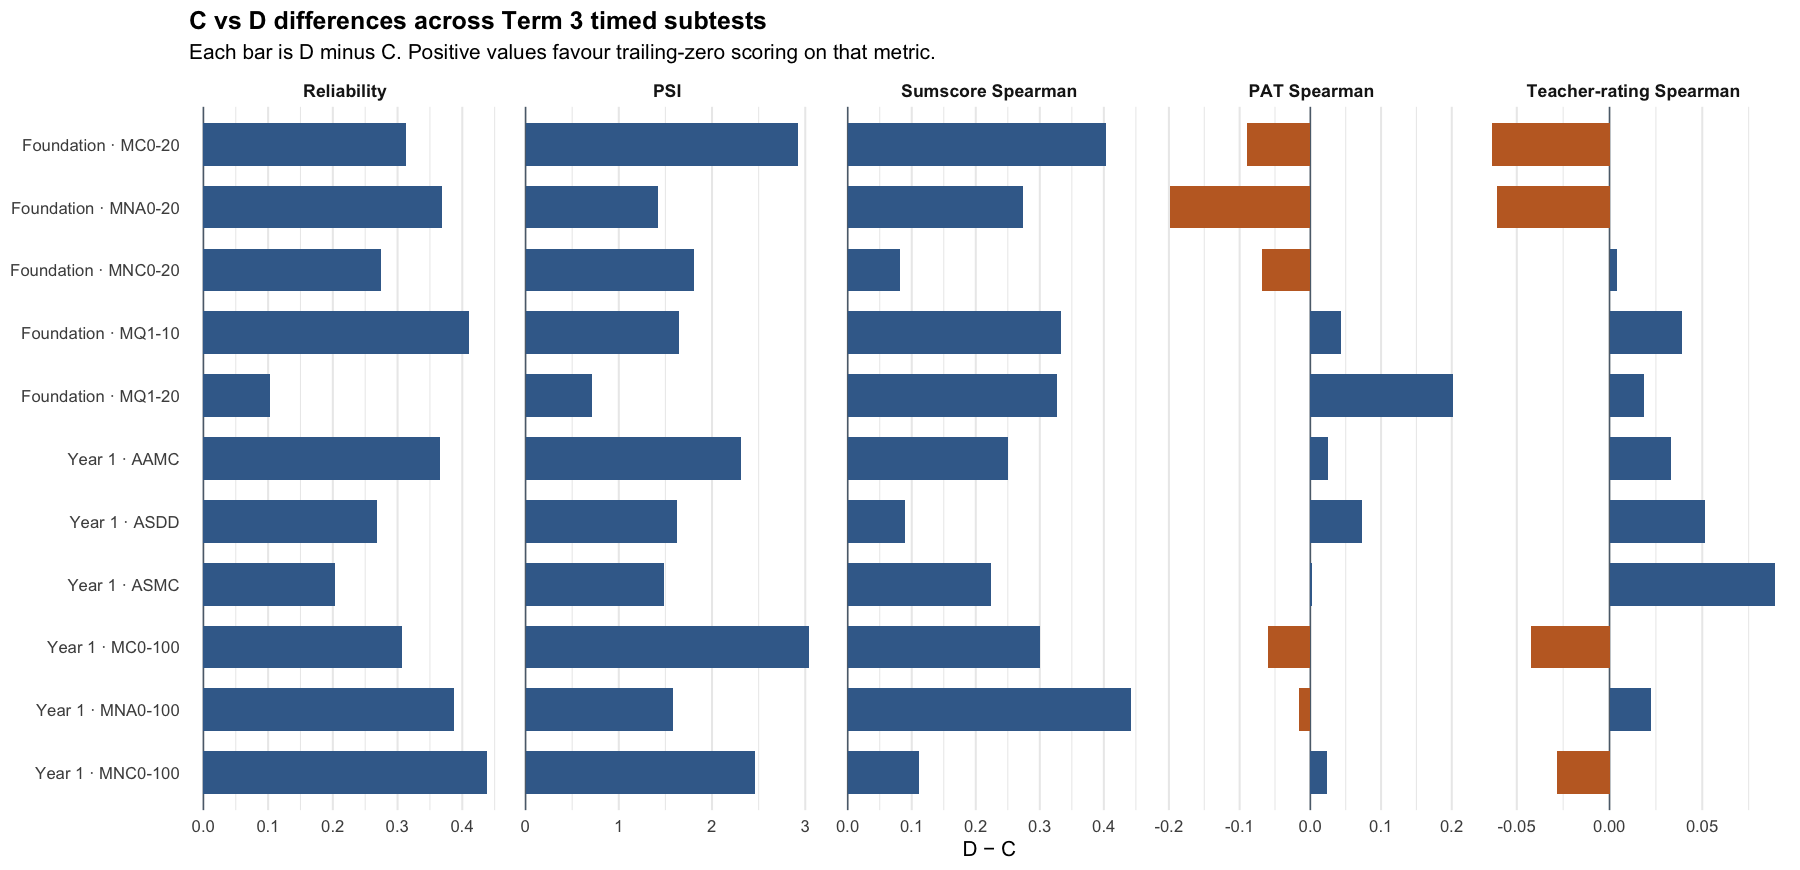
The tornado plot summarises the reached-only C score against the trailing-zero D score. Each bar is D minus C for one year-level × subtest: positive values favour D on that metric. Reliability and PSI are construct-specific model diagnostics; the Spearman columns are directly comparable correlations.
Results by year level × subtest
Choose a year level and subtest below. Each tab keeps the scoring-policy evidence within one year-level and subtest context.
Foundation
Year 1
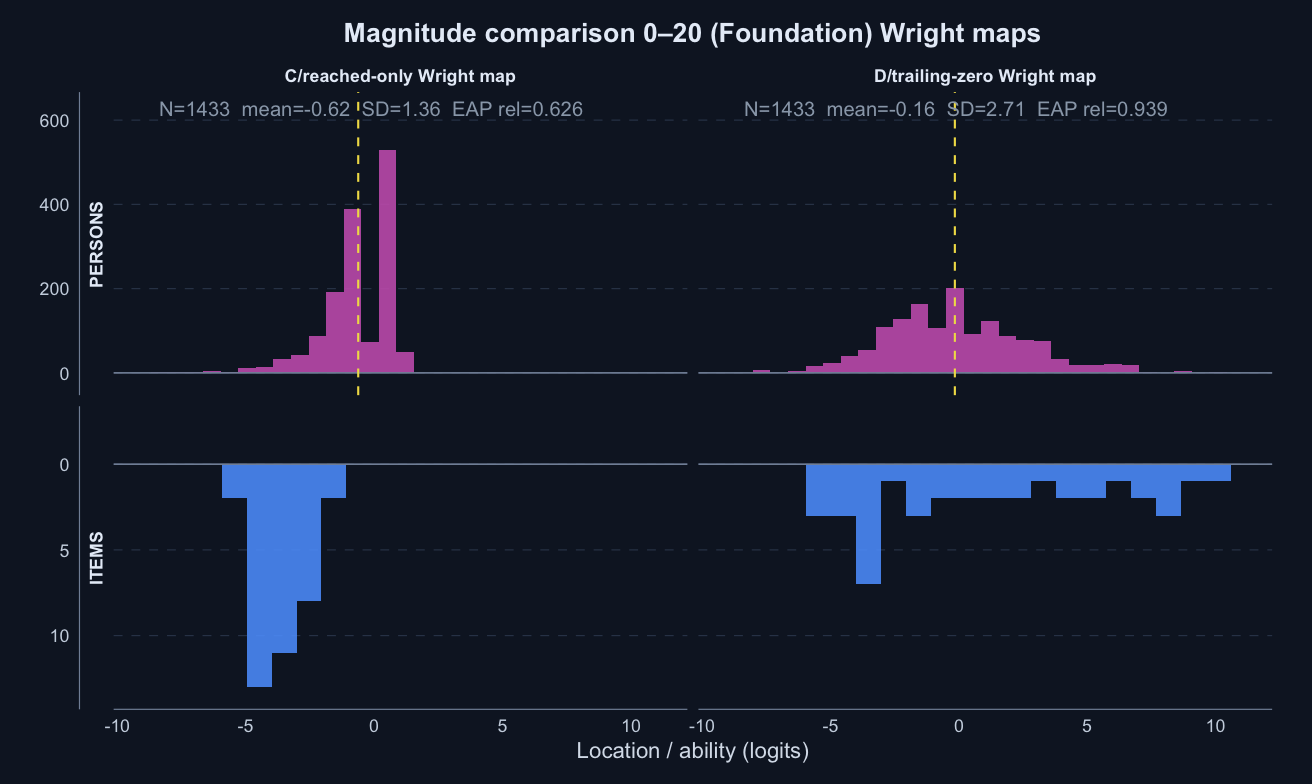
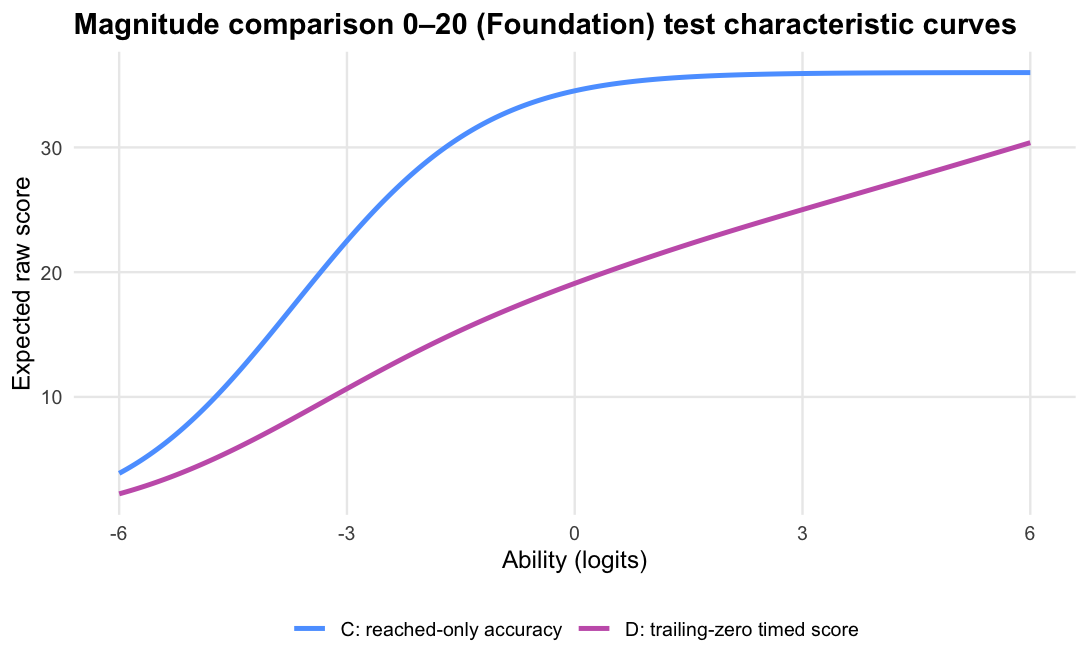
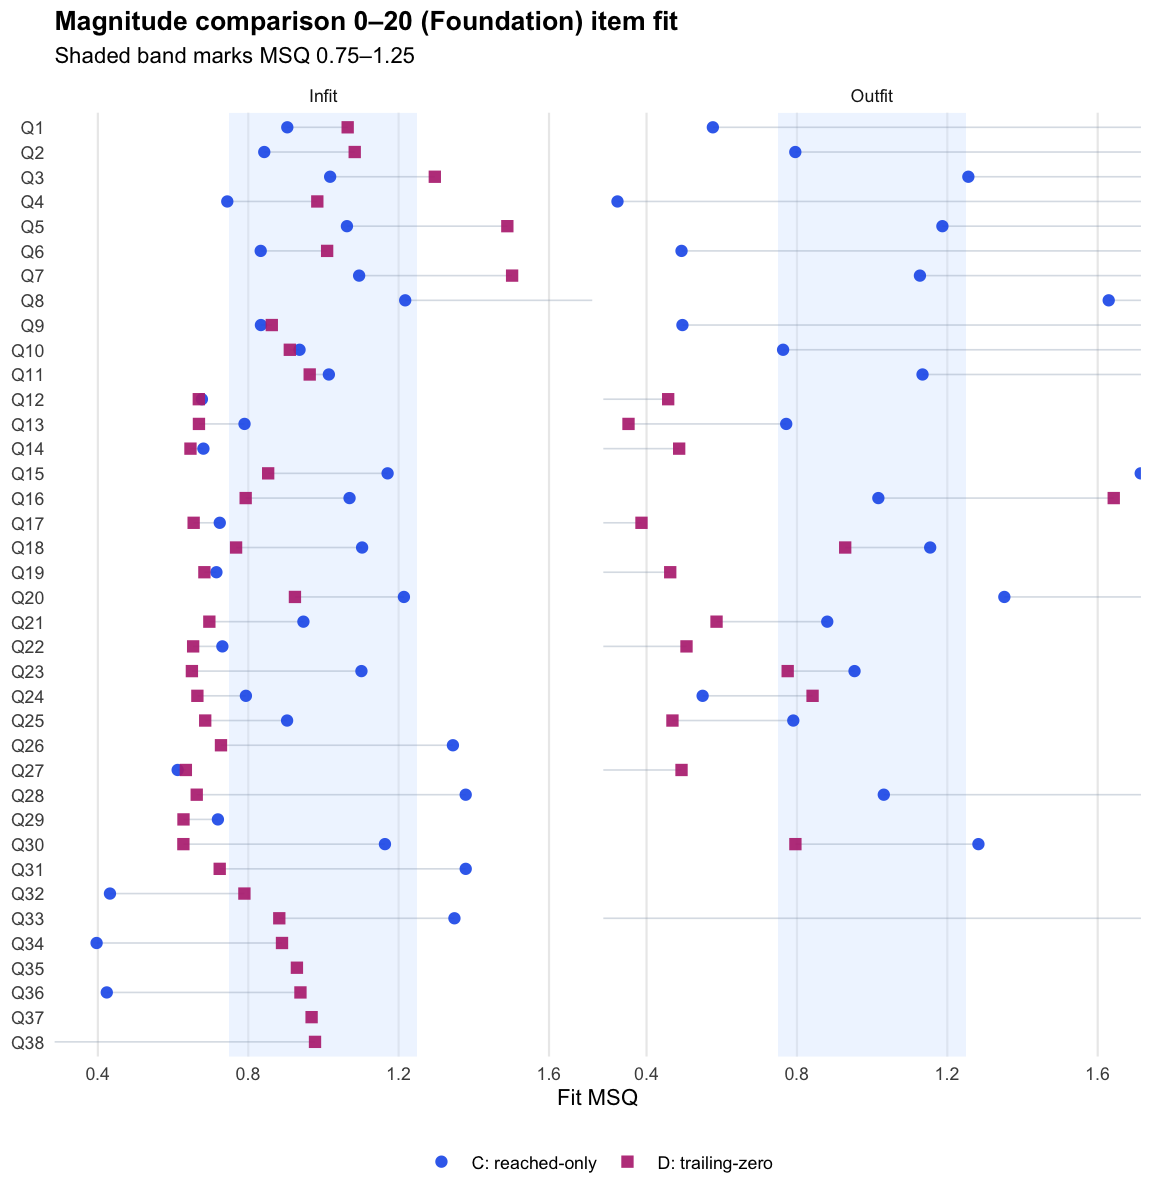
Magnitude comparison 0–20 · Term 3 · MC0-20_2025
Logit accuracy trailing-zero (D) and Raw sum score (A) order students almost identically; the joint model agrees and adds no material external-alignment gain.
Means and SDs are on each score’s own scale; comparisons across rows should use the rank-agreement and alignment columns.
Model diagnostics
Score
Reliability
Reliability type
Mean SE / posterior SD
Median posterior SD
PSI / posterior PSI proxy
Items used in fit
Fit note
Divergent transitions
Max R-hat
Min bulk ESS
Min tail ESS
Reach–accuracy trait correlation
Logit accuracy on reached (C)
0.626
item-response
1.151
1.185
36
tam_ok
Logit accuracy trailing-zero (D)
0.939
item-response
0.659
4.105
38
tam_ok
Joint accuracy-reach expected credit (F)
0.904
posterior proxy
0.024
0.023
3.085
60
0
1.011
578
1099
0.176
The F reliability figure is a posterior-variance proxy, not the same metric as TAM reliability.
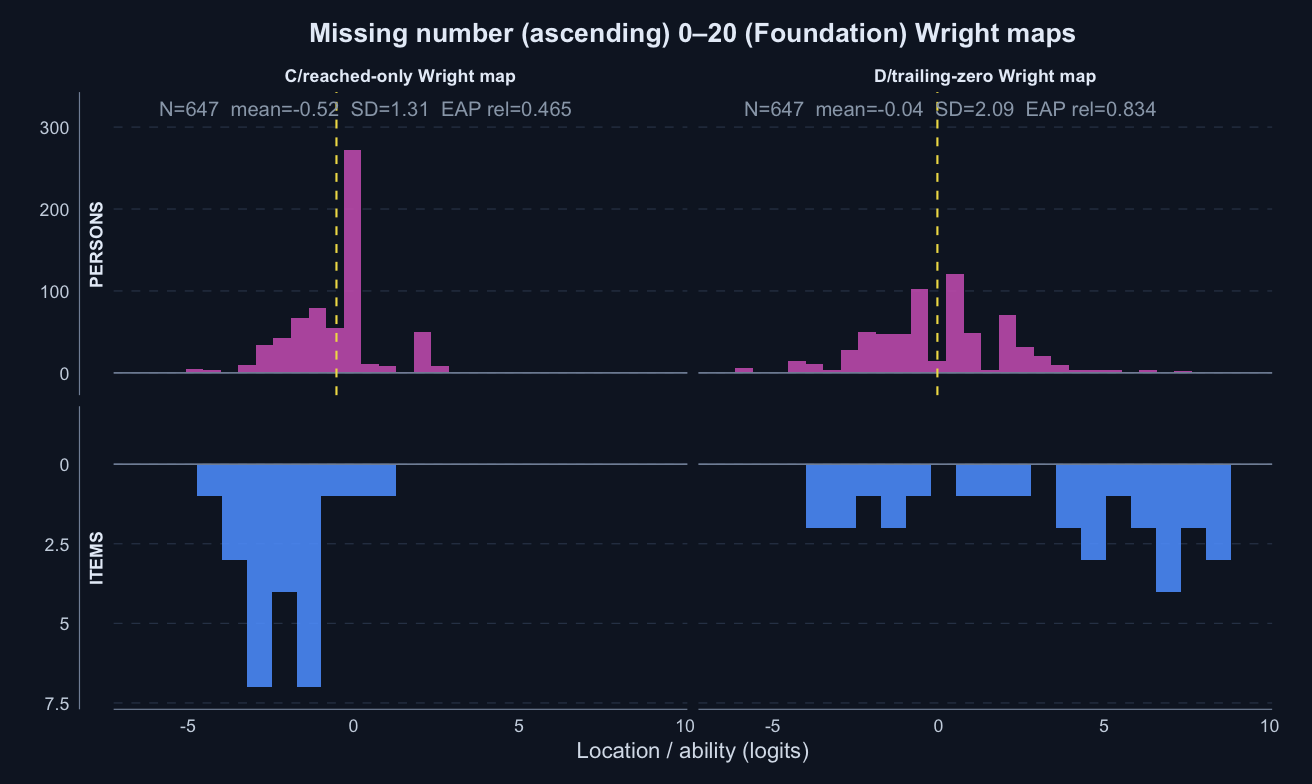
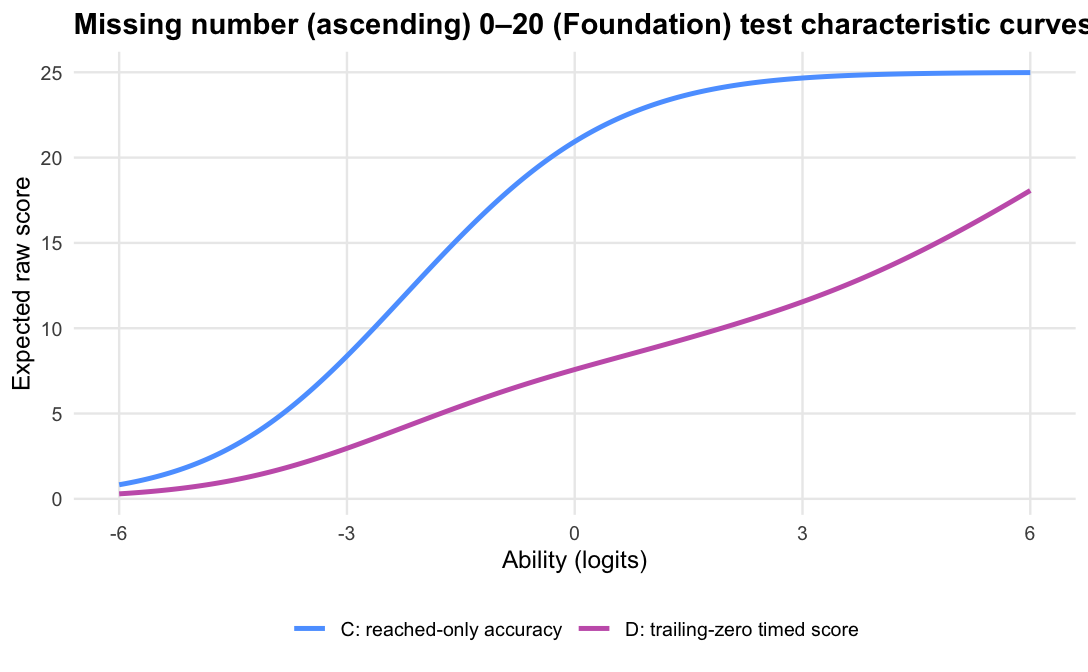
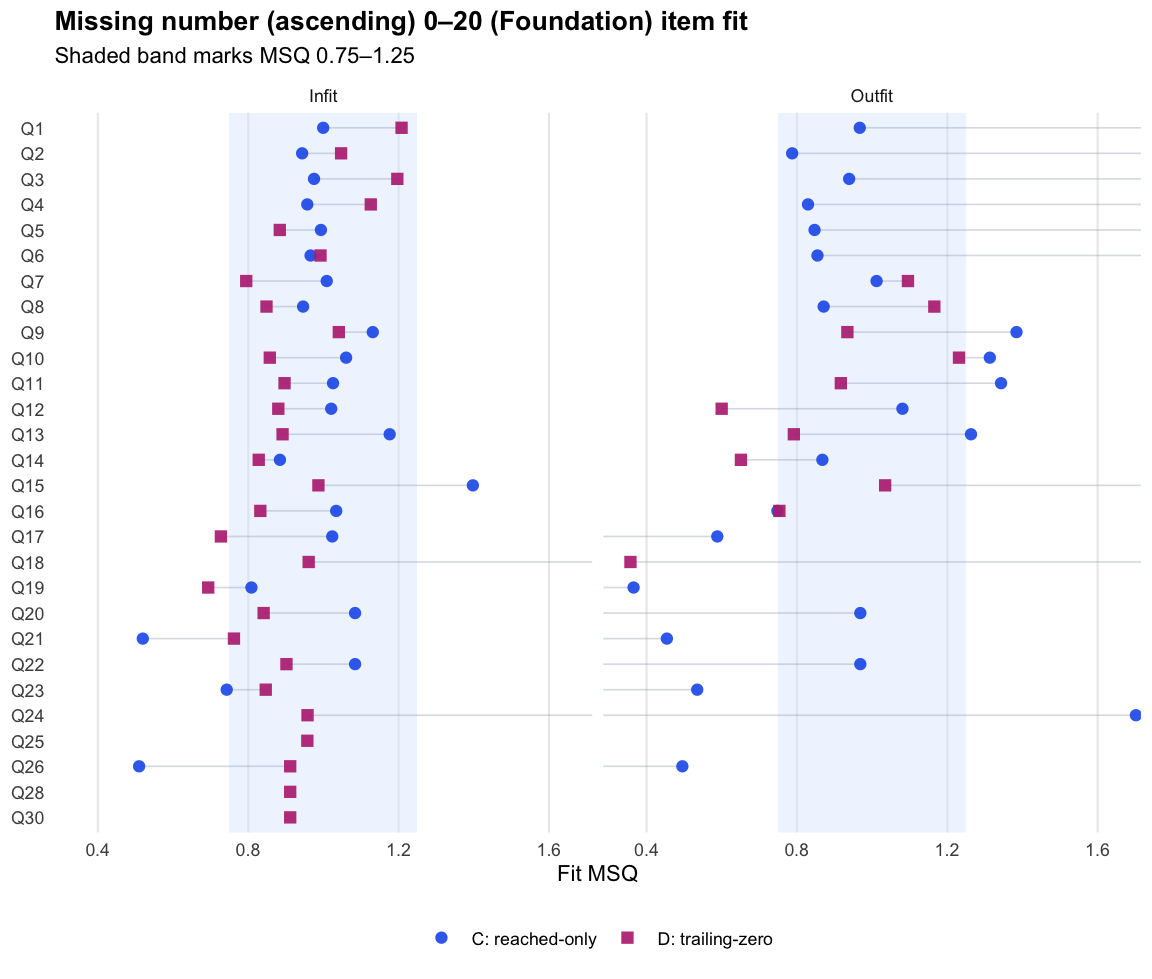
Missing number (ascending) 0–20 · Term 3 · MNA0-20_2025
Logit accuracy trailing-zero (D) and Raw sum score (A) order students very similarly; the joint model shows some divergence; see the key contrasts and diagnostics below.
Means and SDs are on each score’s own scale; comparisons across rows should use the rank-agreement and alignment columns.
Model diagnostics
Score
Reliability
Reliability type
Mean SE / posterior SD
Median posterior SD
PSI / posterior PSI proxy
Items used in fit
Fit note
Divergent transitions
Max R-hat
Min bulk ESS
Min tail ESS
Reach–accuracy trait correlation
Logit accuracy on reached (C)
0.465
item-response
1.301
1.009
25
tam_ok
Logit accuracy trailing-zero (D)
0.834
item-response
0.860
2.434
28
tam_ok
Joint accuracy-reach expected credit (F)
0.750
posterior proxy
0.032
0.031
1.742
30
0
1.009
667
943
0.072
The F reliability figure is a posterior-variance proxy, not the same metric as TAM reliability.
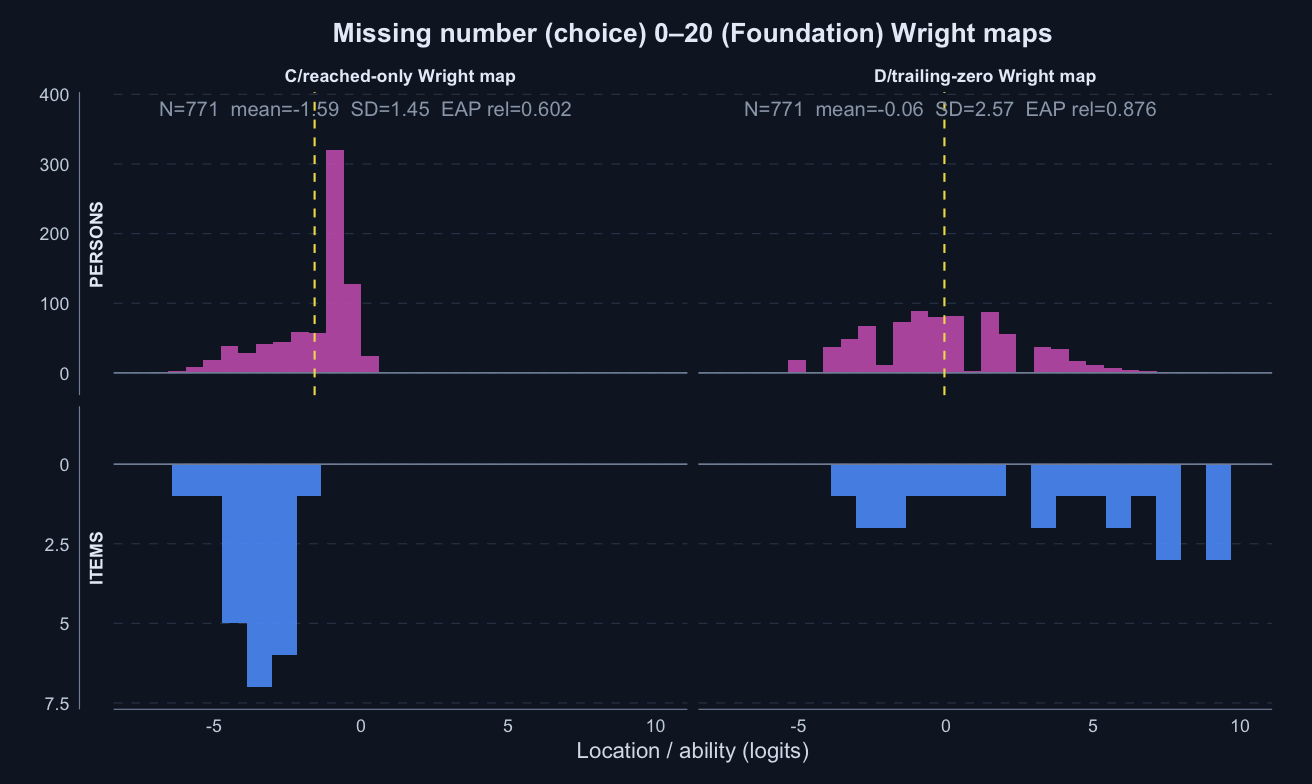
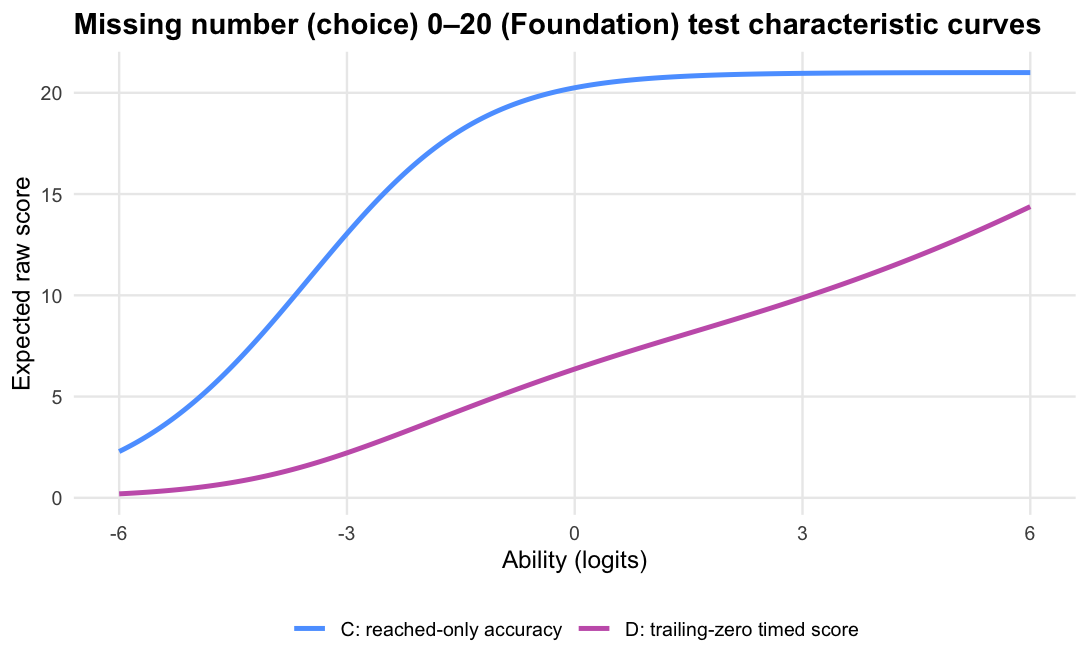
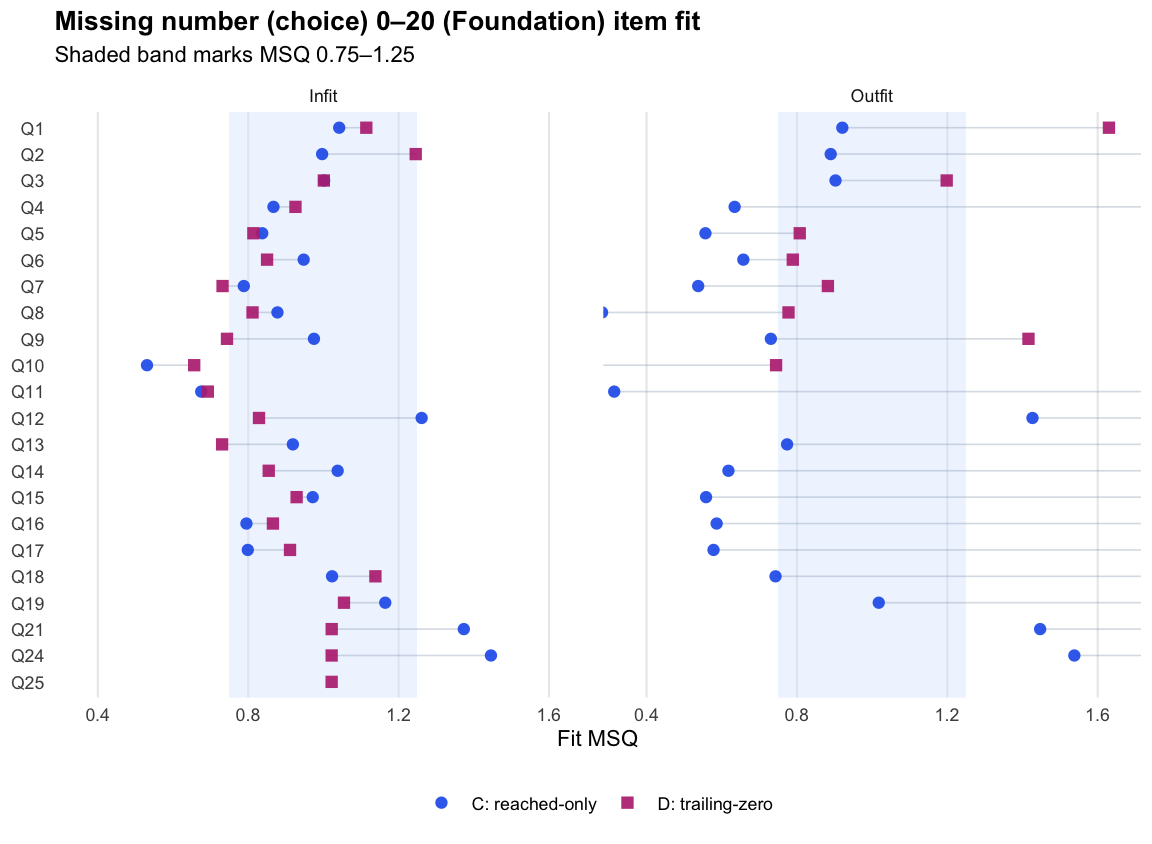
Missing number (choice) 0–20 · Term 3 · MNC0-20_2025
Logit accuracy trailing-zero (D) and Raw sum score (A) order students very similarly; the joint model agrees and adds no material external-alignment gain.
Means and SDs are on each score’s own scale; comparisons across rows should use the rank-agreement and alignment columns.
Model diagnostics
Score
Reliability
Reliability type
Mean SE / posterior SD
Median posterior SD
PSI / posterior PSI proxy
Items used in fit
Fit note
Divergent transitions
Max R-hat
Min bulk ESS
Min tail ESS
Reach–accuracy trait correlation
Logit accuracy on reached (C)
0.602
item-response
1.437
1.007
21
tam_ok
Logit accuracy trailing-zero (D)
0.876
item-response
0.916
2.809
22
tam_ok
Joint accuracy-reach expected credit (F)
0.737
posterior proxy
0.032
0.032
1.693
30
0
1.011
766
1286
-0.118
The F reliability figure is a posterior-variance proxy, not the same metric as TAM reliability.
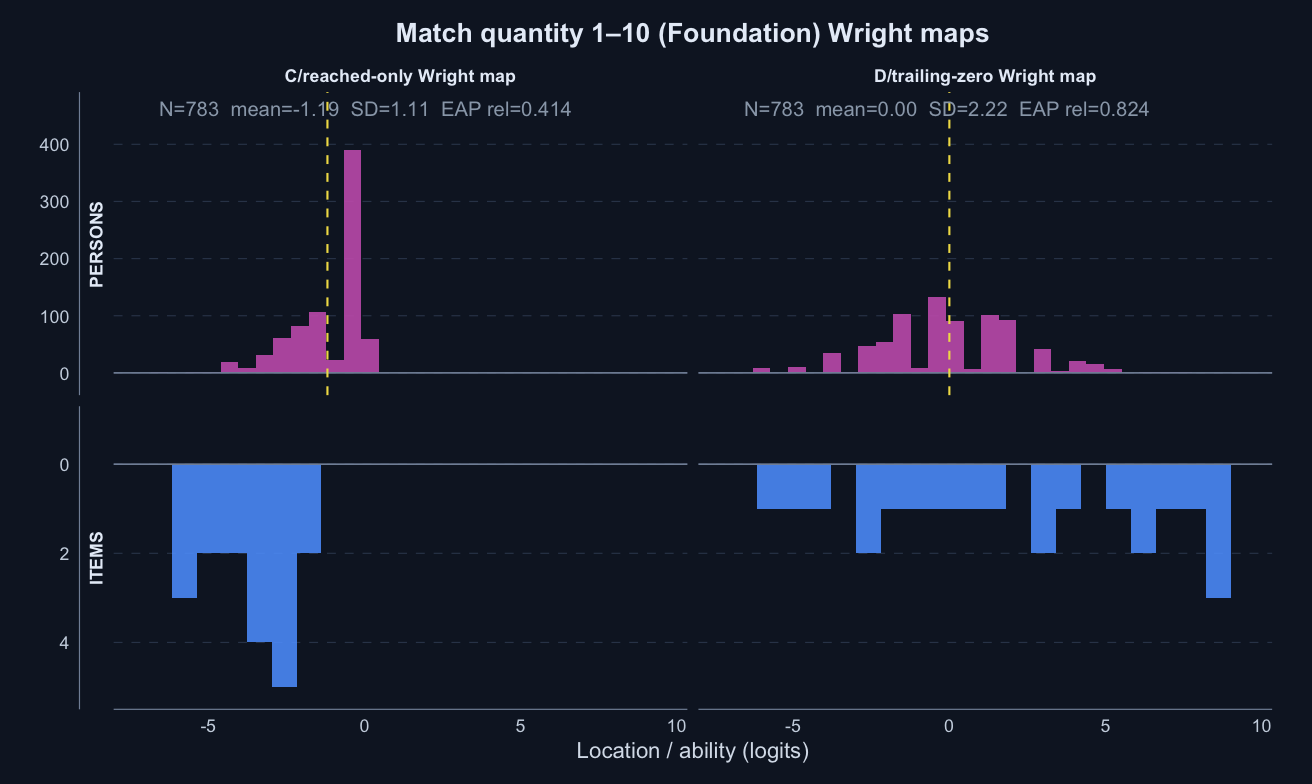
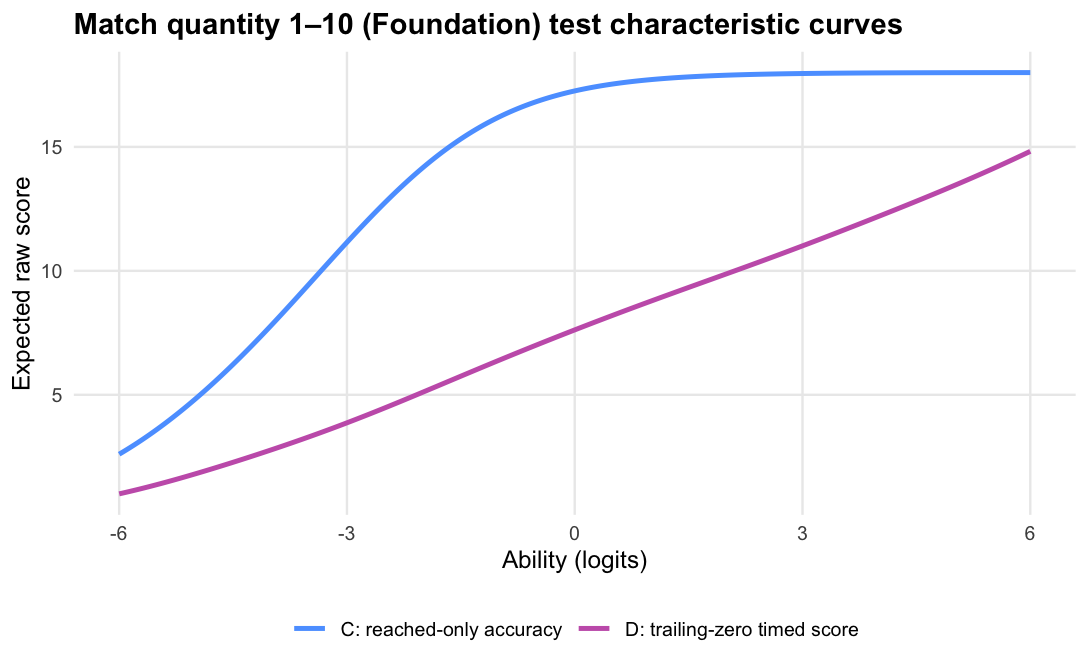
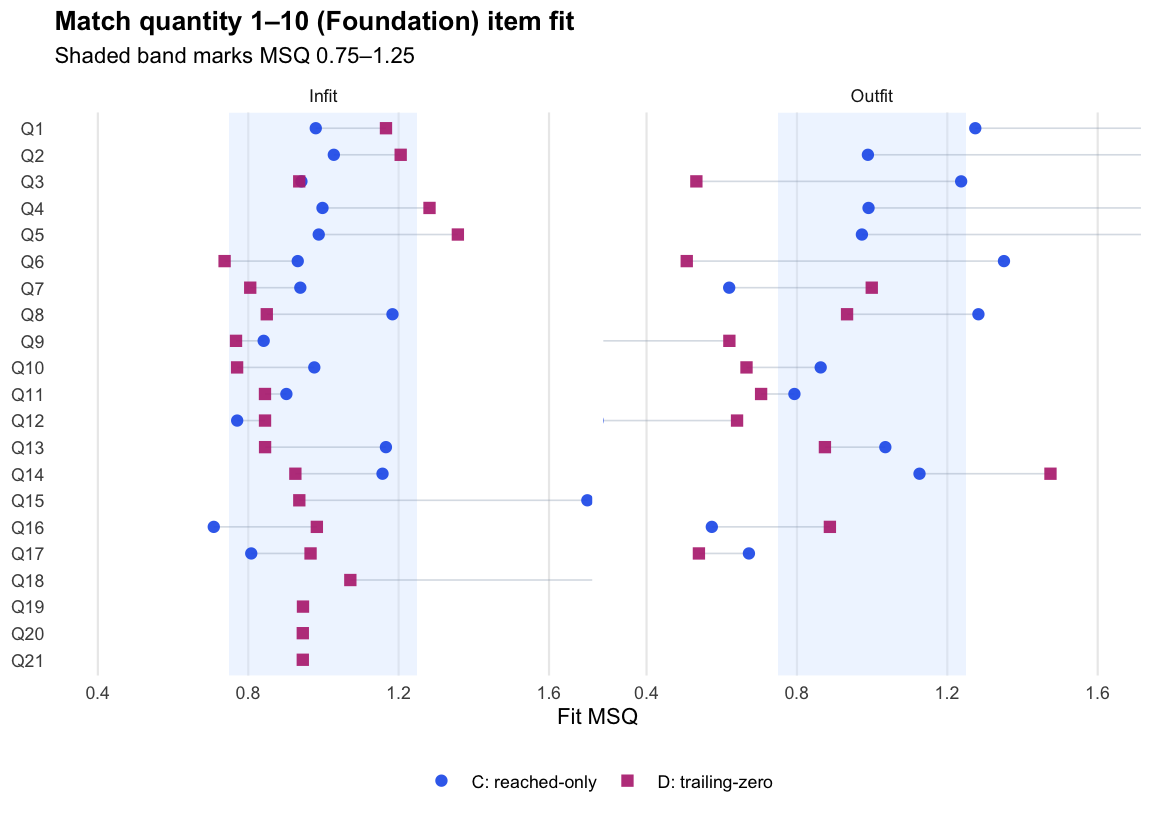
Match quantity 1–10 · Term 3 · MQ1-10_2025
Logit accuracy trailing-zero (D) and Raw sum score (A) order students almost identically; the joint model agrees and adds no material external-alignment gain.
Means and SDs are on each score’s own scale; comparisons across rows should use the rank-agreement and alignment columns.
Model diagnostics
Score
Reliability
Reliability type
Mean SE / posterior SD
Median posterior SD
PSI / posterior PSI proxy
Items used in fit
Fit note
Divergent transitions
Max R-hat
Min bulk ESS
Min tail ESS
Reach–accuracy trait correlation
Logit accuracy on reached (C)
0.414
item-response
1.490
0.743
18
tam_ok
Logit accuracy trailing-zero (D)
0.824
item-response
0.929
2.386
21
tam_ok
Joint accuracy-reach expected credit (F)
0.675
posterior proxy
0.027
0.027
1.449
30
0
1.012
634
1397
-0.234
The F reliability figure is a posterior-variance proxy, not the same metric as TAM reliability.
Match quantity 1–20 · Term 3 · MQ1-20_2025
Logit accuracy trailing-zero (D) and Raw sum score (A) order students almost identically; the joint model shows some divergence; see the key contrasts and diagnostics below.
Logit accuracy trailing-zero (D) and Raw sum score (A) order students very similarly; the joint model agrees and adds no material external-alignment gain.
Means and SDs are on each score’s own scale; comparisons across rows should use the rank-agreement and alignment columns.
Model diagnostics
Score
Reliability
Reliability type
Mean SE / posterior SD
Median posterior SD
PSI / posterior PSI proxy
Items used in fit
Fit note
Divergent transitions
Max R-hat
Min bulk ESS
Min tail ESS
Reach–accuracy trait correlation
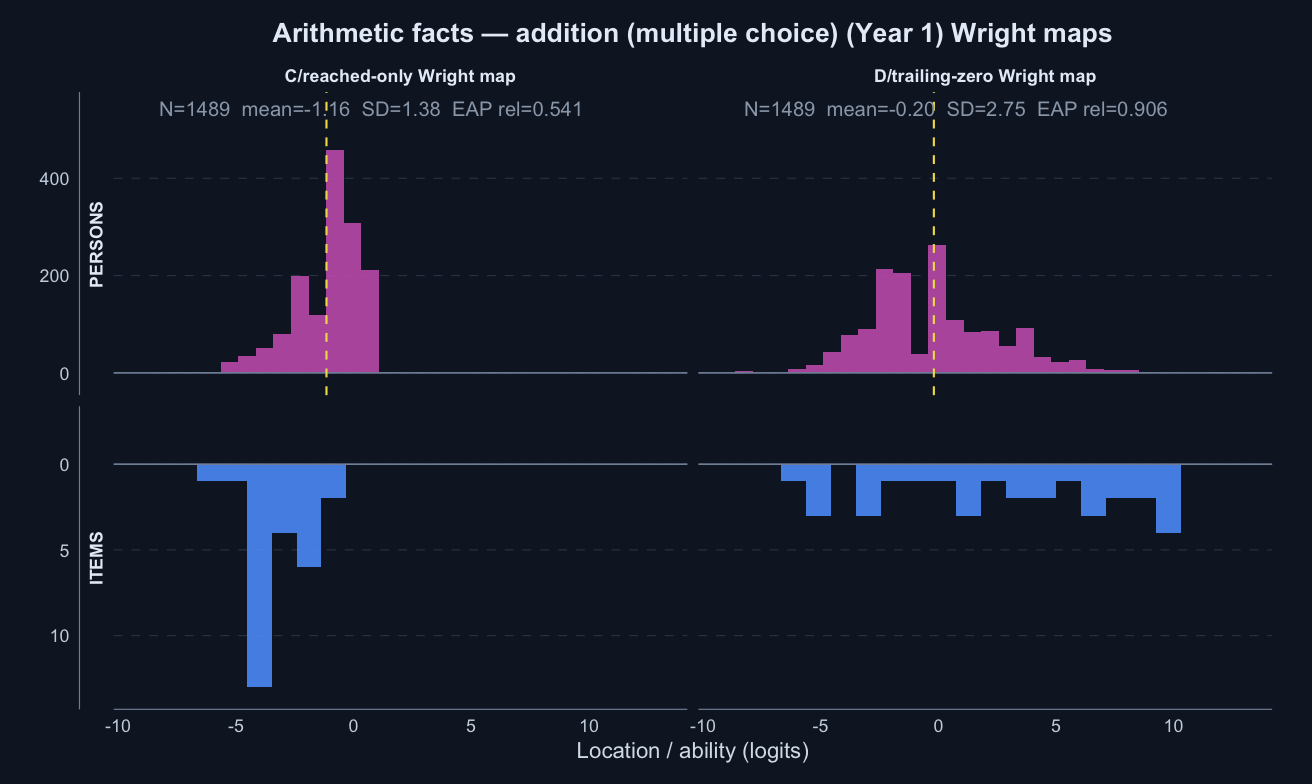
Logit accuracy on reached (C)
0.541
item-response
1.384
0.995
27
tam_ok
Logit accuracy trailing-zero (D)
0.906
item-response
0.834
3.303
30
tam_ok
Joint accuracy-reach expected credit (F)
0.827
posterior proxy
0.028
0.027
2.212
40
0
1.010
457
827
0.062
The F reliability figure is a posterior-variance proxy, not the same metric as TAM reliability.
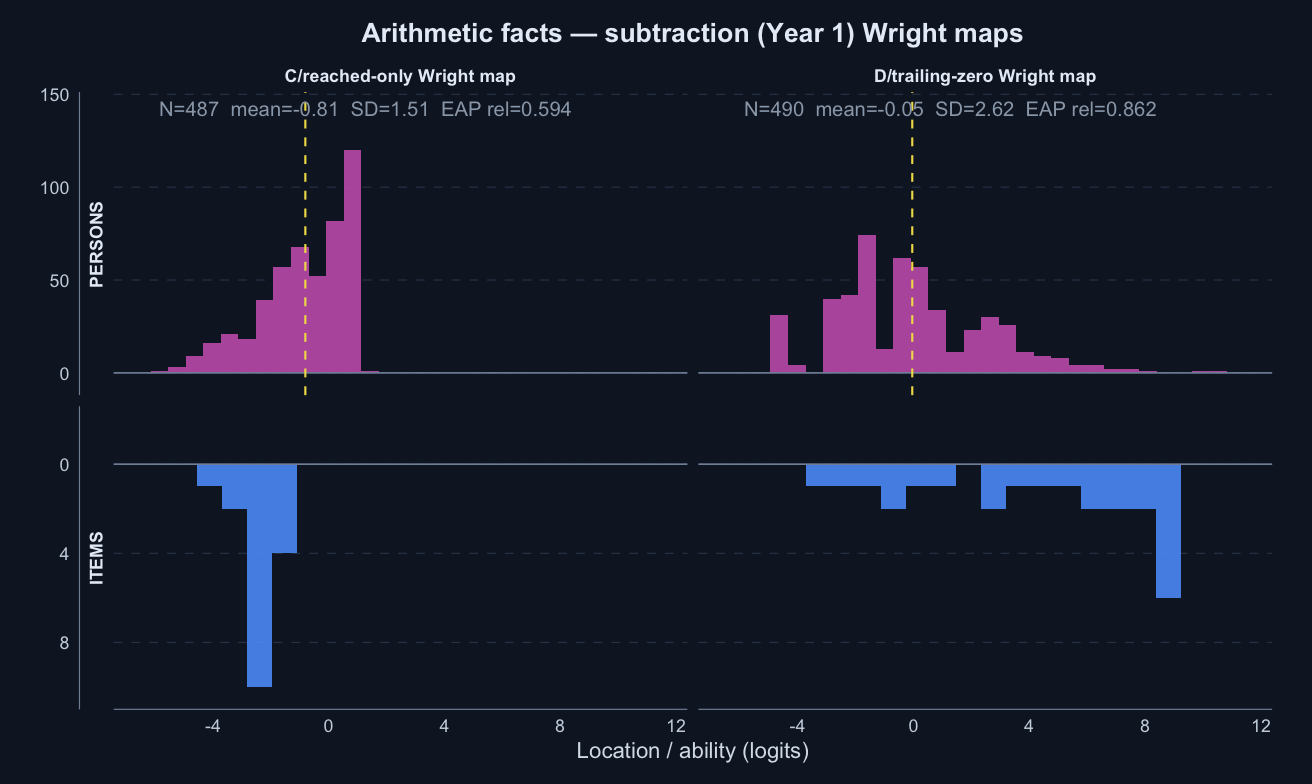
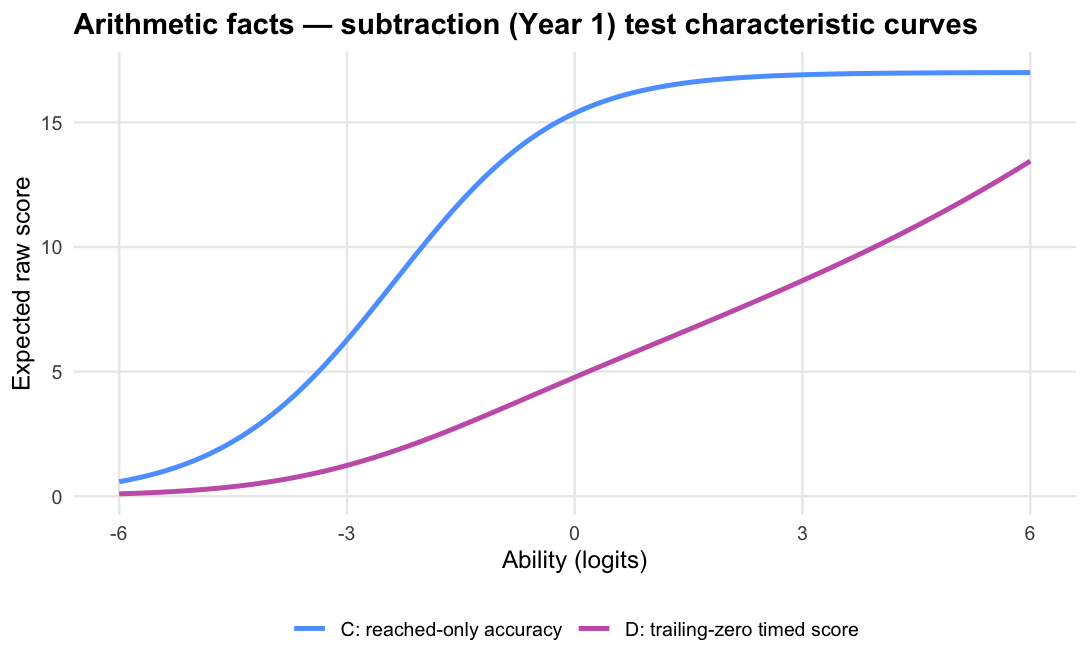
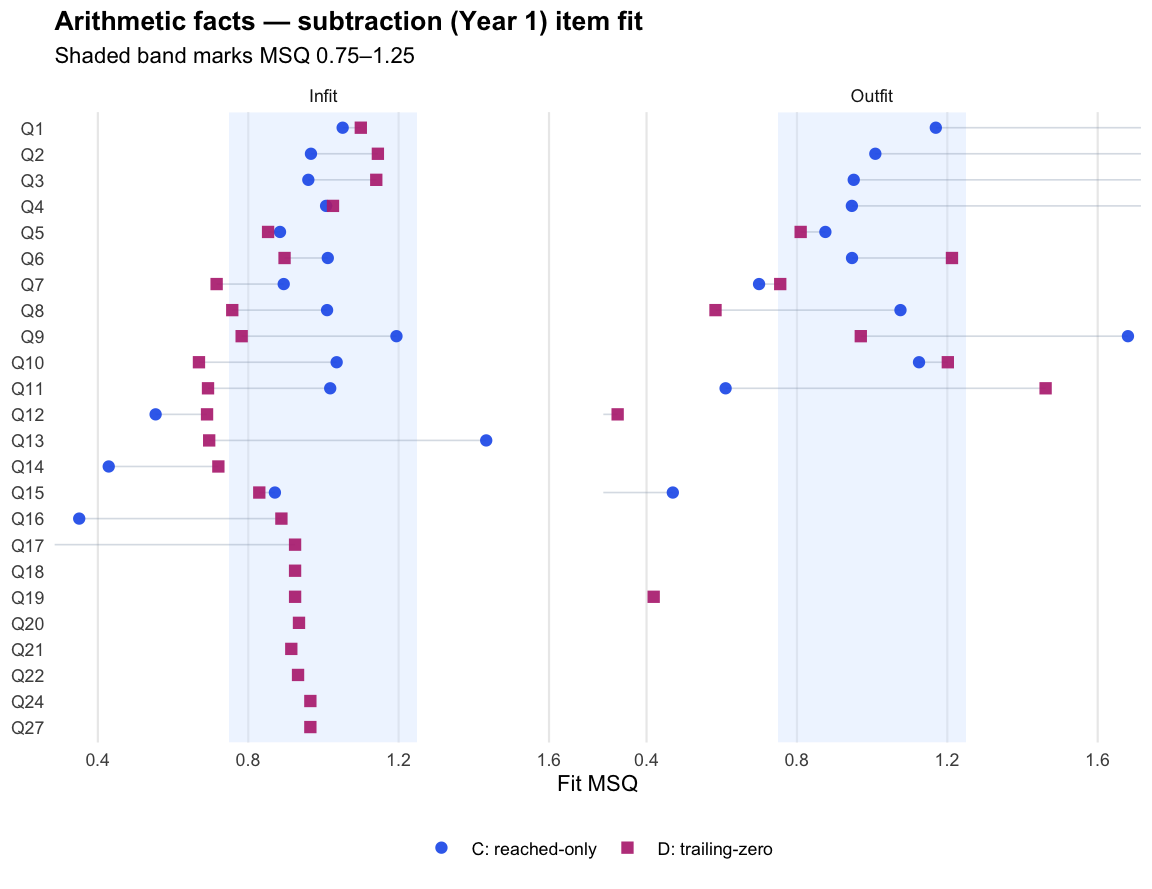
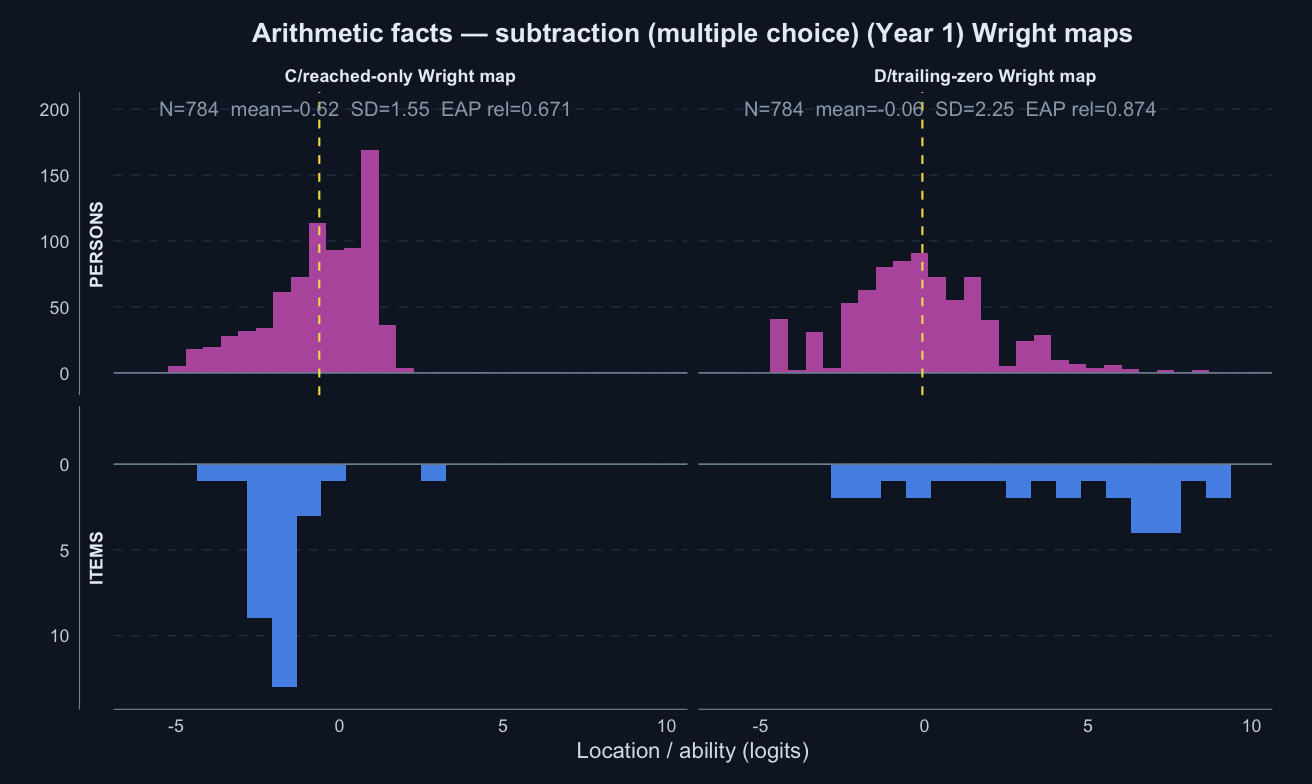
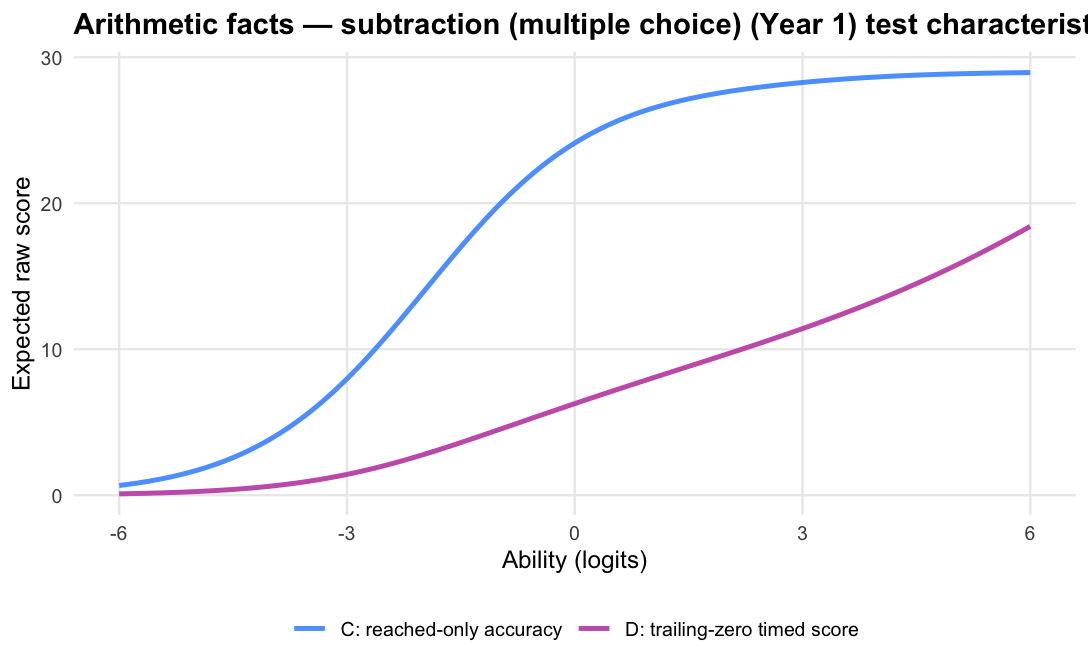
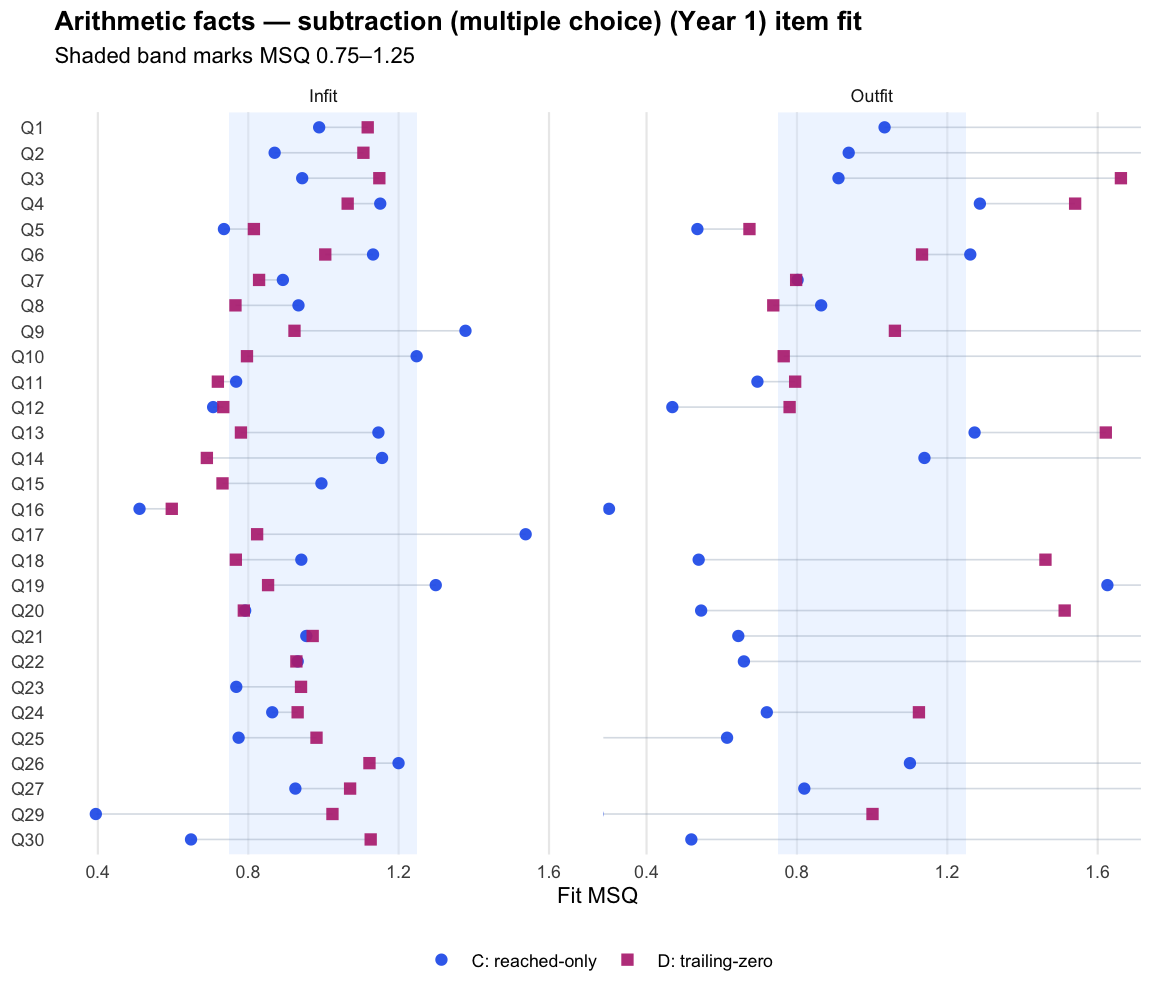
Arithmetic facts — subtraction · Term 3 · ASDD_2025
Logit accuracy trailing-zero (D) and Raw sum score (A) show some ordering differences worth noting; the joint model shows some divergence; see the key contrasts and diagnostics below.
Logit accuracy trailing-zero (D) and Raw sum score (A) order students very similarly; the joint model agrees and adds no material external-alignment gain.
Means and SDs are on each score’s own scale; comparisons across rows should use the rank-agreement and alignment columns.
Model diagnostics
Score
Reliability
Reliability type
Mean SE / posterior SD
Median posterior SD
PSI / posterior PSI proxy
Items used in fit
Fit note
Divergent transitions
Max R-hat
Min bulk ESS
Min tail ESS
Reach–accuracy trait correlation
Logit accuracy on reached (C)
0.671
item-response
1.239
1.248
29
tam_ok
Logit accuracy trailing-zero (D)
0.874
item-response
0.826
2.729
29
tam_ok
Joint accuracy-reach expected credit (F)
0.797
posterior proxy
0.038
0.037
2.008
30
0
1.011
442
783
0.030
The F reliability figure is a posterior-variance proxy, not the same metric as TAM reliability.
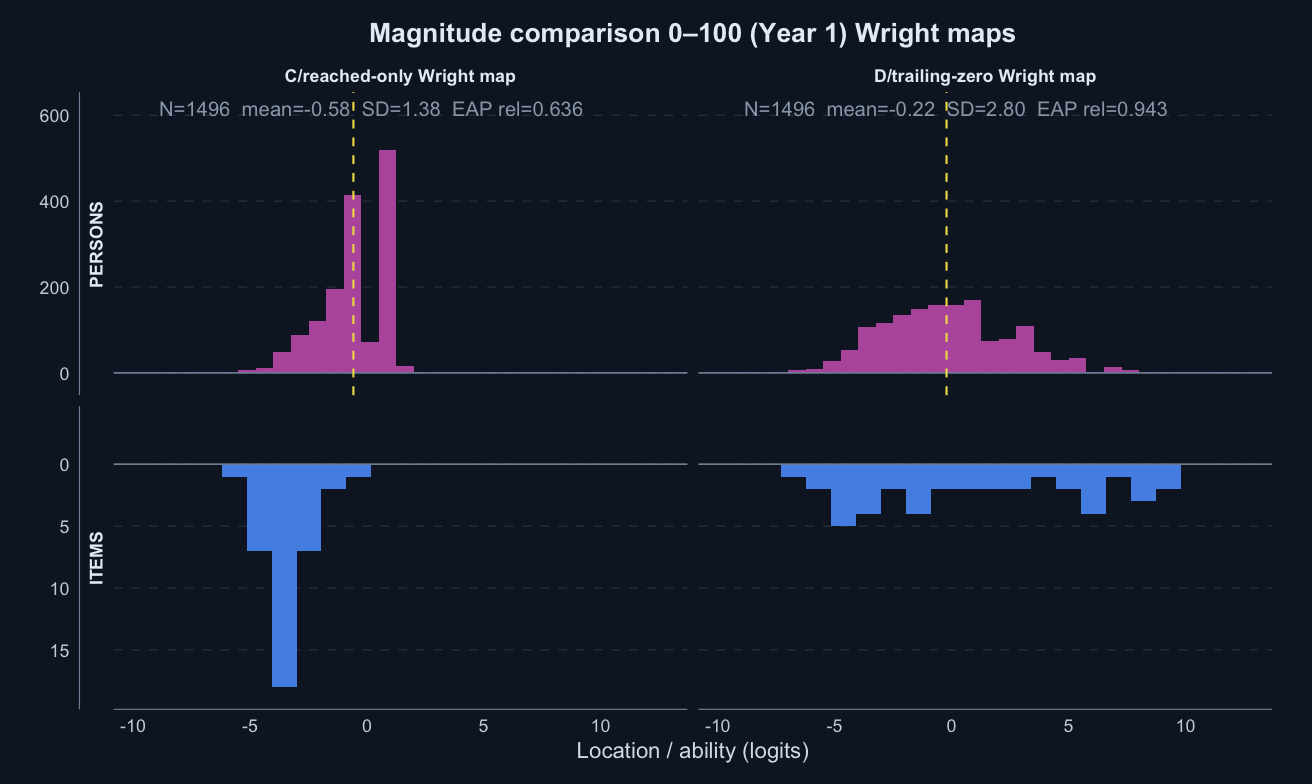
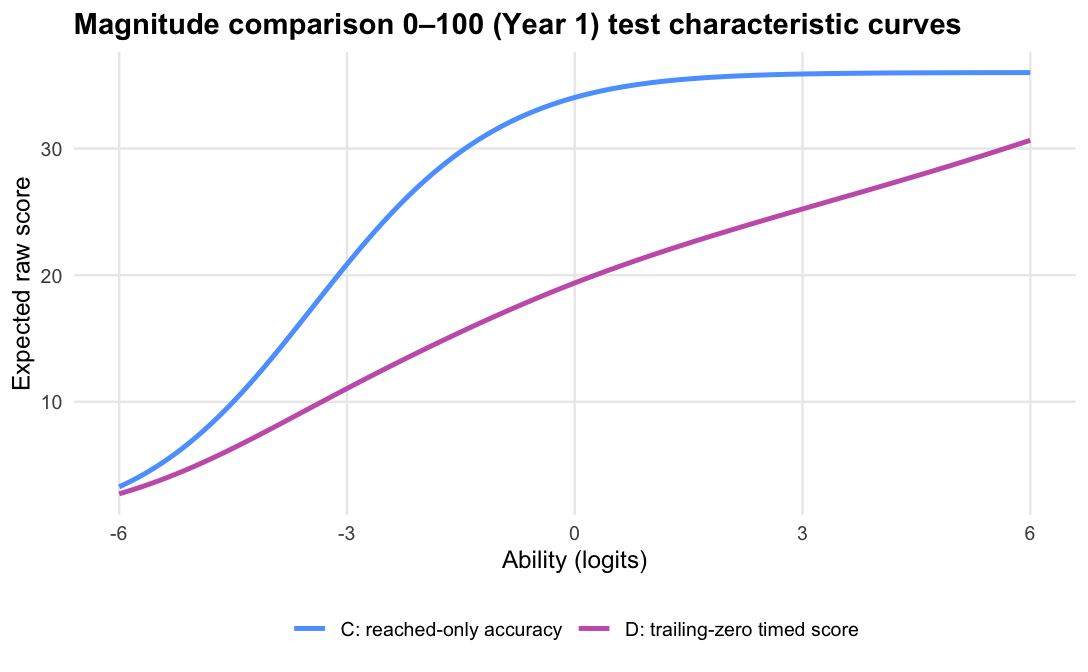
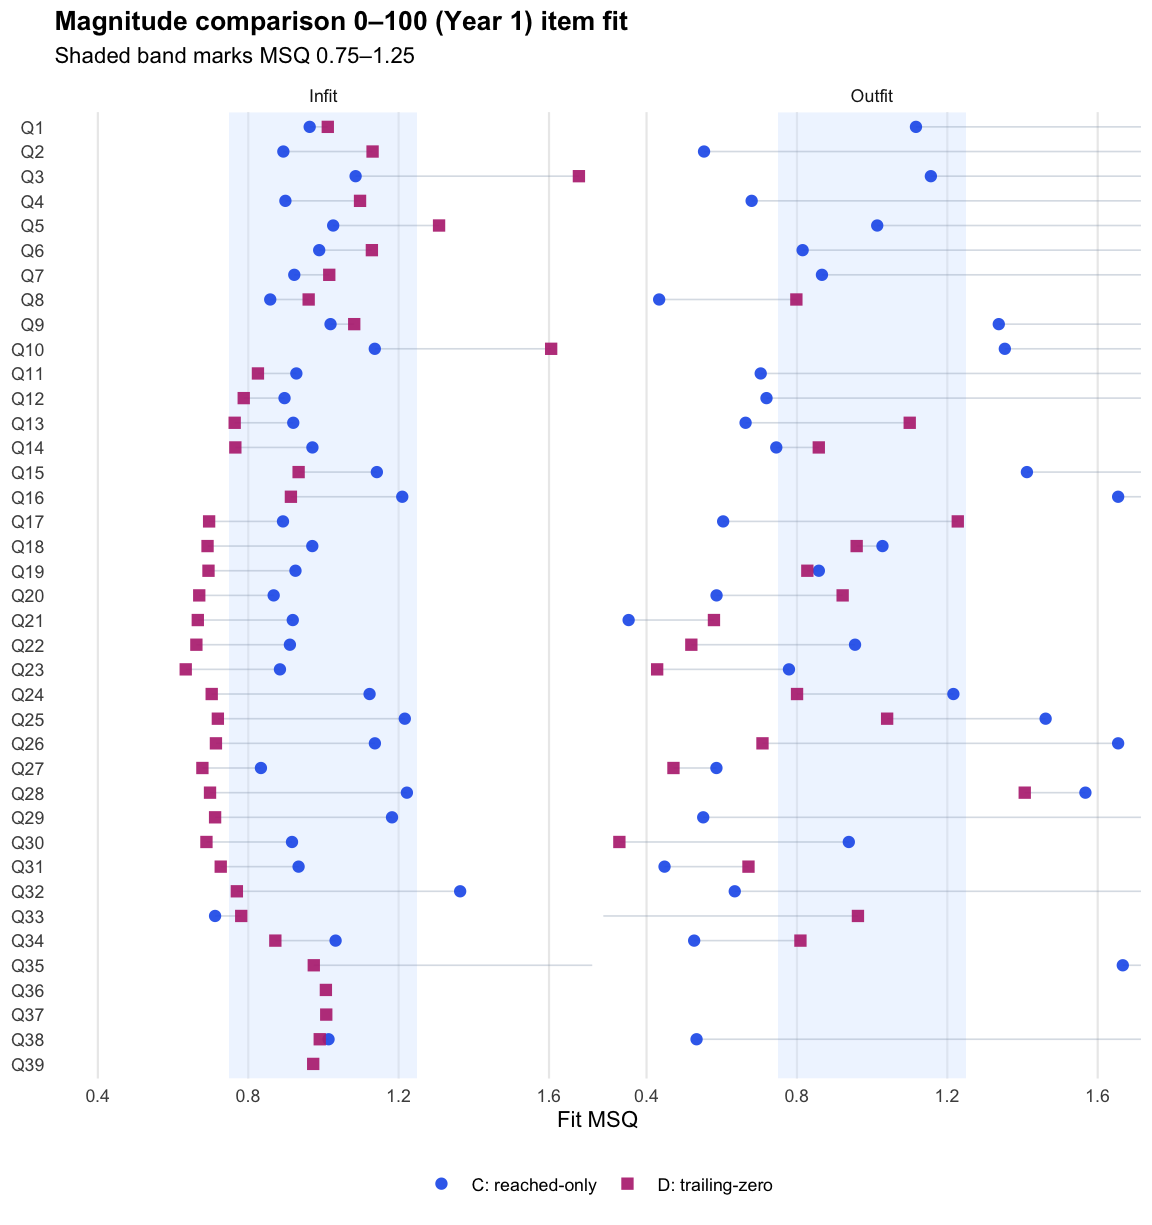
Magnitude comparison 0–100 · Term 3 · MC0-100_2025
Logit accuracy trailing-zero (D) and Raw sum score (A) order students almost identically; the joint model agrees and adds no material external-alignment gain.
Means and SDs are on each score’s own scale; comparisons across rows should use the rank-agreement and alignment columns.
Model diagnostics
Score
Reliability
Reliability type
Mean SE / posterior SD
Median posterior SD
PSI / posterior PSI proxy
Items used in fit
Fit note
Divergent transitions
Max R-hat
Min bulk ESS
Min tail ESS
Reach–accuracy trait correlation
Logit accuracy on reached (C)
0.636
item-response
1.136
1.217
36
tam_ok
Logit accuracy trailing-zero (D)
0.943
item-response
0.659
4.257
39
tam_ok
Joint accuracy-reach expected credit (F)
0.908
posterior proxy
0.025
0.024
3.158
60
0
1.011
584
1217
0.270
The F reliability figure is a posterior-variance proxy, not the same metric as TAM reliability.
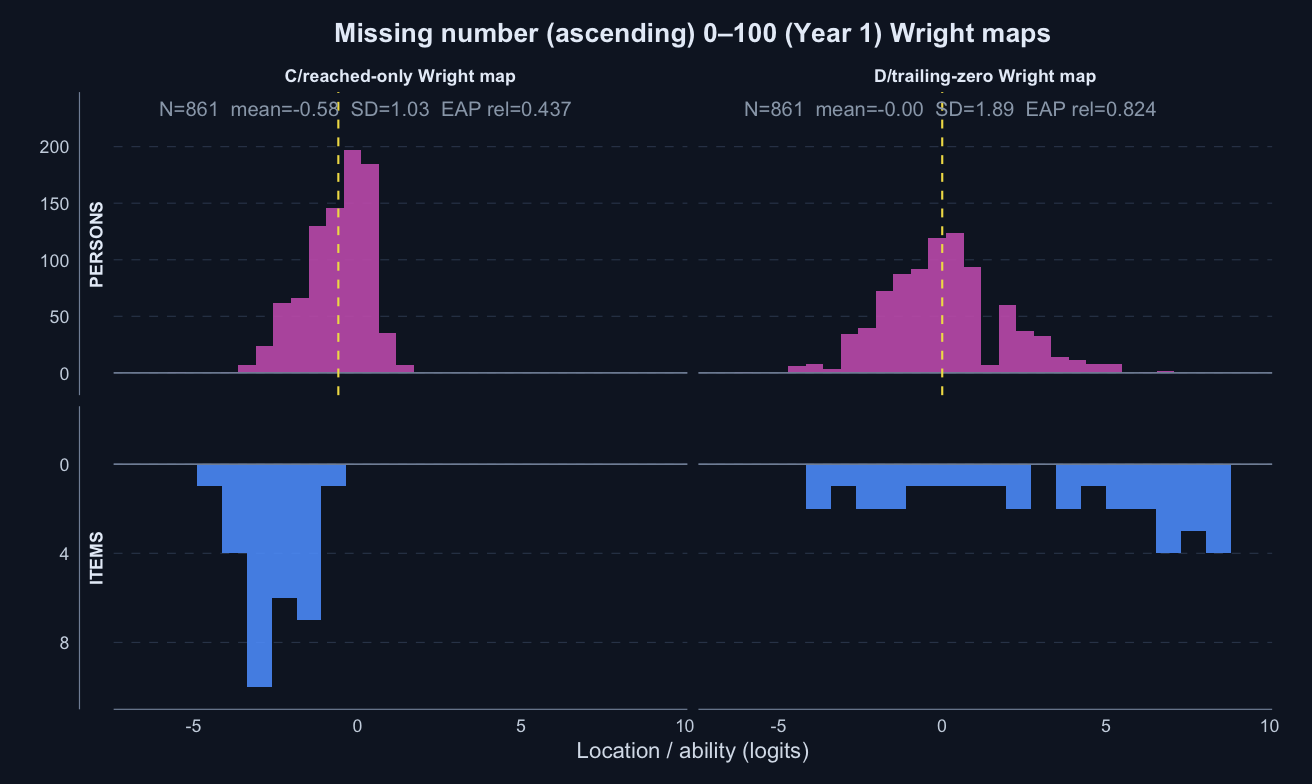
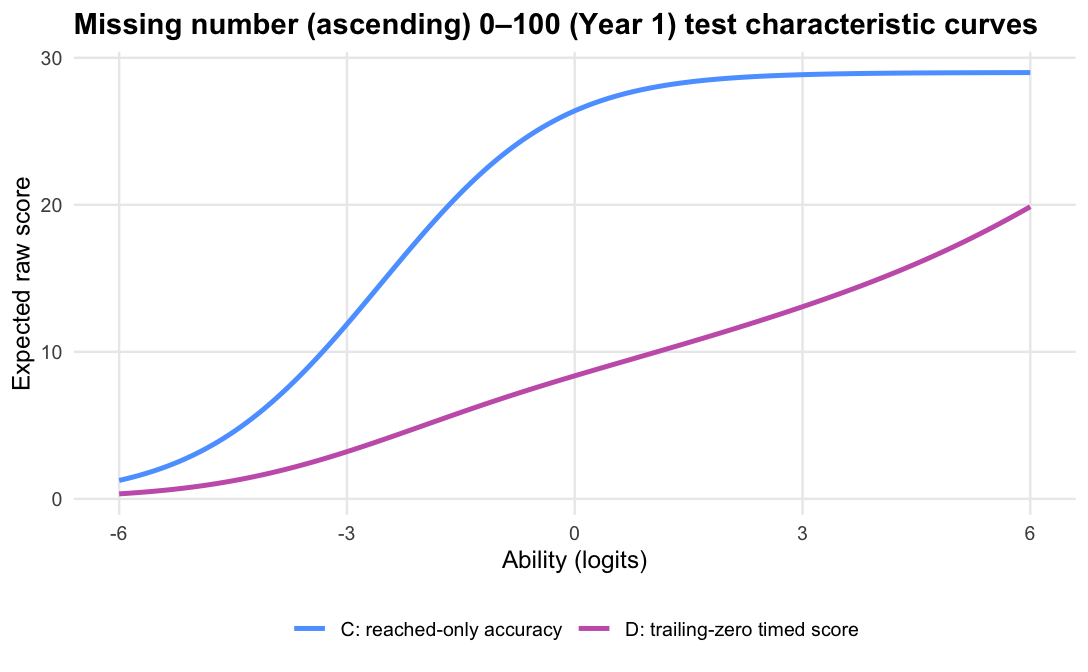
Missing number (ascending) 0–100 · Term 3 · MNA0-100_2025
Logit accuracy trailing-zero (D) and Raw sum score (A) order students very similarly; the joint model agrees and adds no material external-alignment gain.
Means and SDs are on each score’s own scale; comparisons across rows should use the rank-agreement and alignment columns.
Model diagnostics
Score
Reliability
Reliability type
Mean SE / posterior SD
Median posterior SD
PSI / posterior PSI proxy
Items used in fit
Fit note
Divergent transitions
Max R-hat
Min bulk ESS
Min tail ESS
Reach–accuracy trait correlation
Logit accuracy on reached (C)
0.437
item-response
1.279
0.806
29
tam_ok
Logit accuracy trailing-zero (D)
0.824
item-response
0.790
2.385
31
tam_ok
Joint accuracy-reach expected credit (F)
0.708
posterior proxy
0.024
0.023
1.578
40
0
1.013
1017
1333
-0.189
The F reliability figure is a posterior-variance proxy, not the same metric as TAM reliability.
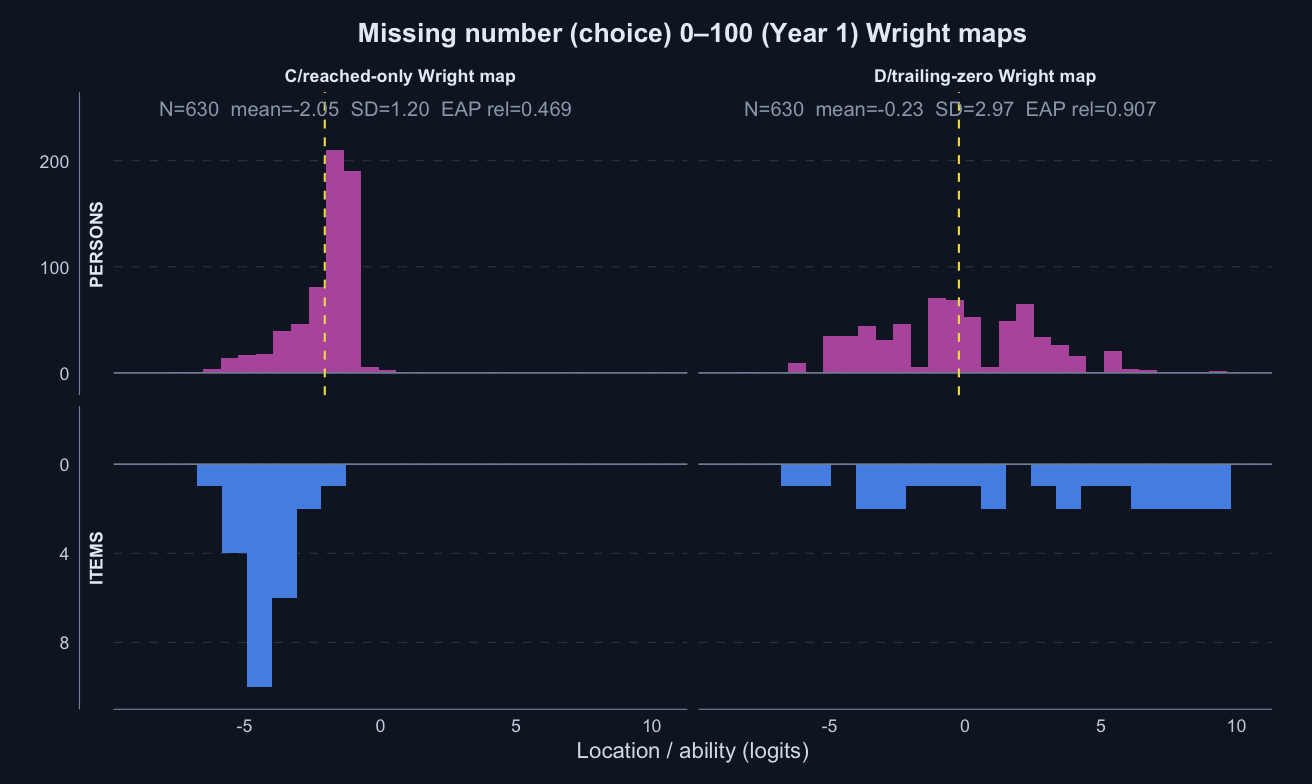
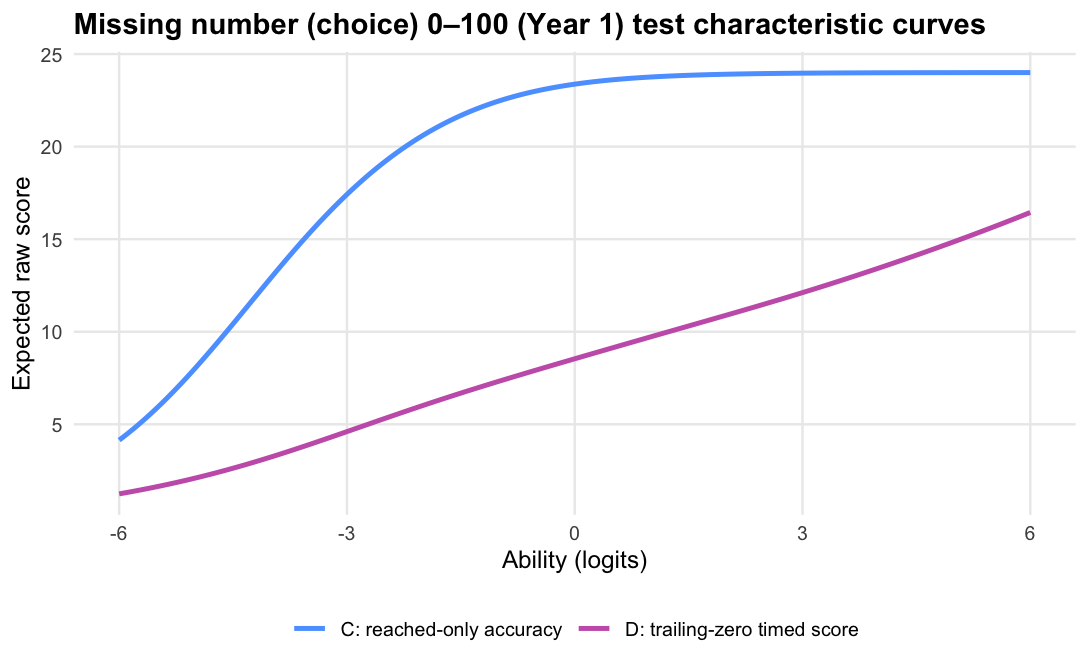
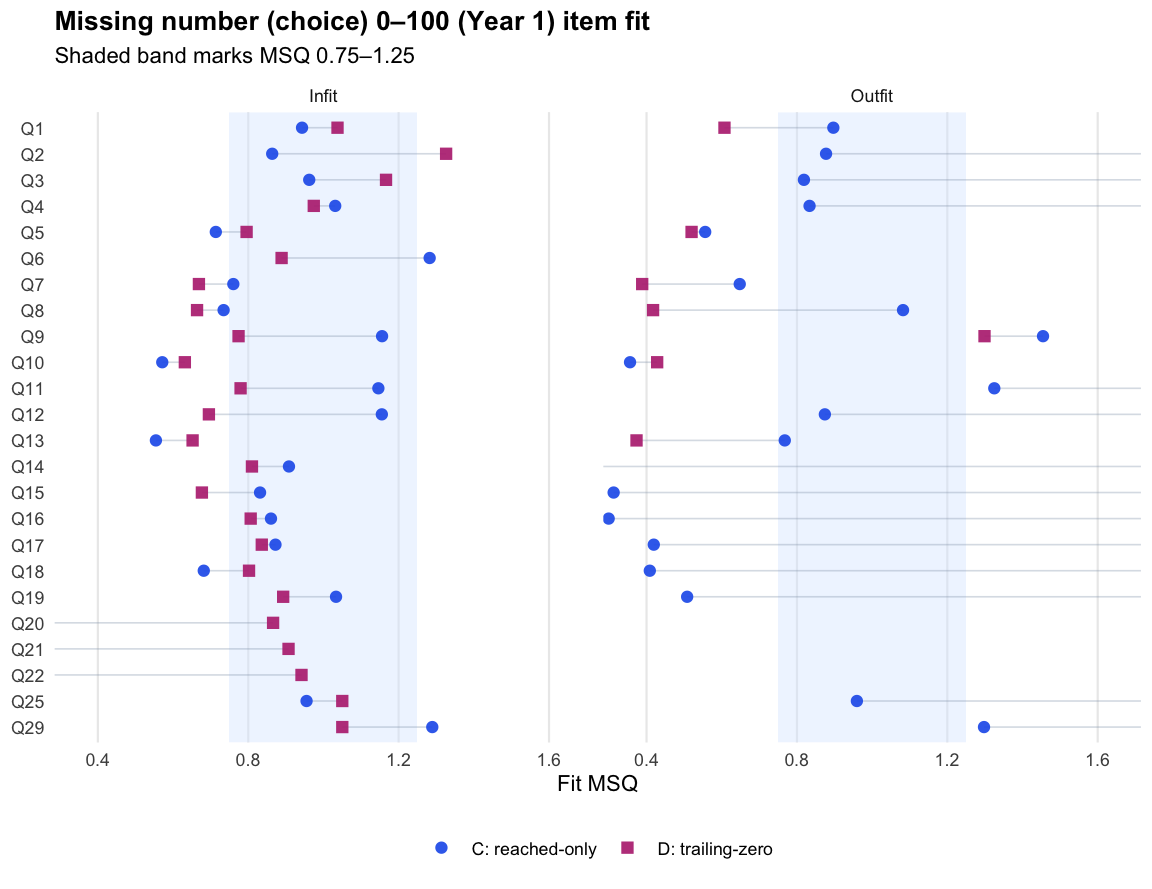
Missing number (choice) 0–100 · Term 3 · MNC0-100_2025
Logit accuracy trailing-zero (D) and Raw sum score (A) order students almost identically; the joint model agrees and adds no material external-alignment gain.
Means and SDs are on each score’s own scale; comparisons across rows should use the rank-agreement and alignment columns.
Model diagnostics
Score
Reliability
Reliability type
Mean SE / posterior SD
Median posterior SD
PSI / posterior PSI proxy
Items used in fit
Fit note
Divergent transitions
Max R-hat
Min bulk ESS
Min tail ESS
Reach–accuracy trait correlation
Logit accuracy on reached (C)
0.469
item-response
1.450
0.825
24
tam_ok
Logit accuracy trailing-zero (D)
0.907
item-response
0.904
3.283
24
tam_ok
Joint accuracy-reach expected credit (F)
0.799
posterior proxy
0.034
0.033
2.009
30
0
1.013
838
1396
-0.131
The F reliability figure is a posterior-variance proxy, not the same metric as TAM reliability.
What the evidence supports
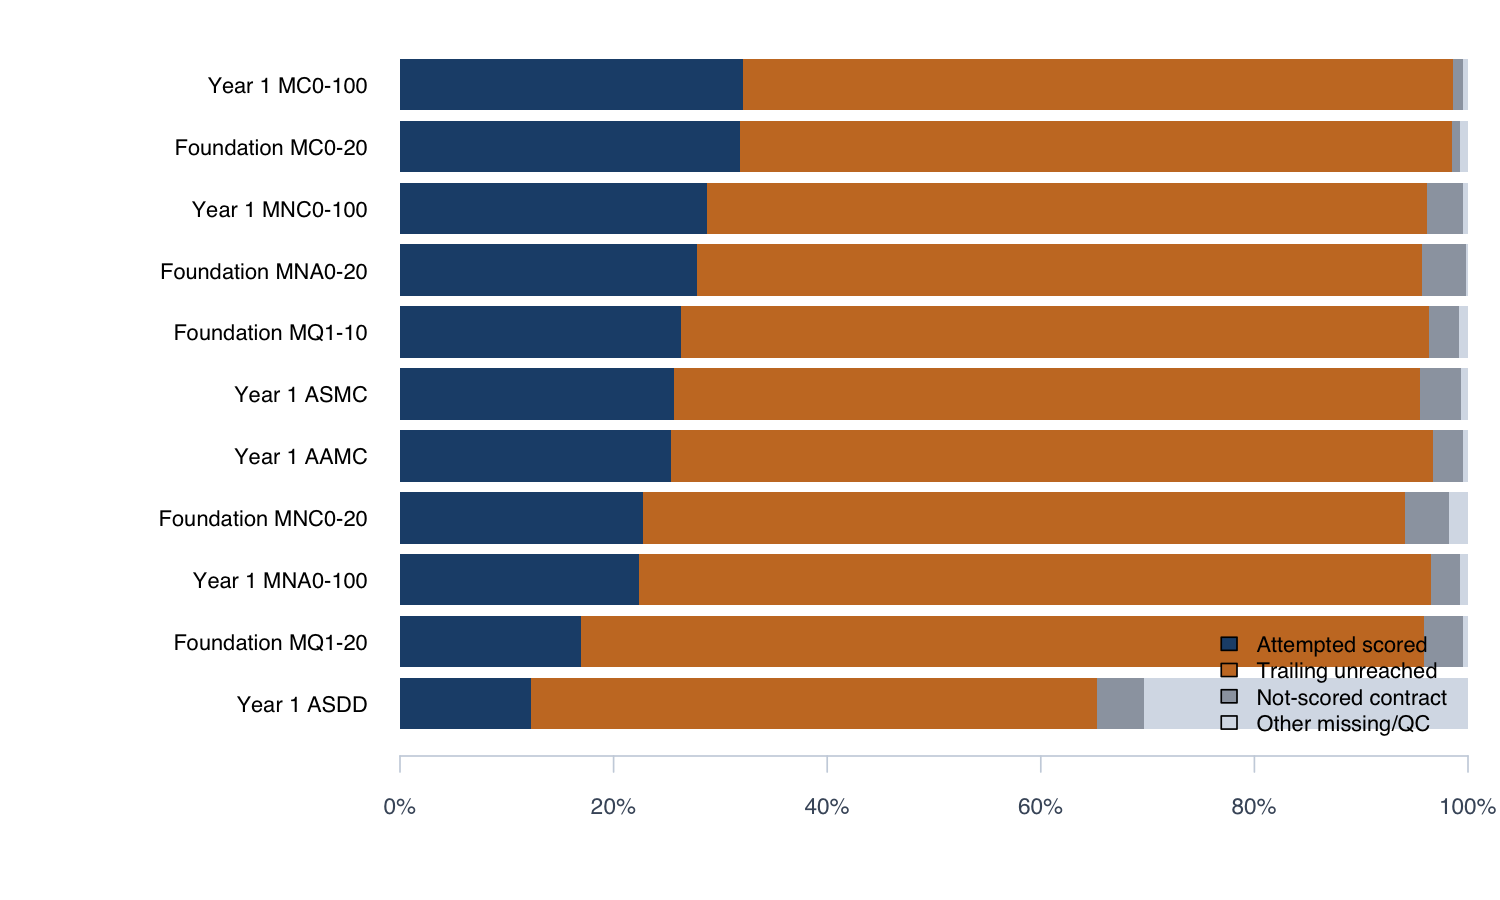
Trailing unreached items dominate nonresponse and concentrate at the end of each timed subtest. Skipped items inside the subtest are rare. That pattern supports treating trailing unreached items as part of timed performance rather than as ordinary missing data.
Scoring trailing unreached items as zero is therefore not a penalty; it is a description of how far the student progressed within the time limit. For a timed score, the denominator should be the timed item set, not only the items the student reached.
The operational scoring model should be Logit accuracy trailing-zero (D): trailing unreached items count as zero, while skipped or leading gaps remain missing. When subtests are modelled in isolation, D orders students almost identically to Raw sum score (A), but adds what a raw count cannot:
item-difficulty weighting,
standard errors and reliability evidence, and
a linking basis for comparing terms and subtests.
Nonetheless, Raw sum score (A) is not necessarily wrong. It is the transparent observed baseline, and because A and D agree so closely, reporting raw sum score instead would be defensible for ENSSA.
Joint accuracy-reach expected credit (F) fitted cleanly (0 divergent transitions across the 11 cells; worst R-hat 1.019) and reproduces D’s ordering almost exactly (median rank correlation 0.989). Its precision proxy sits below D’s reliability (medians 0.75 against 0.87, on different metrics), and external alignment is effectively level: the median difference against D is -0.002 for the latest PAT assessment and 0.002 for teacher ratings. Applied one subtest at a time, the more complex model lands in the same place as the simpler policy. By Occam’s razor, D is the better operational choice at the subtest level.
The remaining question is across subtests. Analyses so far model each timed subtest in isolation. A global hierarchical reach–accuracy model pooling all timed subtests could borrow strength across subtests and report reach and accuracy as separate traits. That global F-style model may prove more reliable or valid than a global version of D.
Next steps:
Compare global D and global F-style scoring.
Compare testlet and no-testlet specifications.
Compare hierarchical multidimensional and unidimensional specifications.
Appendix
Score definitions and legacy column names
presented_ columns in older CSVs refer to the timed item-set denominator; they do not imply on-screen display. Preferred name: full_form_denominator_.
presented_zero and all_presented_zero_sensitivity are legacy names for the timed item-set zero-credit policy and the all-nonresponse-zero sensitivity (variant E).
modelled_expected_full_form_score is a legacy name for expected credit over the timed item set (the F score).
F_stage1_exp_credit is the superseded two-step approximation; Joint accuracy-reach expected credit (F) is the joint Stan model reported here.
Logit score fit detail (Term 3)
Year
Subtest
Item set ID
Score
N students
Items in subtest
Items used in fit
Reliability
Fit note
Foundation
MC0-20
MC0-20_2025
Logit accuracy on reached (C)
1433
38
36
0.626
tam_ok
Foundation
MC0-20
MC0-20_2025
Logit accuracy trailing-zero (D)
1433
60
38
0.939
tam_ok
Foundation
MNA0-20
MNA0-20_2025
Logit accuracy on reached (C)
647
30
25
0.465
tam_ok
Foundation
MNA0-20
MNA0-20_2025
Logit accuracy trailing-zero (D)
647
30
28
0.834
tam_ok
Foundation
MNC0-20
MNC0-20_2025
Logit accuracy on reached (C)
771
28
21
0.602
tam_ok
Foundation
MNC0-20
MNC0-20_2025
Logit accuracy trailing-zero (D)
771
30
22
0.876
tam_ok
Foundation
MQ1-10
MQ1-10_2025
Logit accuracy on reached (C)
783
23
18
0.414
tam_ok
Foundation
MQ1-10
MQ1-10_2025
Logit accuracy trailing-zero (D)
783
30
21
0.824
tam_ok
Foundation
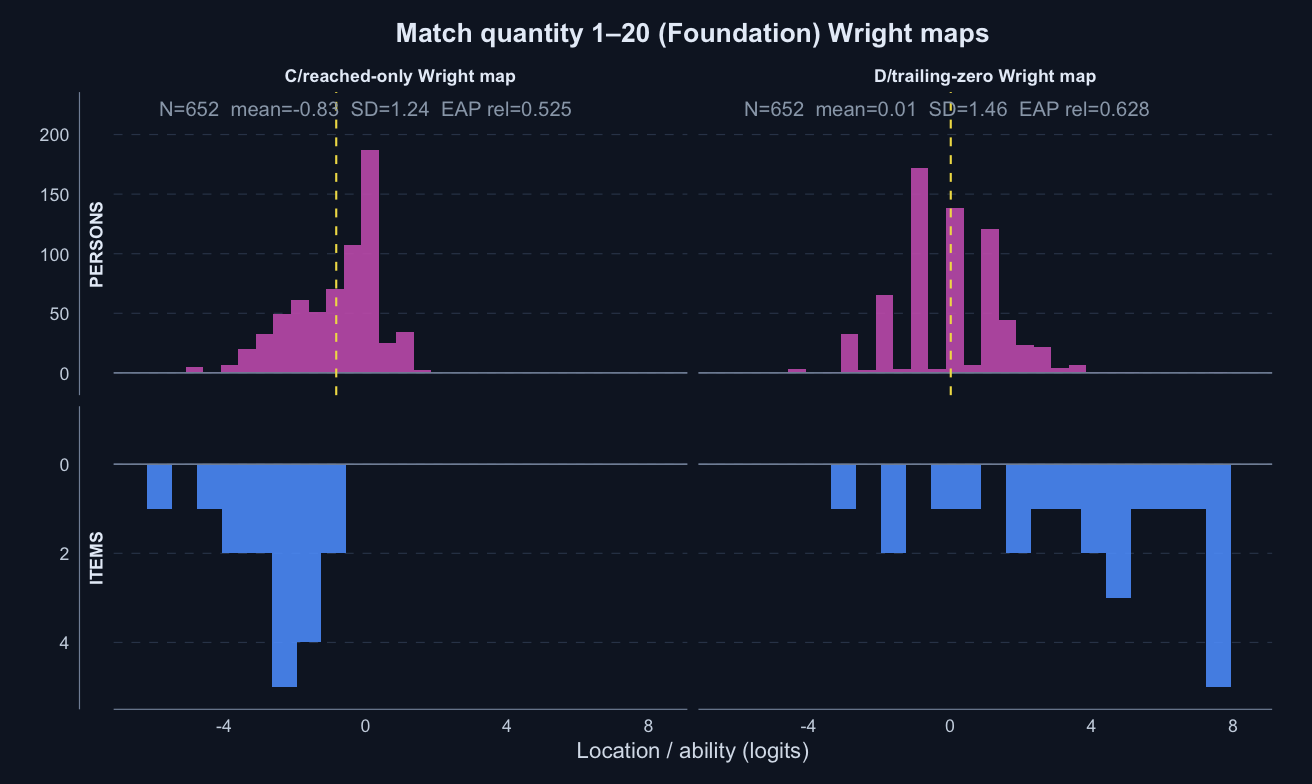
MQ1-20
MQ1-20_2025
Logit accuracy on reached (C)
652
24
17
0.525
tam_ok
Foundation
MQ1-20
MQ1-20_2025
Logit accuracy trailing-zero (D)
652
30
22
0.628
tam_ok
Year 1
AAMC
AADD_2025-NEW
Logit accuracy on reached (C)
1489
35
27
0.541
tam_ok
Year 1
AAMC
AADD_2025-NEW
Logit accuracy trailing-zero (D)
1489
40
30
0.906
tam_ok
Year 1
ASDD
ASDD_2025
Logit accuracy on reached (C)
490
24
17
0.594
tam_ok
Year 1
ASDD
ASDD_2025
Logit accuracy trailing-zero (D)
490
30
24
0.862
tam_ok
Year 1
ASMC
ASDD_2025_NEW
Logit accuracy on reached (C)
784
30
29
0.671
tam_ok
Year 1
ASMC
ASDD_2025_NEW
Logit accuracy trailing-zero (D)
784
30
29
0.874
tam_ok
Year 1
MC0-100
MC0-100_2025
Logit accuracy on reached (C)
1496
39
36
0.636
tam_ok
Year 1
MC0-100
MC0-100_2025
Logit accuracy trailing-zero (D)
1496
60
39
0.943
tam_ok
Year 1
MNA0-100
MNA0-100_2025
Logit accuracy on reached (C)
861
33
29
0.437
tam_ok
Year 1
MNA0-100
MNA0-100_2025
Logit accuracy trailing-zero (D)
861
40
31
0.824
tam_ok
Year 1
MNC0-100
MNC0-100_2025
Logit accuracy on reached (C)
630
30
24
0.469
tam_ok
Year 1
MNC0-100
MNC0-100_2025
Logit accuracy trailing-zero (D)
630
30
24
0.907
tam_ok
Stage-1 expected credit (superseded)
The Stage-1 score approximated expected credit over the timed item set in two steps before the joint model was fitted. It is retained here for context only.
Year
Subtest
Item set ID
N
Completion rate
Accuracy on reached items
Timed item-set score
Stage-1 expected credit
Reached–item-set gap
Year 1
MNA0-100
MNA0-100_2025
867.000
0.224
0.898
0.200
0.191
0.699
Foundation
MQ1-20
MQ1-20_2025
655.000
0.170
0.828
0.133
0.129
0.695
Foundation
MQ1-10
MQ1-10_2025
789.000
0.263
0.930
0.244
0.232
0.687
Year 1
AAMC
AADD_2025-NEW
1495.000
0.253
0.910
0.231
0.221
0.680
Year 1
ASDD
ASDD_2025
703.000
0.123
0.768
0.098
0.083
0.670
Year 1
MNC0-100
MNC0-100_2025
633.000
0.288
0.929
0.265
0.250
0.664
Foundation
MNC0-20
MNC0-20_2025
785.000
0.228
0.848
0.192
0.180
0.655
Foundation
MC0-20
MC0-20_2025
1443.000
0.319
0.916
0.295
0.284
0.621
Foundation
MNA0-20
MNA0-20_2025
648.000
0.278
0.859
0.239
0.228
0.621
Year 1
MC0-100
MC0-100_2025
1503.000
0.321
0.909
0.295
0.285
0.614
Year 1
ASMC
ASDD_2025_NEW
789.000
0.256
0.767
0.199
0.189
0.568
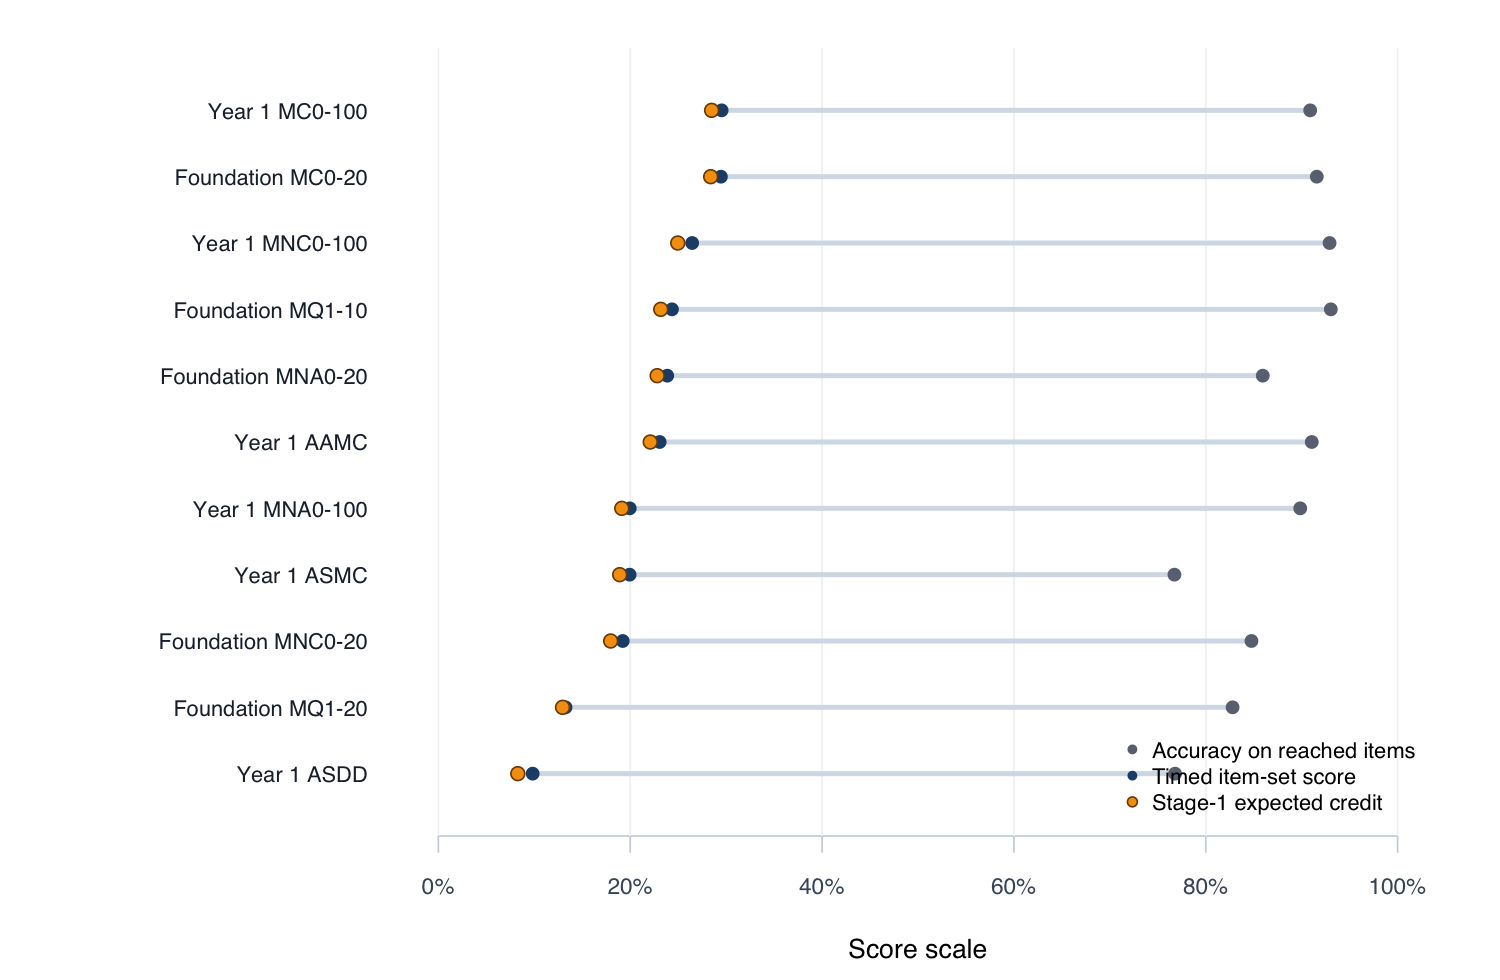
Additional descriptive views
Mean accuracy on reached items (grey), timed item-set score (blue), and Stage-1 expected credit (amber) by subtest.
Response-process composition by subtest. Trailing-unreached rows are the dominant type of nonresponse.
Global composites
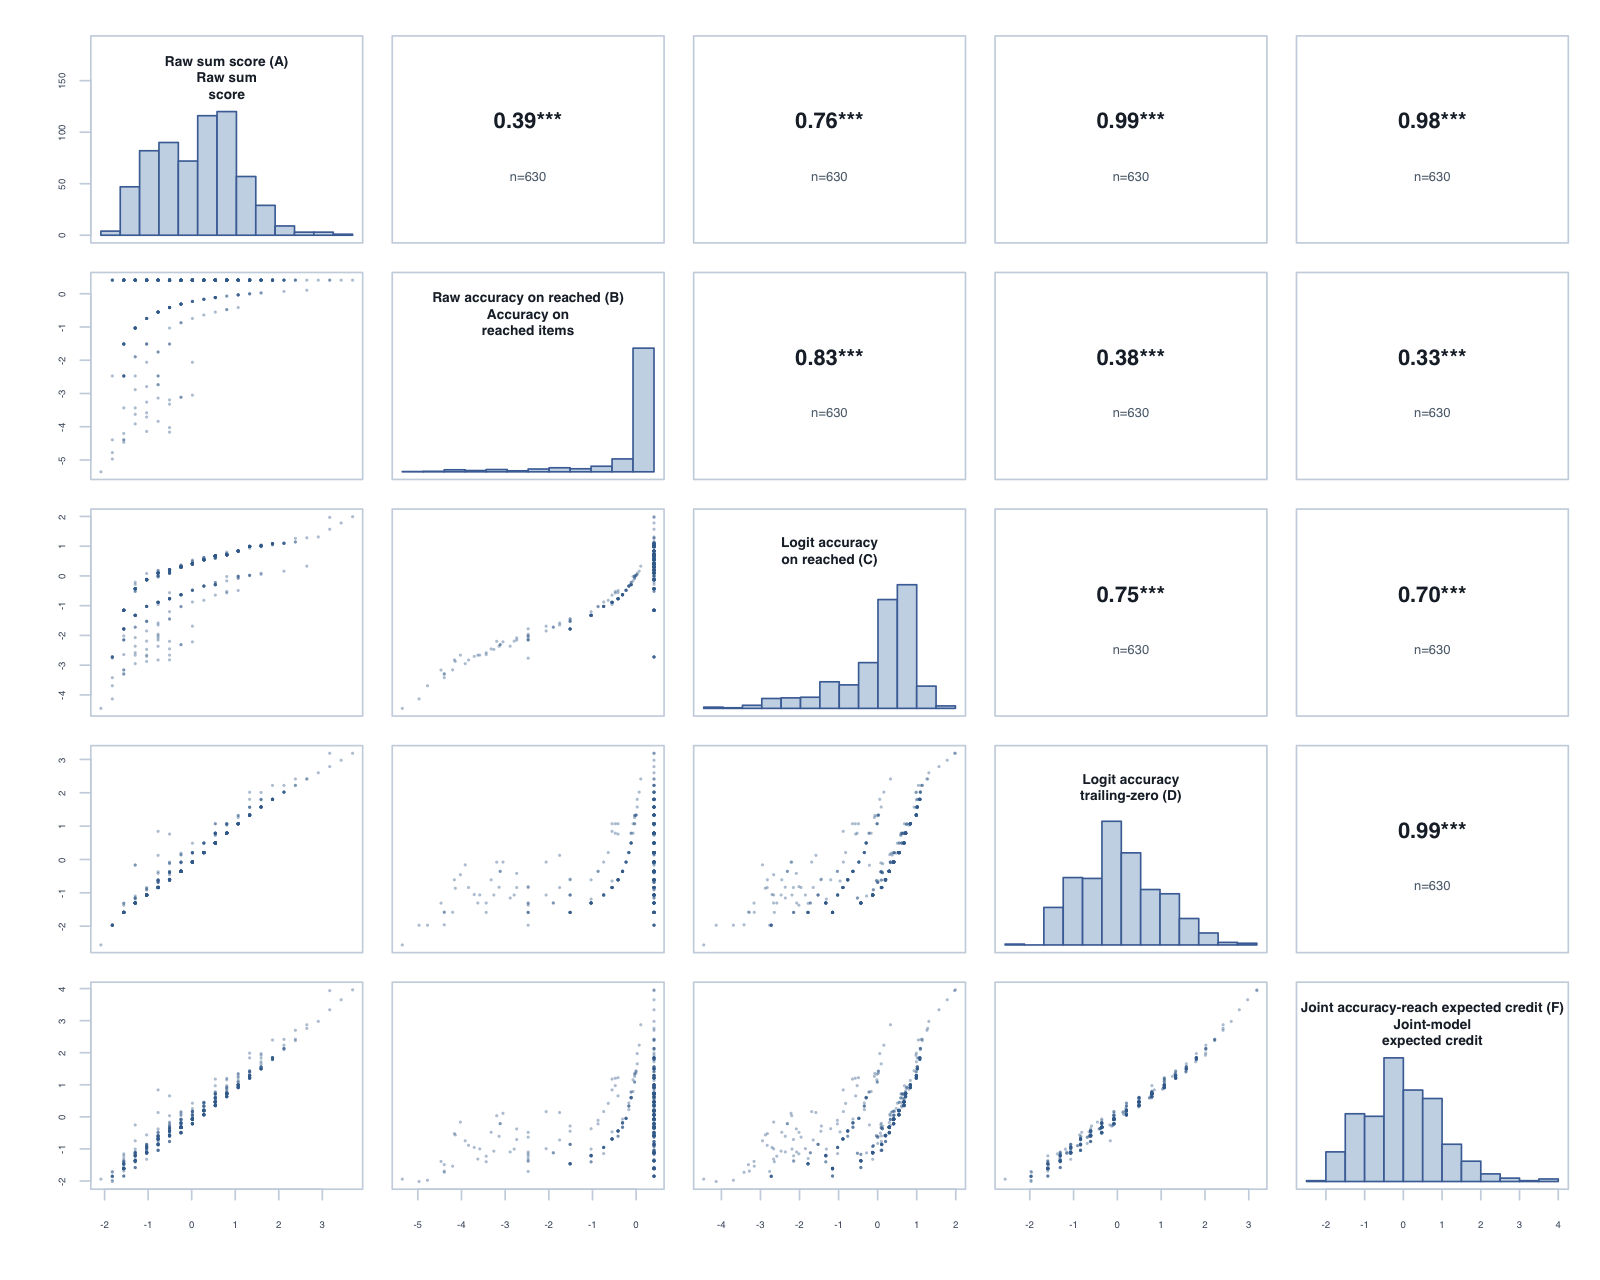
Person-level composites formed by averaging each score’s within-subtest standardised value across the available timed subtests. The subtest-level agreement between the raw, trailing-zero and joint-model scores also holds at the composite level; these composites are the bridge to the planned global hierarchical reach–accuracy model.
Foundation, Term 3: global composite correlations across the five reported scores.
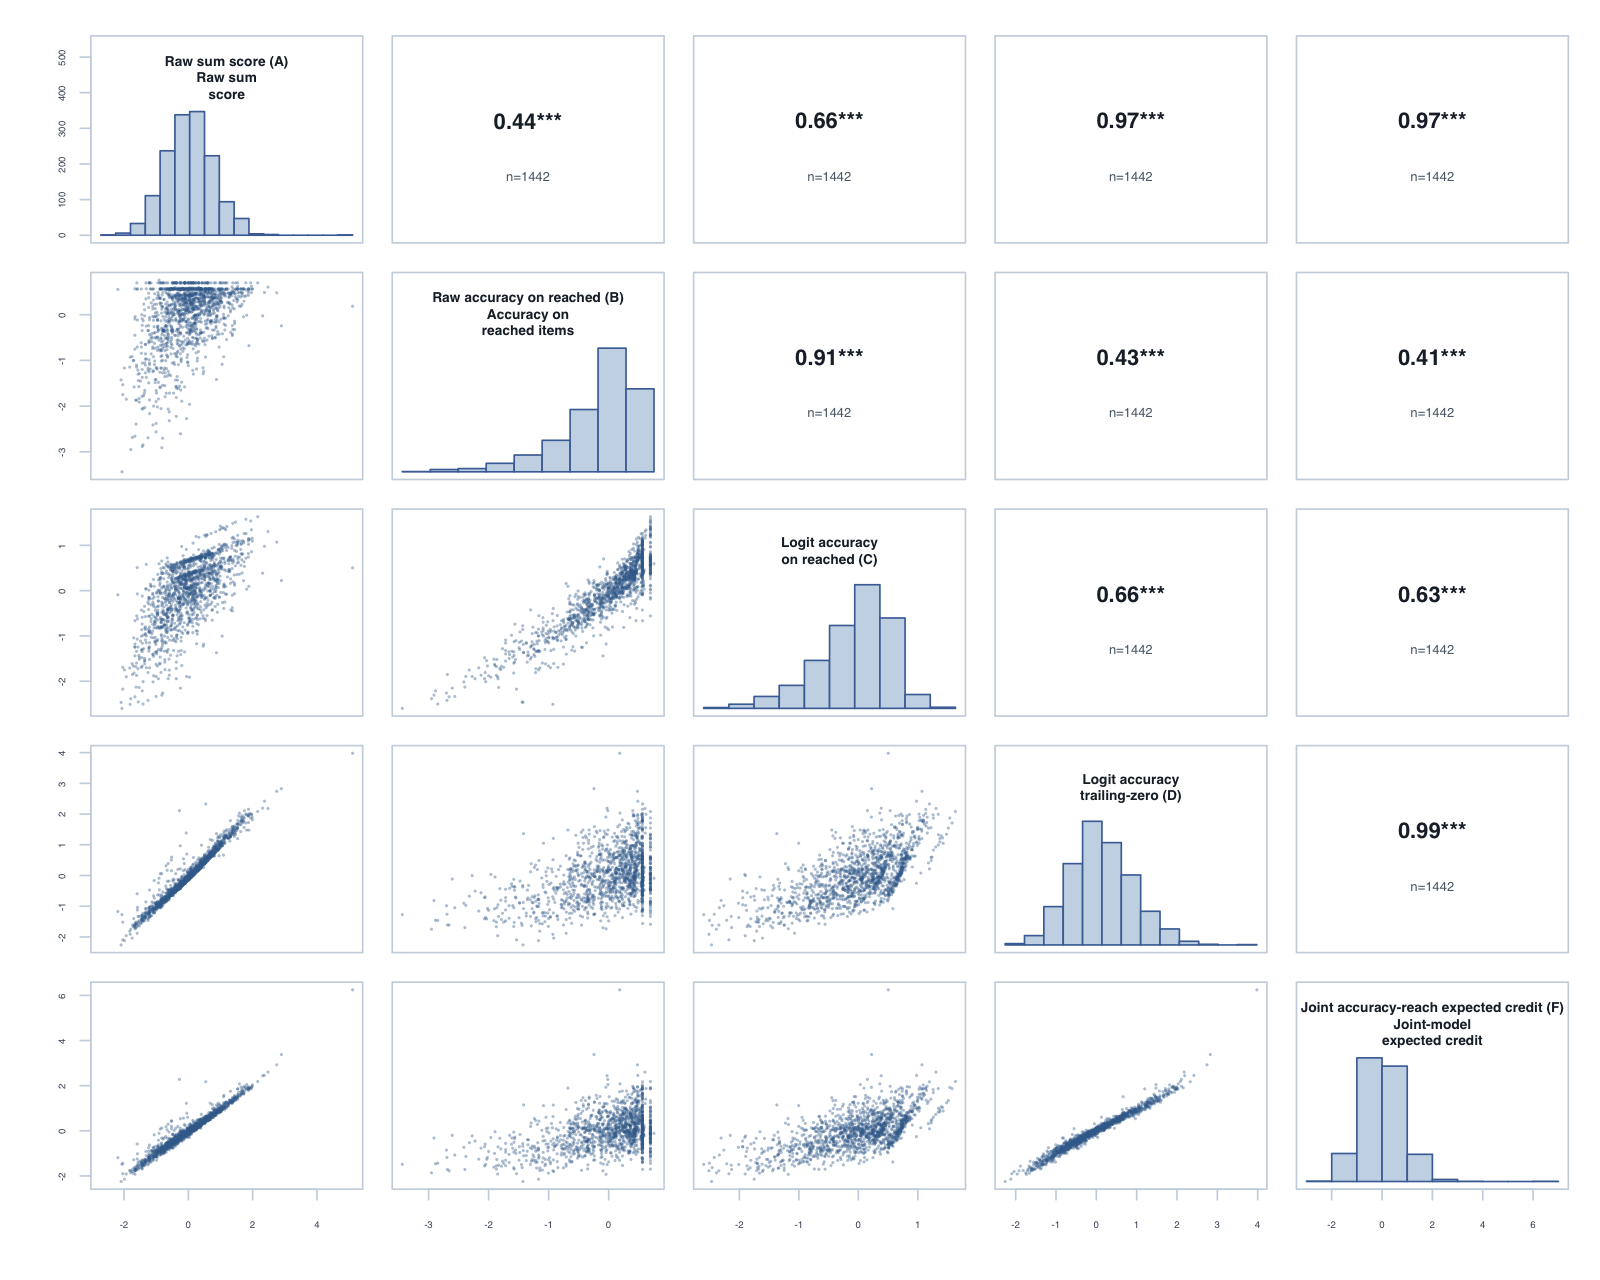
Year 1, Term 3: global composite correlations across the five reported scores.
Subtest score eligibility
The wider subtest audit recommends reviewed, family-specific scoring decisions rather than automatic inclusion of every subtest lookup.